OUALIDIA LAGOON HYDRODYNAMIC AND WATER QUALITY MODELLING : PRELIMINARY STUDIES AND TRAINING
|
|
|
- Wilfred Bradford
- 5 years ago
- Views:
Transcription
1 Report Of The Modeling Working Group OUALIDIA LAGOON HYDRODYNAMIC AND WATER QUALITY MODELLING : PRELIMINARY STUDIES AND TRAINING NATO LEMESM experts: Vladimir G. Koutitonsky Georg Umgeisser Ali Erturk Melike Gurel Javier Gilabert Boris Chubarenko Irina Chubarenko Brenda Rashleigh Nusret Karakaya MOROCCAN experts: Karim Hilmi Jaouad Lakhdar I. Soukaina Zizah Ibtissam Ennafah Fatim-Zahra Bouthir

2 MODELING TASKS Oualidia Lagoon is located on the Atlantic coast of Morocco between Al Jadida and Safi. The lagoon is approximately 7 km long and 0.5 km wide. It exchanges water with the ocean with a major inlet as seen in Figure 1. Figure 1. Oualidia Lagoon The modeling group tasks attempted to adress problems given in INTRODUCTION using a numerical model. The WASP model (Water Quality Analysis Simulation Program) was chosen to address these problems because WASP is freely available from US Environmental Protection Agency, it is well documented and some members from the CCMS group have extensive experience with its use. The water quality and ecosystem modeling group tasks were: 1 to perform simple water quality and ecosystems simulations using the WASP7.1 model WASP is the acronym of Water Quality Analysis Simulation Program Model developed by USEPA. 2 to initiate Moroccan scientists with the use of a simple 3 box WASP7.1 model adapted for Oualidia lagoon. 3 to recommend future avenues for water quality modeling in Oualidia lagoon. The WASP ecosystem model was used to simulate toxic phytoplancton production in the lagoon in response to nutrients coming from the lagoon watershed (diffuse and point sources) and from the ocean. The WASP water quality model was used to simulate coliform introduced into box 1. Finally, the MIKE21 model was used for comparative purposes to simulate coliforms introduced by point sources along the Royal palace. WASP SIMULATIONS The Oualidia Lagoon domain was divided into the 3 segments shown in Figure 2a. These segments were chosen by taking into account the local water renewal times computed by a separate study using MIKE21 high resolution model (Figure 2b).
 Bathymetry and WASP segments, (2b - right) local water renewal times The flows between the boxes were computed by the MIKE21 hydrodynamic simulation produced for the transport of coliforms.")
3 Figure 2. (a - left) Bathymetry and WASP segments, (2b - right) local water renewal times The flows between the boxes were computed by the MIKE21 hydrodynamic simulation produced for the transport of coliforms. The cross-section area elevation curves for the WASP model were produced using an external computer program developed by the modeling group. This program is designed to read the model grid data exported from MIKE 21 and generate these curves. WASP ECOSYSTEM SIMULATION: PHYTOPLANCTON PRODUCTION An ecological model was set up to simulate the phytoplankton, which may excrete toxics when they bloom and therefore cause problems for shellfish farming. EUTRO as implemented in WASP 7.1 was used to construct the ecological model. This version of EUTRO is quite complex with 16 state variables and around 100 model coefficients. In this initial modeling study, a simplified pelagic model (see the Figure below) was set up using the capabilities of EUTRO partly.
4 Figure 3: Ecological model used for phytoplankton simulations The model structure allows to simulate the nutrient cycles and primary production, so that once the model has been set up and validated, it will be used as a support tool for predicting the harful algea blooms and taking the precausions. The model results obtained from initial simulations (done under the pressure of time and data scarsity) are given in Figures 4 to 9 below. Figure 4 are results for actual conditions while figure 5-9 show results if the loads are reduced by 50% to 90 %.


5 Figure 4: Chlorophyll-a resulting from actual loads (100%). Figure 5: Nutrient load reduction by 50%.


6 Figure 6: Nutrient load reduction by 75% Figure7: Nutrient load reduction by 90%.
 and in Box 3.")
7 Figure 8: No antropogenic loads inputs As seen in Figure 4, relatively high Chl-a concentration are present in the lagoon under current nutrient loads. Results indicate in high phytoplankton production in Box 2 (where most of the shellfish farms are located) and in Box 3. As expected, the effects of tidal oscillations as well as neap and spring time effects were reproduced by the ecological model. WASP WATER QUALITY SIMULATION: COLIFORMS Water Quality Model The water quality model is based on first order decay of coliforms. EUTRO has state variables which can be used to emulate the first order decay of coliforms. A decay rate of 0.8 day -1 for 20 O C was used. The model corrects this decay rate due to temperature. The results are given in Figure below. The same inputs used in MIKE 21 simulations for coliform were used. These are 20 l/s source inputs in box 1 and coliform concentration sof coliforms per 100 ml. Results in figure 9 show that the concentration in box is higher as expected and they are significantly reduced in boxes 2 and 3.
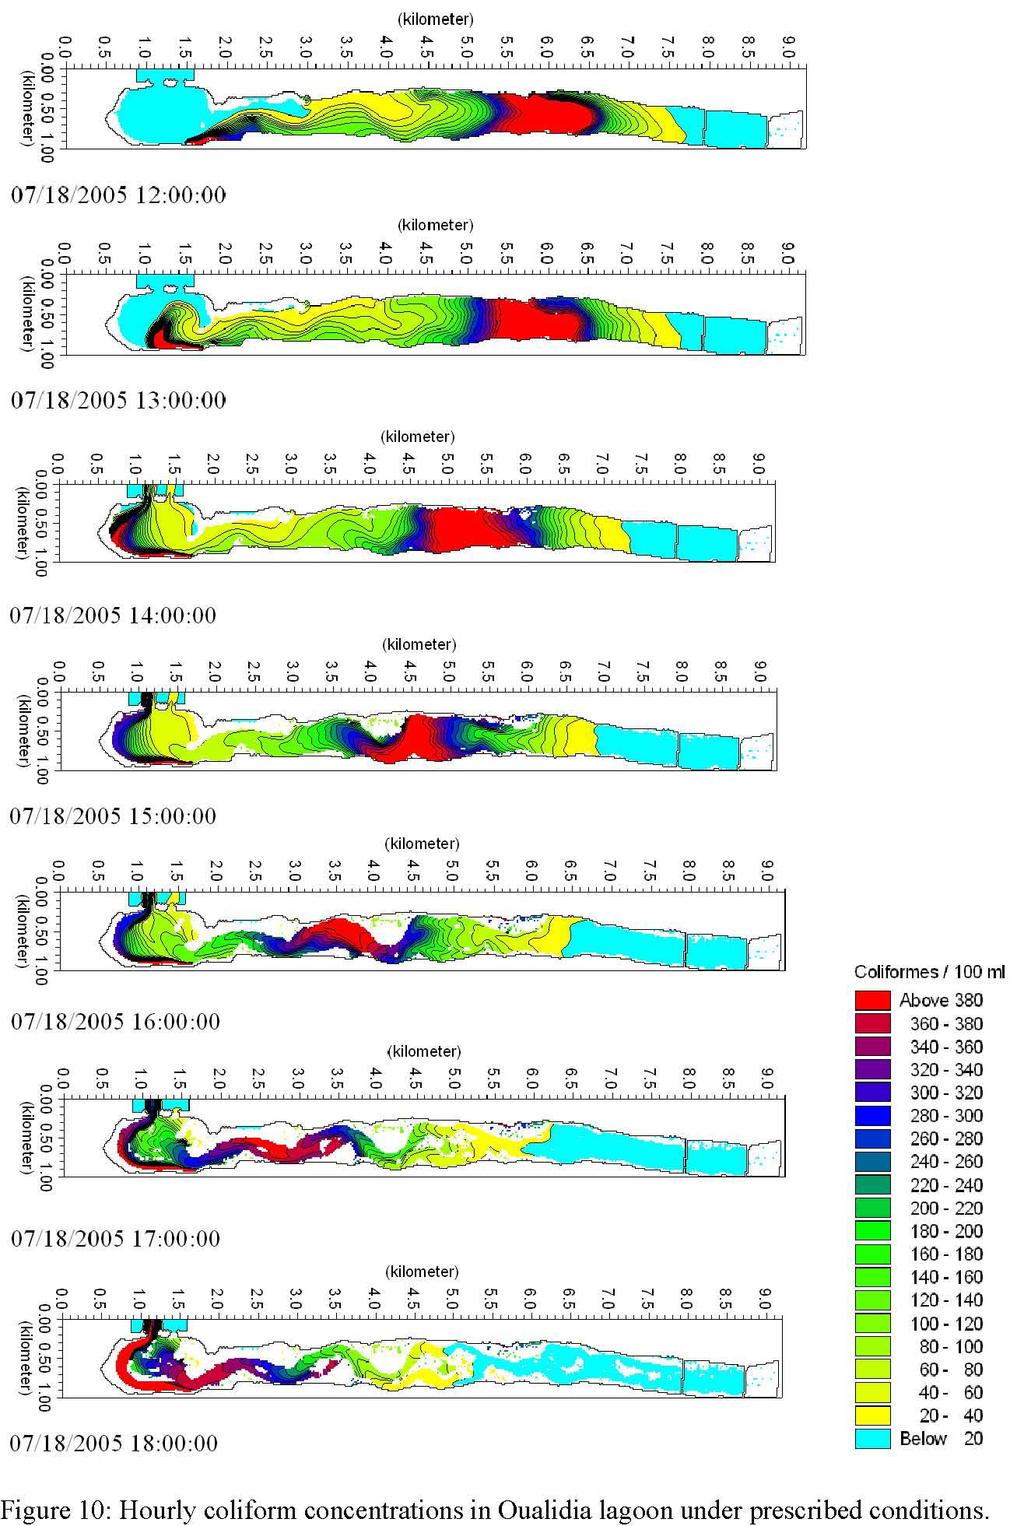
8 Figure 9: Coliforms concentrations in boxes 1, 2 and 3. MIKE21 WATER QUALITY SIMULATION: COLIFORMS The MIKE21 coliform simulation was made using the coupled hydrodynamic (MIKE21HD) and advection-dispersion (MIKE21-AD) modules. The computational grid used was constructed from bathymetric soundings measured in 2002 and updated in The computations were made at a 15 s time step, from 4:00 hrs on 14 July 2005 until 10:00 hrs August The hydrodynamic model was forced by tides measured outside the lagoon by INRH in The coliforms were injected from adjacent sources located near the Royal Palace in the downstream end of the lagoon. They were injected at a rate of 20 liters per second and a concentration of coliforms per 100 ml and they were allowed to decay at a rate of 0.8 per day The MIKE21 results are shown for 13 consecutive hours on figure 10. They show that the coliforms introduced downstream will spread upstream with flood tides while decaying and exit the lagoon during ebb tides.

9
10
11 RECOMMENDATIONS In this chapter we provide some recommendations for future studies and model applications that might be carried out for the Qualidia lagoon. These recommendations have been compiled in order to increase the knowledge on the lagoon ecosystem due to incomplete studies in the past or because new data and more insight in the processes has become available. Water budget A sound water budget is needed for the lagoon. As mentioned before, the water level of the lagoon is steadily changing due to the tidal influence and several variables involved in the water budget: precipitation, evaporation, and ground water flow. All these variables should be re-evaluated and a new water budget should be estimated. This can be then introduced into a simple hydrographic model that could estimate the sensitivity of the water budget (salinity gradient) on the various forcings and possibly explain the observed salinity gradients. Hydrodynamic modeling Data on currents and circulation of the lagoon is still scarce. Some measurement campaigns have been carried out in the past, but the data is not comprehensive. Especially the bathymetry needs more work. The incomplete bathymetry on the inlets falsifies the circulation pattern that has been deduced from the data. It is therefore recommended that some more field campaigns be planned and that the data be used for the calibration and validation of models that will be applied to the lagoon. Ecological modeling The ecological modeling in terms of water quality dynamics simulations is strongly needed for estimation of the capacity of sewage water treatment plants around the lagoon and to the forecast the water quality for the oyster farms. This capacity must take into account the present situation and prospective plants of population growth, development of economical activity and resort facilities. The following types of ecological models are also needed for the Qualidia lagoon as a tool for water management: A zero-dimension basin model to simulate the seasonal dynamics in total runoff to the lagoon and evaporation to resolve peculiarities in long-term variations. Special considerations must be given to the surrounding fresh water inputs. A water quality model (such as WASP) which is able to resolve the spatial (including vertical) variability of water quality parameters (BOD, COD, suspended matter in different forms, chlorophyll concentration) as well as its seasonal temporal dynamics Monitoring Monitoring of physical and biochemical properties is important for the scope of numerical modeling. The most important quantities to monitor are water level variations (almost continuous, inside and outside) ground water discharges (daily) temperature and salinity (continuous at open boundary, weekly or monthly in the inside), if possible also vertical structure water quality variables (monthly, but more frequent for seapage loading)
12 meteorological parameters such as wind, radiation, air temperature, humidity, precipitation and evaporation, etc. (order of hour) remote sensed images for morphological changes in the delta The quality of data should be checked continuously. Especially important are the regular calibration of the sensors (water level, T/S, wind) in order to provide reliable boundary conditions for the model. The sampling points should be representative for the variables measured. General recommendations It is recommended to develop a project proposal whose overall objective is to develop modeling tools for environmental authorities to facilitate their every day management practices and decision making. Models or system of models will help decision makers to clarify the reasons of existing trends in water quality conditions, to make an environmental impact assessment and to develop short-term and long-term predictions according scenarios of economical and civilian development in the lagoon watersheds. The project deliverable will be a system of models for the assessment of water quality and pollution transport in the lagoon. This system of models will be transferred to local authorities together with appropriate database on the GIS platform. The local experts will be trained to use these powerful modern tools during the project on the examples of analysis of different scenarios developed by local authorities. Two schemes for project realization can be considered: a consecutive scheme, during which the project first focuses the water quality of the Qualidia lagoon, and later the application of a sediment transport model to forecast the long term evolution of the lagoon morphology. The designed common data base and knowledge base should rely on the integration of all historical data and information available in different institutes, institutions or research teams, about the lagoon ecosystem's dynamics and past and current policies and management plans. After filling in the designed data and knowledge base with historical and quality assessed data and information, the first version of the information system to support integrated and adaptative management of the Qualidia lagoon should be available for the users. Moreover, the gaps and shortages in data and knowledge could be identified that will help to focus data collecting (monitoring) and research. Data and knowledge should be effectively made available for decision making and scenarios development through a package of dynamic mathematical models describing structural and functional changes in the lagoon, under different driving forces and pressures. There is a need for mathematical models of different complexity in order to meet the wide range of requirements for decision making (e.g. specific models for water quality; dynamics of fish resources; but also complex models able to describe the overall lagoon processes under major driving forces); The assessment of the lagoon's economic value (TEV - total economic value) is a fundamental condition for decision making; Ecologists and ecological modelers have to plan in advance a common working program which takes into consideration: types of required data (parameters and state variables); methods for data collecting; data quality assessment etc.