2016, 2017 Estuarine Water Quality and Modeling in the Royal and Cousins Rivers
|
|
|
- Corey Stokes
- 5 years ago
- Views:
Transcription


1 2016, 2017 Estuarine Water Quality and Modeling in the Royal and Cousins Rivers Angela Brewer and Robert Mohlar Division of Environmental Assessment Bureau of Water Quality Protecting Maine s Air, Land and Water
2 Royal River estuary impairment DO non-attainment measured during July 1992 when Yarmouth POTW requested flow increase from 0.84 to 1.31 MGD Resulted in estuary Category 5-A listing 1996 DEP Waste Load Allocation based on 1990, data Daily water quality model predicted DO non-attainment under all POTW discharge scenarios, including no discharge ~60% of DO non-attainment on high and low tides due to Sediment Oxygen Demand (SOD), 9.6% from POTW effluent at permitted flow Recommendation to repeat monitoring after dredge to determine if sediment removal would improve DO conditions
3 303(d) Vision for Cat. 5-A waters for Royal River estuary on Priority Waters List, with intent to collect low flow data, reassess Waste Load Allocation, adjust Yarmouth POTW permit as needed goal to move to Cat. 4-B DEP data collection during discrete sampling every three weeks from June-Sept. on alternating ebb and flood tides, continuous data collection Temperature (c) Salinity (c) ph (c) Dissolved oxygen (c) Turbidity Chlorophyll Nitrogen, Phosphorus Total Suspended Solids Transparency (Secchi) Light attenuation (PAR)
4 Map shows DEP sites from 1996 Waste Load Allocation DEP 2016, 2017 Royal River sites as red circles As in , freshwater influence restricted to top ~1m On ebb tide, fresher surface through mid-estuary On flood tide, fresher surface only just below head of tide

5 DO % Saturation RM 0.1 RM 0.6 RM 1.3 RM 1.9 DO % sat. independent of distance from head of tide Magnitude of DO ranges consistent across sites with lowest % sat. during late ebb tides Chlorophyll a values mostly low to moderate with no correlation to DO or tide stage 85% saturation threshold for Class. SB waters
6 Median TN (mg/l) Median TN (mg/l) DEP (2013, 2016, 2017) & FOCB ( ) POTW outfall R² = Distance from Head of Tide/River Mile RM 00 RM 0.6 RM 1.3 RM 1.9 Yarmouth POTW median effluent TN during 1993 (25.1 mg/l) and 1994 (3.3 mg/l) studies Since start of DEP data collection, ambient DIN:TN at Royal estuary sites ~consistent Median DIN:TN pattern follows salinity gradient ( from Head to Mouth) mg/l threshold using DO as indicator
7 Royal River Summary Discrete 2016, 2017 DO data consistent with 1993, 1994 patterns [TN] and [DIN] values decline with distance from Head of Tide and with increasing salinity Discharge permit [TN] threshold for protection of aquatic life with DO as indicator exceeded up estuary from POTW outfall Influence of POTW effluent on ambient nitrogen not detectable at sites surrounding outfall (~0.35 mile) Role of SOD likely remains a critical component of water column DO due to extensive tidal flats and relatively small estuary tidal volume Need another summer of study that captures rainfall events to better characterize watershed impacts
 Proximity to Royal River 2) Casco Bay example of an estuary whose habitat is dominated by brackish marsh")
8 Cousins River estuary Estuary listed as impaired (shellfish harvest closure) due to fecal indicator bacteria not motivation for 2017 DEP study Currently listed as Cat. 5-B DEP interest in Cousins River estuary due to: 1) Proximity to Royal River 2) Casco Bay example of an estuary whose habitat is dominated by brackish marsh
(see unattended sonde DO data) Trib.")
9 85% saturation threshold for Class. SB waters DO % sat. at Head of Tide sites very dynamic, with regular nonattainment, even during late morning to mid-day RM 0.0 RM 0.0 RM 3.1 RM 4.4 DO % sat. values independent of tide stage Chlorophyll a values generally low-moderate throughout estuary with high concentrations from: Cousins R. marsh (late June)(see unattended sonde DO data) Trib. (mid-july) (85 µg/l!) Estuary in mid-sept. (Karenia mikimotoi bloom?)
10 DEP (1996, 2017) & FOCB ( ) Median TN (mg/l) Median TN (mg/l) R² = Cousins River Royal River R² = Distance from Head of Tide/River Mile CRTRIB0 CR00 CR-31* CR-44 Ebb Tides Flood Tides Upper estuary TN generally higher than in Royal Tide direction-based data suggest marsh source of high TN Median DIN:TN higher near Head of Tide, not clearly sourced from watershed or marsh DIN patterns likely confounded by utilization
11 Cousins River Summary DO % saturation and chlorophyll a values indicate especially productive system closer to Head of Tide [TN] and [DIN] values decline with distance from Head of Tide and with increasing salinity Tide direction-based TN data suggest marsh source Further investigation needed to assess contribution of suspended sediment, particulate organic matter, color dissolved organic matter to water column turbidity Data would benefit from an additional survey summer that captures rainfall events to better characterize watershed impacts

12 Eelgrass coverage Eelgrass loss between 2001 and 2013 surveys attributed to invasive green crab disturbance Evidence of rebound since 2013, will be mapped in 2018

13 Median Kd (m -1 ) Kd (m -1 ) Royal River Cousins River y = x R² = y = x R² = RR-01 RR-06 RR-13 RR-19 CR-31 CR-44 Site Total Nitrogen (mg/l) Minimal habitat available along low intertidal, shallow subtidal shoreline, periodic dredging disturbance Light limiting for eelgrass maintenance at all Royal and Cousins sites based on 0.75 m -1 Kd threshold value (NHDES 2009) At sample level, comparable TN and Kd distributions skewed by high Kd on Cousins River ebb tides

14 Continuous Data Monitoring Locations

15 Notes: Most extreme data (highs & lows) occurs during minimal tidal range periods and at low tide. Dissolved oxygen non-attainment is fairly brief, but occurs regularly.

16 Notes: Humps and sags associated with high and low tide respectively. Non-attainment is more persistent in the further inland locations. Non-attainment is generally fairly brief (this is the worst of it).
17 Royal River Loading Estimates Point Sources Yarmouth POTW is the only significant Point Source load to the Royal River. Significant amount of data available to quantify this point source load. Loads are calculated from measurements of Discharge Flow Rate and Effluent Concentration : Flow (mgd) x Concentration (ppm) x 8.34 = lbs/day Non-Point Sources (NPS) Estimated by using land area based watershed models. Variety of these types of models with differing strengths/weaknesses My data based on GWLF-E; Wiki Watershed Model My Watershed Precipitation, Land Cover are the primary influences on NPS loadings. Incorporate a lot of estimates, generalizations and assumptions and results should be used with a degree of caution. Informative nonetheless.

18 Derivation of Non-Point Source Nitrogen Loadings
19

20 Sources Total Nitrogen (lb) Total Nitrogen (%) Hay/Pasture 11, Cropland 5, Wooded Areas 12, Wetlands 5, Open Land Barren Areas Low-Density Mixed 3, Medium-Density Mixed 1, High-Density Mixed Other Upland Areas Farm Animals 8, Stream Bank Erosion 26, Subsurface Flow 95, Point Sources 36, Septic Systems 3, Totals 212,
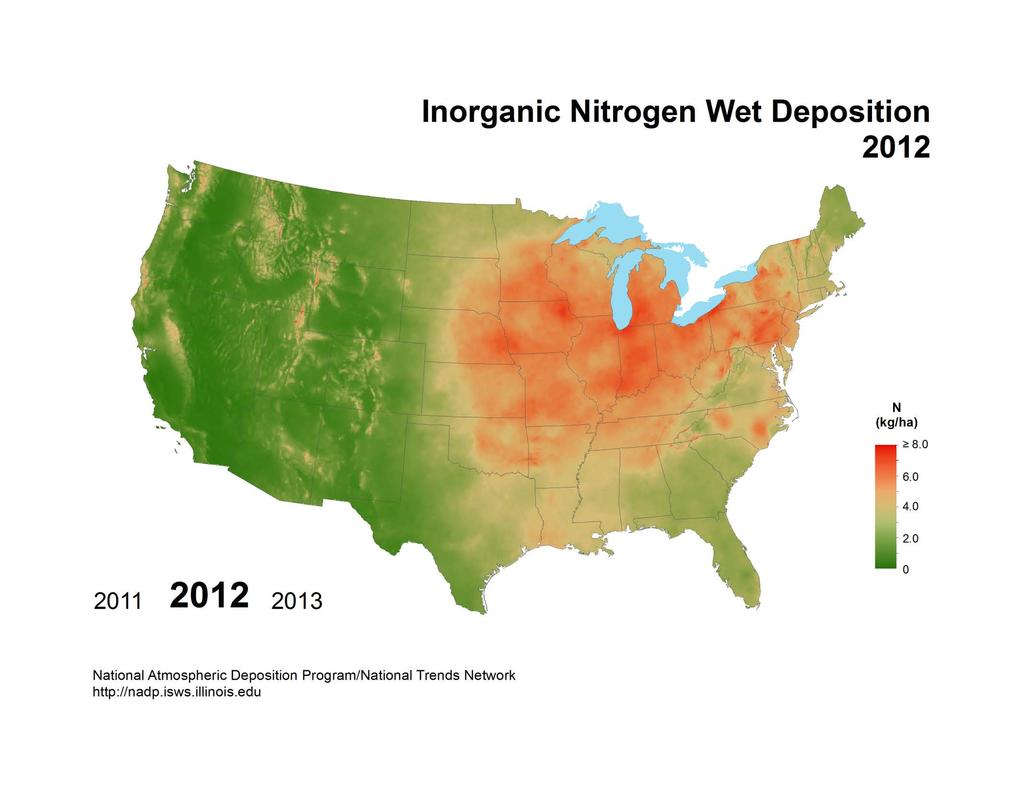
21 A Few Thoughts NPS Approximately 70% of NPS load is associated with Ground Water (55%) and Streambank Erosion (14%). Point Source Approximately 17% of the total nitrogen load to the Royal River estuary. Available dilution from tidal flushing is estimated to be approximately 1,000:1. This projects to a relative influence on ambient total nitrogen of approximately mg/l. National Atmospheric Deposition Program Model My Watershed

22 Angela Brewer Contact: Robert Mohlar