Idaho Power s Transmission System. Greg Travis Nov. 8, 2018
|
|
|
- Amberlynn Hill
- 5 years ago
- Views:
Transcription
1 Idaho Power s Transmission System Greg Travis Nov. 8, 2018
2 Presentation Outline Acronyms and definitions Energy Imbalance Market (EIM) Idaho Power s transmission system Path 14 ID-NW Open discussion
3 Acronyms and Definitions ATC: Available Transmission Capacity Long-term firm transmission capacity not previously allocated Transmission path: A single transmission line or multiple adjacent lines. Transmission contingencies: N-1: Loss of any single element Credible N-2: Loss of two elements with a significant probability of occurrence (common structure) WECC: Western Electricity Coordinating Council Regional Reliability Organization and Compliance Monitor as defined by the North American Electric Reliability Corporation (NERC)
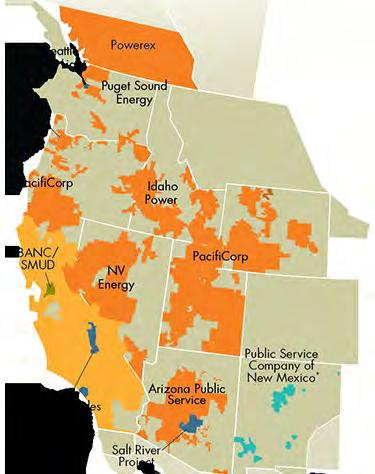
4 EIM

5 Western Transmission System

6 Southern Idaho System Overview Path 14 Idaho-Northwest Import ATC =0 MW Path 55 Brownlee East East of Boise Midpoint West Path 18 Montana Idaho Import ATC = 0 MW Import ATC = 86 MW Path 19 Bridger West Path 17 Borah West Path 16 Sierra - Idaho ATC = 26 MW Path 20 Import ATC = 0 MW Path C
 2,250")
7 Path 14 Idaho Northwest Existing Path 14 1,200 MW Rebuild alternative 1,965 MW New line (B2H) 2,250 MW
8 Summary The EIM is beneficial and Transmission makes it possible. Idaho Power s transmission system is highly reliable providing operational flexibility and access to a diverse pool of resources. However, there is very little ATC. Increasing transmission capacity to the Northwest is a good option moving forward.
9 Open Discussion
10 Boardman to Hemingway Transmission Line Project IRPAC, November 2018

11 BOARDMAN TO HEMINGWAY TRANSMISSION LINE PROJECT PROJECT OVERVIEW 500 kv transmission line 500 MW summer, 200 MW winter Connecting SW Idaho with Mid-C market Proposed by Idaho Power along with permitting partners (PacifiCorp, BPA)

12 BOARDMAN TO HEMINGWAY TRANSMISSION LINE PROJECT PURPOSE & NEED Least-cost, least-risk resource 5 IRPs in a row Provide energy for customers across Mountain West and Pacific Northwest Flexibility: able to accommodate future changes in technology

13 BOARDMAN TO HEMINGWAY TRANSMISSION LINE PROJECT COSTS Total cost to date is ~$99 million Total cost estimate is $1 to 1.2 billion, includes: Permitting Engineering Construction Substations 20% contingency Idaho Power AFUDC


14 BOARDMAN TO HEMINGWAY TRANSMISSION LINE PROJECT BENEFITS Provide energy, reliability, and resource flexibility Low operational costs Increased access to robust market hub Operating B2H is carbon neutral Remove constraints on the existing grid Regional efficiency and economic transferability
 = 0 MW by 500 MW summer/200 MW")
15 Idaho-Northwest Transmission Path Idaho-Northwest Transmission Path B2H Increases Available Capacity for IPC Available Capacity (Import) = 0 MW by 500 MW summer/200 MW winter
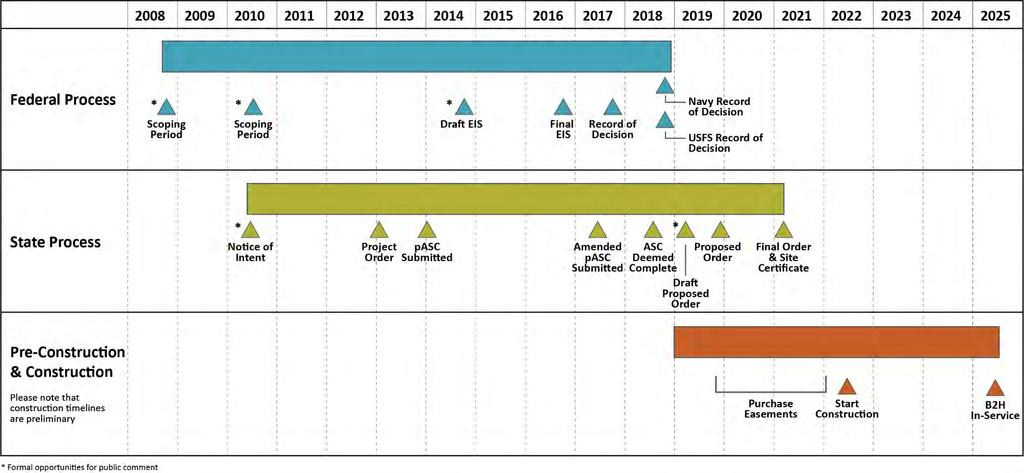
16 Process & Milestones

17 BOARDMAN TO HEMINGWAY TRANSMISSION LINE PROJECT ACHIEVEMENTS BLM review and routing process completed Navy and USFS decisions expected soon Oregon DOE application deemed complete Outreach to landowners along project Outreach with stakeholders continues mitigation and micro-siting


18 BOARDMAN TO HEMINGWAY TRANSMISSION LINE PROJECT THANK YOU! Jeff Maffuccio
19 2019 IRP Supply-Side Resources
20 IRP Resource Options Solar PV Single-axis tracking, utility scale Solar PV Residential and commercial rooftop Lithium battery Zinc-Bromine flow battery Wind Idaho and Wyoming Geothermal Reciprocating engines (natural gas) Simple-cycle combustion turbine (SCCT) (natural gas) Combined-cycle combustion turbine (CCCT) (natural gas) Pumped-storage hydro Nuclear Small modular reactor (SMR) Small hydro
21 Cost Information - Source NREL (National Renewable Energy Laboratory) Annual Technology Baseline. Golden, CO: National Renewable Energy Laboratory.
22 Solar PV Utility-Scale, Single-Axis Tracking Seasonally correlated with load (summer) Zero variable costs Capital costs trending downward Renewable Scalable Annual capacity factor (CF) = 26% * Seasonally uncorrelated with load (non-summer) Uncertain Variable Project-to-project correlation June July CF = 41% Dec Jan CF = 9% *Note: Solar PV CF data from NREL PVWatts, Mt. Home, Idaho site
23 Utility-Scale Solar PV Capital Costs $1,400 $1,300 $/kw_ac (2016 $) $1,200 $1,100 $1,000 $900 $ Source: NREL 2018 ATB, Mid Technology Cost Scenario
24 Utility-Scale Solar PV Capital Costs $1,400 $1,300 $/kw_ac (2016 $) $1,200 $1,100 $1,000 $900 $ Source: NREL 2018 ATB, Mid Technology Cost Scenario

25 Utility-Scale Solar PV Capital Costs $1,400 Investment Tax Credits (ITC) $1,300 $/kw_ac (2016 $) $1,200 $1,100 $1,000 $900 $800 Fixed O&M = ±$9/kW year Zero variable costs Useful life = 25 years Source: NREL 2018 ATB, Mid Technology Cost Scenario
26 Lithium Battery Capital Costs $/kw_ac (2016 $) $3,300 $2,800 $2,300 $1,800 $1,300 8-hour battery 4-hour battery Assumed round-trip efficiency = 85 90% Useful life = 10 years Fixed O&M = ±$8/kW year Variable O&M = ±$2/MWh $ Source: NREL 2018 ATB
27 Zn Br Flow Battery Capital Costs $/kw_ac (2016 $) $1,800 $1,700 $1,600 $1,500 $1,400 $1,300 $1,200 $1,100 $1,000 $900 $ Source: Lazard s Levelized Cost of Storage Version 3.0 (Nov. 2017) Assumed roundtrip efficiency = 65 70% Useful life = 20 years Fixed O&M = $12.75/kW year
28 Utility-Scale Solar PV and Battery $/kw_ac (2016 $) $1,500 $1,400 $1,300 $1,200 $1,100 $1,000 $ MW single-axis solar PV 10 MW/40 MWh lithium battery DC coupled ITC eligible Fixed O&M = ±$9/kW year Var O&M = ±$2/MWh on battery output $ Source: NREL 2018 ATB, Mid Technology Cost Scenario
29 Rooftop Solar PV Capital Costs $/kw_ac (2016 $) $3,800 $3,300 $2,800 $2,300 $1,800 $1,300 Residential Commercial Fixed O&M (res) = ±$10/kW year Fixed O&M (comm) = ±$9/kW year Zero variable costs Useful life = 25 years Annual CF = 21% $ Source: NREL 2018 ATB, Mid Technology Cost Scenario
30 Wind Less project-to-project correlation than solar Zero variable costs Capital costs trending downward Renewable Wyoming High production (CF ~ 45 50%) Distance from load (i.e., transmission expense) Potential use of Idaho Wyoming transmission path with retirement of Jim Bridger unit(s) Idaho Lower production (CF ~ 25 30%) Closer to load Zero or negative correlation with load Uncertain Variable
31 Wind Capital Costs $1,700 $1,600 $1,500 Idaho $/kw_ac (2016 $) $1,400 $1,300 $1,200 $1,100 $1,000 $900 $800 Wyoming Fixed O&M = ±$47/kW year Zero variable costs Source: NREL 2018 ATB, Mid Technology Cost Scenario, Wyoming Techno-Resource Group (TRG) #1, Idaho TRG #7
32 Geothermal $6,200 $6,000 $5,800 $/kw_ac (2016 $) $5,600 $5,400 $5,200 $5,000 $4,800 Fixed O&M = $169/kW year Annual CF = 85 90% Zero variable costs Source: NREL 2018 ATB, Mid Technology Cost Scenario, Hydrothermal binary resource
33 Natural Gas Generation Technology Overnight Capital Cost ($/kw) Sources: Vendor and NREL 2018 ATB, Mid Technology Cost Scenario Fixed O&M ($/kw-year) Variable O&M ($/MWh) Heat Rate (Btu/kWh) CCCT (300 MW) $1,027 $10.40 $2.70 6,420 SCCT (170 MW) $873 $12.00 $7.00 9,720 Reciprocating engines (3 x 18.5 MW) Reciprocating engines (6 x 18.5 MW) $930 $12.00 $5.10 8,300 $830 $12.00 $5.10 8,300
34 PS Hydro, SMR, and Small Hydro Technology Pumped-storage hydro (500 MW/4000 MWh) Sources: Vendor and NREL 2018 ATB Overnight Capital Cost ($/kw) Fixed O&M ($/kw year) Variable O&M ($/MWh) $1,800 $4.00 $0 Nuclear SMR (60 MW) $4,200 $8.00 $2.00 Small hydro $3,700 7,300 ±$70 $0
35 2019 IRP Updated Portfolio Process
36 Portfolio Design Process 2017 vs IRP 2017 IRP Manually: Design portfolios Identify specific deficits Evaluate portfolio sufficiency Calculate fixed costs Combine fixed and variable costs Excel-based monthly evaluation under adverse weather Model variable costs in Aurora 2019 IRP Aurora-generated portfolios Fixed and variable costs Long-term WECC optimization (LT) Initial NG and CO 2 case portfolios Additional coal unit retirement portfolios
37 Peak-Hour Capacity Planning Criteria 2017 IRP 95 th -percentile monthly peak hour 90 th -percentile hydro inflow condition 2019 IRP 15% capacity margin peak hour 50 th -percentile hydro inflow condition
38 Energy Planning Criteria 2017 IRP 70 th -percentile monthly average 70 th -percentile hydro inflow condition 2019 IRP 50 th -percentile hourly energy 50 th -percentile hydro inflow conditions
39 Flexibility Planning Criteria 2017 IRP Qualitative assessment of need and new resource contribution 2019 IRP Hourly up and down regulating reserve calculated Per 2018 Variable Energy Resource Study Hourly generation forecast basis Resources carry specific regulation requirements Load net wind and solar
40 Capacity Expansion Modeling Aurora adds resources to: 1. Meet capacity planning margin (15%) 2. Flexible capacity requirements 3. Energy requirements Aurora selects among resource options to add or remove based on: 1. Cost 2. Peak-hour capacity 3. Flexible capacity 4. Energy
41 2018 Variable Energy Resource Study NERC BAL Standard Rolling 30-minute balance requirement 2017 system data analyzed Load and generation one-minute time step Forecast two-hour ahead Reserve definitions seasonally calculated load net wind and solar