AQUIFER STUDIES RELATED TO GEOLOGIC STORAGE OF CO 2
|
|
|
- Gerald Morgan Wilkerson
- 5 years ago
- Views:
Transcription


1 AQUIFER STUDIES RELATED TO GEOLOGIC STORAGE OF CO 2 Presenter: Rebecca C. Becky Smyth Gulf Coast Carbon Center,, Jackson School of Geosciences, The University of Texas at Austin

 Kinder Morgan Co.")
2 ACKNOWLEDGEMENTS Fellow Gulf Coast Carbon Center researchers: Susan Hovorka, Jiemin Lu, JP Nicot, Katherine Romanak, and Changbing Yang; BEG Associate Director: Ian Duncan; BEG Director: Scott Tinker Other BEG researchers: Florence Bonaffee and John Gates Funding organizations: (1) The Department of Energy National Energy Technology Laboratory s Southwest Regional Carbon Sequestration Partnership via New Mexico Tech and Brian McPherson, principle investigator (2) Kinder Morgan Co. (3) GCCC sponsors:
3 CCS FACTS Carbon capture and storage (CCS) is a process that will be used to reduce atmospheric emissions from coal-fired power plants across the globe Geologic sequestration (GS) is a method of isolating CO 2 in the deep subsurface via injection of compressed fluid and subsequent trapping A properly selected GS site should not impact underground sources of drinking water (USDWs), <10,000 mg/l TDS Monitoring i is necessary!
4 CONSIDERATIONS Types of monitoring Really want to look for early warnings! Deep subsurface look for pressure changes just above low permeability seal overlying injection zone Intermediate depth subsurface base of USDWs and below Shallow subsurface saturated and unsaturated zones Surface/Atmospheric a way to confirm sequestration credits Displacement/migration e at of high salinity fluids (brine) with dissolved CO 2 by conduit flow along high permeability pathways: insufficiently plugged well bores transmissive faults upward along gently dipping, regional water-bearing strata (i.e. Carrizo- Wilcox aquifer) Different aquifers contain different matrix minerals that will react with CO 2 at different rates - dissolution and precipitation Shallow groundwater contains natural sources of CO 2 NOT A HAZARDOUS WASTE!
5 WATER QUALITY ISSUES CO 2 injected into a water-bearing formation (freshwater or brine) will partially dissolve and: Reduce ph of solution CO 2(g) + H 2 O H 2 CO 3(aq) H +H 2 CO 3(aq) HCO 3(aq) + HCO 3(aq) CO 2 3(aq) + H + (aq) Chemically interact with formation matrix to: increase dissolved cation concentrations (Group 1 - B, Ba, Ca, Co, K, Mg, Mn, Sr, and Zn) increase dissolved cations followed by concentration decline (Group 2 Al, As, Cs, Cu, Fe, Mo, Ni, Rb, U, and V).


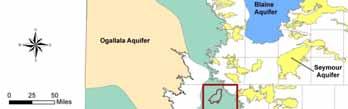
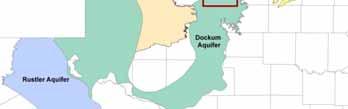
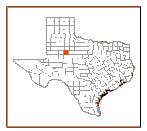
6 CASE STUDY SACROC Oilfield Scurry Area Canyon Reef Operators Committee (SACROC) enhanced oil recovery using CO2 since ,000 ft deep Injection/production zone Scurry County Texas Water Development Board (TWDB) minor aquifer Dockum aquifer base at ~ 500 ft


7 CASE STUDY Dockum Aquifer Scurry Co. Not all of these wells are completed in the Dockum aquifer! Six groundwater monitoring trips June 2006, July 2007, November 2007, March 2008, July 2008, November 2008, and hopefully July 2009 BEG sampled 60 private water wells, 1 freshwater spring, and brine from 8 CO2 injection zone wells total 123 samples TWDB database water quality data for analyses with charge balance error <10%, potassium analysis, and good reliability code


8 CASE STUDY - Challenges Piper Diagram BEG and TWDB samples showing large variation in Scurry Co. Dockum water chemistry Need indirect measurement of CO 2 in groundwater CO 2 = ph, Alkalinity, dissolved metals


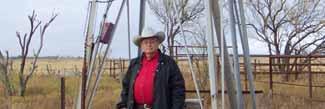


9 Need Landowner Permission for Access to Private Water Wells


10 BEG and TWDB Water Well Data Geologic units Q Quaternary undifferentiated P-Eog Paleocene- Eocene Ogallala TrD Triassic Dockum P Permian undifferentiated Surface geology from BEG Big Spring and Lubbock GAT sheets


11 Stratigraphic Cross-sections from Shallow Geophysical Logs NW SE 2500 ft Sea Level ft ft Shallow Dockum or Ogallala Sands ~ ft from a few gamma logs
12 NW-SE Cross Section Based on TCEQ Surface Casing Geophysical Logs NW SE 3000 ft Isolated Dockum Group sand bodies 2000 ft Dockum Santa Rosa 1000 ft Permian-age units Sea Level Cross section generated in GeoGraphix and Adobe Illustrator software using scanned logs from TCEQ Surface Casing Division log library.
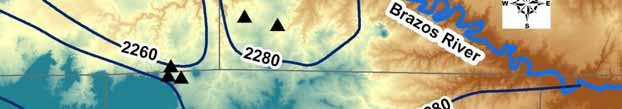
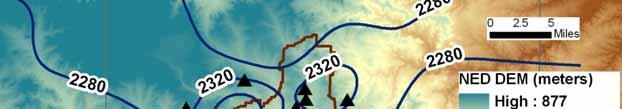
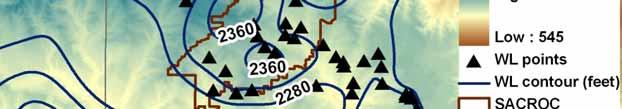
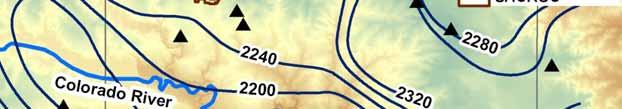

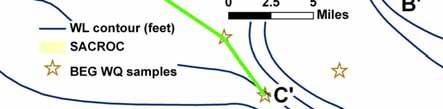
13 Potentiometric Surface Map for Scurry and nearby counties only wells with total t depth (TD) in Dockum Santa Rosa


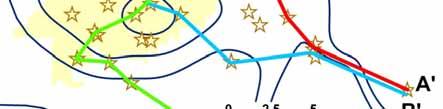
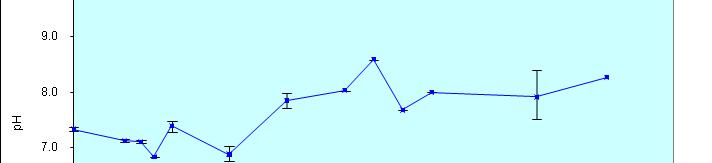
14 ph Along Gradient- parallel Transects All BEG-sampled wells completed through Ogallala with TD in Dockum Santa Rosa A A B B C C
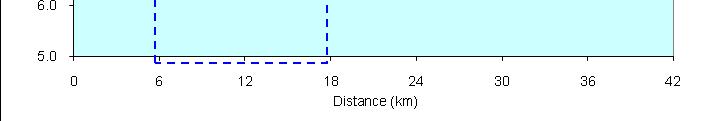
15 Line A-A Example Well Transect for Reactive Flow Path Modeling 1E 1.E+04 1.E+03 SACROC Ca Mg Sr Vertical bars- multiple BEG samples in one well Concen ntration (mg/l ) 1.E+02 1E+01 1.E+01 1.E+00 1.E Distance (km)
16 Line A-A Example Well Transect for Reactive Flow Path Modeling 1.E+04 SACROC tds Na K Cl 1.E+03 tration (mg/l) Concen 1.E+02 1.E+01 1.E+00 1.E-01 Vertical bars- multiple BEG samples in one well Distance (km)
17 Outside SACROC Inside SACROC HCO 3 - Temporal Trends of all TWDB & BEG Data concnetrat tion (mg/l) year
18 Temporal Trends of all TWDB&BEG BEG Data
19 SACROC AREA WATER QUALITY 60 wells and 1 spring; filtered cations; unfiltered anions; highest concentration measured in each well


20 CONCLUSIONS No distinction between Dockum water quality inside and outside of SACROC Dockum is a heterogeneous groundwater system Not clear if we can or will be able to - see evidence of injectate CO 2 in Dockum groundwater Good news for GS of CO 2 at least at SACROC Good job Kinder Morgan!
21 QUESTIONS? TCEQ Environmental Trade Fair and Conference Austin, TX - May 12, 2009
22 BEG Water Well Monitoring Six sampling trips Fisher Co. in June 2006; Scurry, Garza, and Kent counties in July 2007, November 2007, March 2008, July 2008, and November 2008 Total wells 60 wells and 1 spring (+8 SACROC production and brine injection wells) Total samples sets collected 123 Laboratory analytes (LANL): Al, Ag, As, B, Ba, Be, Br, Ca, Cd, Cl, Co, CO 3, Cr, Cs, Cu, d 13 C, dd, d 18 O, F, Fe, HCO 3, Hg, K, Li, Mg, Mn, Mo, Na, Ni, NO 3, Pb, PO 4, Rb, Sb, Se, Si, Sn, SO 4, Sr, TDS, Th, Ti, Tl, U, V, and Zn Laboratory analytes (UT DGS - Romanak): DIC, DOC, headspace gases (CO 2, CH 4 ) Field parameters: dissolved oxygen, ph, specific conductivity, and temperature; alkalinity titrations Well information: total depth, water level (where possible), x and y coordinates from GPS, elevation (z) from digital elevation model, stratigraphic unit from BEG-constructed structure contour maps (based on shallow geophysical logs)