Uncertainties on future demand and supply The gas market s role in providing flexibility
|
|
|
- MargaretMargaret Rice
- 5 years ago
- Views:
Transcription
1 Uncertainties on future demand and supply The gas market s role in providing flexibility Carmen Vindel Sánchez Director of International Regulation November 2014
2 Índice 1. Supply & Demand of Natural Gas 2. Gas to Power Demand 3. Power supply requires flexibility 4. How to provide flexibility in the electricity sector 5. Conclusions 2
3 Supply & Demand of Natural Gas (I) Gas Supply in Europe* (2011, bcm) Total Net Offer % 29% 33% 100% 14% 72% 57% 85% 78% 66% 69% LNG imports Pipeline imports Gas Production Holanda NL Reino Unido UK 28% 31% 15% 11% 1% Polonia Alemania Italia Francia España PL DE IT FR ES LNG brings more integrated & secure gas markets World Energy Outlook 2014, IEA For years, Spain is the country that benefits the most from the diversification brought by LNG * Storage not considered Source: Eurogas 3
4 Supply & Demand of Natural Gas (II) ,8%/year Gas Natural Supply Evolution in Spain (bcm/y per source of supply) ,6%/year % ,3 35, , ,0 33,8 32, Others 1% Trinidad & Tob. 6% Perú 4% Gulf Bassin 12% (Qatar, Oman, ) Nigeria 10% Norway LNG 4% Algeria LNG 10% France 12% Norway pipeline - Algeria - pipeline 41% LNG pipeline LNG facilitates the diversification of sources and routes Source: Sedigas 4

5 Supply & Demand of Natural Gas (III) Main sources of regional LNG supply Share of LNG would rise in global gas trade, pushed by increased liquefaction capacity in 2040 Source: World Energy Outlook, IEA
6 Supply & Demand of Natural Gas (IV) Spot LNG market. Currently attractive 48% Drop in the monthly LNG price in South West Europe From 14,9 $/MMBtu (dec 2013) to 7,7 $/MMBtu (dec 2014) JKM Japan Korea Market 20 SWE South-West Europe $ / M M B t u SWE as a netback: JKM transport to Asian markets NBP UK (monthly product) 8 Hubs > LNG price 6 1- sep oct nov dic ene feb mar abr may jun jul ago sep oct nov- 14 GNL price is less dependent on local gas producers Source: GNF self-elaborated 6
 Source: Sedigas 7")
7 Supply & Demand of Natural Gas (V) A broad range of gas qualities increases the nº of sources A wide and flexible range of gas specifications makes LNG sources accessible to European stakeholders. A small range of gas quality allowed would increase demand and price of the remaining sources (e.g. Russia, Norway) Source: Sedigas 7
8 Supply & Demand of Natural Gas (VI) Evolution of demand Gas Demand Variation in Europe Δ ,3% -11,7% -11,2% -17,3% -7,2% 9.4% 3.2% 0.7% -2.7% 5.9% 6.3% 4.3% 4.7% 0.4% 0.6% 0.2% -0.7% -0.2% -3.6% -3.8% -6.2% -7.9% -7.7% -13.2% 8.7% 10.3% 5.0% 4.3% -0.2% -2.7% -5.3% -7.0% -8.2% -10.7% % -17.3% Not only Spain is seeing an important reduction of gas demand In 2014, gas demand is expected to register a decrease of 9% compared with 2013 Source: Enagás, PIRA & Eurogas 8

9 Supply & Demand of Natural Gas (VII) Spanish natural gas sales by sector (in GWh) 64% 17% 17% 2% [5 years] Electricity generation has led the variation in natural gas demand in the last decade Source: CNMC
10 Supply & Demand of Natural Gas (VIII) Residential sector 85% UK 66% 53% * In terms of nº customers/total nº of dwellings % of households with gas in Europe % 35% 27% IT BE DE FR ES ü The Spanish gas market is a market in development, still growing: It was initiated 30 years ago Other major European markets were initiated earlier (40/60 years) ü Weather conditions also limit Spanish gas demand for heating purposes compared to other regions ü Spanish household customer has a gas specific consumption between two and three fold less than other European customers ü As for 55%-65% of gas bills in Spain cover fix costs (e.g. transmission and distribution), if Spanish customers had a similar level of consumption as in other parts of Europe, they would pay between 34%-48% less on network costs although residential gas market has still room for growth displacing other conventional and more polluting fuels (butane, fuel oil) 10
11 Supply & Demand of Natural Gas (IX) Evolution of demand Gas Demand Evolution in Spain (bcm) Residential and industrial +136% Gas-to-Power demand +194% Gas to power demand -26% bcm Spanish gas demand has risen more than six-fold since However, since 2009 there has been a reduction of the consumption Source: BP Statistical review, Enagas and Sedigas 11
 (GWh.) B.C. Total Eólico Solar MW 2010 97.447 275.773 33.614 19.813 4.018 63.833 2011 100.576 270.662 35.753 20.733 4.852 64.823 2012 101.828 266.849 39.106 22.573 6.298 62.")
 5,0% - 5,4% 17,9% 14,8% 67,7% - 1,9% - % of use per year Rate of use (%) Nuclear Hydro Coal Gas Wind Solar 2010 92% 26% 29% 29% 25% 20% 2011 85% 18% 42% 23% 23% 23% 2012 89% 12%")
12 Gas to Power Demand (I) Main parameters of power generation business in Spain - Evolution of installed capacity Installed capacity Total Demand Special Regime Mainland(MW) Conventional Regime Mainland (MW) (GWh.) B.C. Total Eólico Solar MW * /2013 (%) 5,0% - 5,4% 17,9% 14,8% 67,7% - 1,9% - % of use per year Rate of use (%) Nuclear Hydro Coal Gas Wind Solar % 26% 29% 29% 25% 20% % 18% 42% 23% 23% 23% % 12% 55% 18% 25% 22% % 22% 39% 11% 27% 21% In May % 34% 21% 7% Source: REE Reduction of gap supplied with thermal technologies, especially with CCGTs 12
13 Gas to Power Demand (II) Usage of Combined Cycles of Gas Turbines 5,000 4,000 46% 49% 50% Usage of CCGTs in Spain* (number of hours) 41% 3,000 39% 31% 23% 2,000 17% 1,000 11% 9% Aug-14 *Including national islands The use of CCGTs has plummeted, therefore impacting on overall gas demand Source: REE 13


14 Gas to Power Demand (III) CCGT load profile from 2008 to 2014 CCGT Load Profile in March 2008 CCGT Load Profile in March 2010 (same facility) CCGT Load Profile in March 2012 (same facility) CCGT Load Profile in March 2013 (same facility) CCGT Load Profile in March 2014 (same facility) 14

15 Gas to Power Demand (IV) Intermitency drives the demand of flexibility Interconnection Coal Hydro CCGTs Wind Nuclear Solar Fuel Other RES Source: REE CCGTs are required to compensate the lack of management of intermittent technologies

16 Gas to Power Demand (V) Providing flexibility also increase the costs of supply The classic system 400 MW Combined cycle gas turbine - 1 daily start. 19 h of operation Integrating RES 400 MW Combined cycle gas turbine - 2 daily start- 5h and 6h hours of operation The new requirements of flexibility increase the operating costs of CCGTs Source: Wartsila 16
17 Gas to Power Demand (VI) Evolution of margin of coverage of demand Index of coverage of demand (historic and forecasts) Index of coverage of demand (historical) Scenario CNE-Promoting Medium Demand Scenario Low Capacity Medium Demand Min. coverage desirable Scenario CNE-Promoters High demand Scenario Low Capacity High demand CCGTs could quickly become essential to secure again the daily demand Source: CNE
")


18 Gas to Power Demand (VII) Diverse technologies can provide flexibility 18
19 Gas to Power Demand (VIII) Diverse technologies can provide flexibility Cost of flexibility by sources IEA Thermal generation is the most affordable way to provide flexibility The more flexible the dispatchable generation, the more affordable is the flexibility LCOF: Levelised Cost of Flexibility, in $/MWh ICE, Intelligent Control of Energy CAES: Compressed Air Energy Storage Source: IEA 2014 report The Power of Transformation 19
")
20 Future role of gas (I) 20
21 Future role of gas (II) Climate and energy objectives 2030 Carbon emissions Renewable Energy Efficiency % of reduction (ref levels) 20% of final consumption Binding at national level 20% reduction of projected consumption Indicative + obligations 2030 (Escenario of reference ) 32% 24% 21% 2030 At least 40% Binding At least 27% of final energy consumption EU binding At least 27% reduction of 2030 projected consumption Indicative 21
22 Conclusions Crucial importance of the gas diversification. LNG will increase its role. A wide and flexible range of gas specifications makes many LNG sources accessible to European stakeholders. Ø A small range of gas quality allowed would increase demand and price of the remaining sources Residential gas market has still room for growth in Spain compared with other EU countries. Electricity generation has led the variation in gas demand in the last decade. The use of CCGTs has sharply decrease, impacting on overall gas demand. However, CCGTs are essential to secure the daily demand. The changes in the conventional operating environment increase the need for more flexibility CCGTs are more and more required to compensate the lack of management of intermittent technologies Although other means (e.g. interconnection, storage, DSR) will play an important role, the provision of flexibility in the power system will mostly rely on thermal generation capacity 22
23 Practical case Grid implications of electrification of heating 23
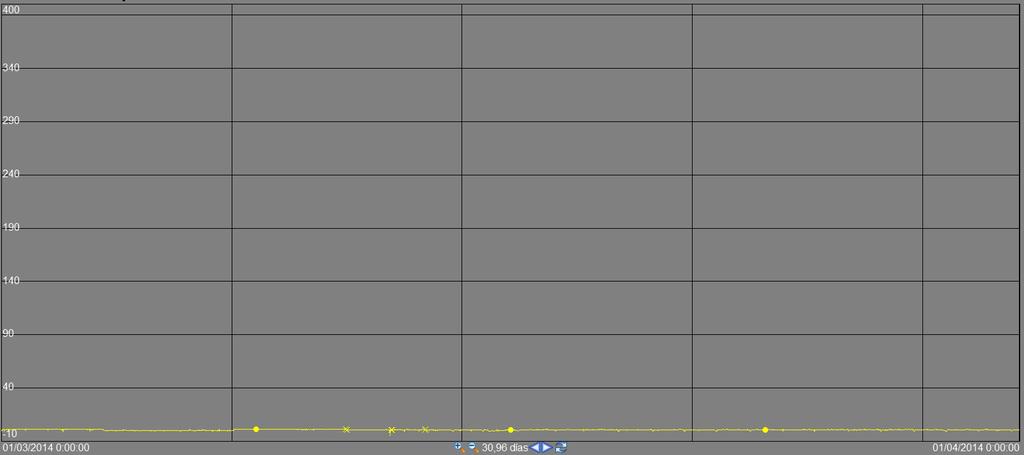
24 8 hourly consump9on gas or electricity in kwh/h Residen9al consumer electricity no hea9ng /no warmwater kwh/a Start: A typical electricity customer (no heating/ warm water) - 1/1/2006 1/15/2006 1/29/2006 2/12/2006 2/26/2006 3/12/2006 3/26/2006 4/9/2006 4/23/2006 5/7/2006 5/21/2006 6/4/2006 6/18/2006 7/2/2006 7/16/2006 7/30/2006 8/13/2006 8/27/2006 9/10/2006 9/24/ /8/ /22/ /5/ /19/ /3/ /17/ /31/2006 Source: CEDEC & Eurogas
25 hourly consump9on gas or electricity in kwh/h Residen9al gasconsumer hea9ng/warmwater kwh/a Residen9al consumer electricity no hea9ng /no warmwater kwh/a Add: A typical gas customer (heating & warm water) - 1/1/2006 1/15/2006 1/29/2006 2/12/2006 2/26/2006 3/12/2006 3/26/2006 4/9/2006 4/23/2006 5/7/2006 5/21/2006 6/4/2006 6/18/2006 7/2/2006 7/16/2006 7/30/2006 8/13/2006 8/27/2006 9/10/2006 9/24/ /8/ /22/ /5/ /19/ /3/ /17/ /31/2006 Source: CEDEC & Eurogas
26 hourly consump9on gas or electricity in kwh/h Residen9al gasconsumer hea9ng/warmwater kwh/a Residen9al consumer electricity no hea9ng /no warmwater kwh/a Residen9al consumer with direct electricity hea9ng/warmwater + normal usage kwh/a Add: A typical electricity customer (with heating & warm water) - 1/1/2006 1/15/2006 1/29/2006 2/12/2006 2/26/2006 3/12/2006 3/26/2006 4/9/2006 4/23/2006 5/7/2006 5/21/2006 6/4/2006 6/18/2006 7/2/2006 7/16/2006 7/30/2006 8/13/2006 8/27/2006 9/10/2006 9/24/ /8/ /22/ /5/ /19/ /3/ /17/ /31/2006 Source: CEDEC & Eurogas
27 hourly consump9on gas or electricity in kwh/h Residen9al gasconsumer hea9ng/warmwater kwh/a Residen9al consumer electricity no hea9ng /no warmwater kwh/a Residen9al consumer with ground water electricity heat pump + normal usage 9000 kwh/a Residen9al consumer with direct electricity hea9ng/warmwater + normal usage kwh/a Add: For comparison best in class electricity customer (with heating & warm water) - 1/1/2006 1/15/2006 1/29/2006 2/12/2006 2/26/2006 3/12/2006 3/26/2006 4/9/2006 4/23/2006 5/7/2006 5/21/2006 6/4/2006 6/18/2006 7/2/2006 7/16/2006 7/30/2006 8/13/2006 8/27/2006 9/10/2006 9/24/ /8/ /22/ /5/ /19/ /3/ /17/ /31/2006 Source: CEDEC & Eurogas
28 8 Residen9al consumer electricity no hea9ng /no warmwater kwh/a /1/2006 1/15/2006 1/29/2006 2/12/2006 2/26/2006 3/12/2006 3/26/2006 4/9/2006 4/23/2006 5/7/2006 5/21/2006 6/4/2006 6/18/2006 7/2/2006 7/16/2006 7/30/2006 8/13/2006 8/27/2006 9/10/2006 9/24/ /8/ /22/ /5/ /19/ /3/ /17/ /31/2006 hourly consump9on gas or electricity in kwh/h Residen9al consumer with ground water electricity heat pump + normal usage 9000 kwh/a Residen9al consumer with direct electricity hea9ng/warmwater + normal usage kwh/a To include heating in electric means: Best Case ~5 x times peak load Worst Case ~9 x times peak load Source: CEDEC & Eurogas