LAKE VICTORIA BASIN: OVERVIEW, CHALLENGES AND OPPORTUNITIES
|
|
|
- Jessie Hutchinson
- 5 years ago
- Views:
Transcription

1 LAKE VICTORIA BASIN: OVERVIEW, CHALLENGES AND OPPORTUNITIES PRESENTATION TO THE FINAL REVIEW MEETING FOR THE INTERNATIONAL LAKE ENVIRONMENT COMMITTEE 06 NOVEMBER 2010 Matano, ALLY SAIDI (PRINCIPAL PROGRAMMES DEV OFFICER)
2 PRESENTATION OUTLINE Overview of the EAC-LVBC LVB: Regional and international perspective Challenges Opportunities/potentials Projects and programmes A reflection against ILBM Conclusion
3 OVERVIEW OF THE LAKE VICTORIA BASIN COMMISSION Population 38m people (33% of EAC Partner States/Huge economic potential/strategic position) = REGZ ( EADS) Treaty for establishing EAC (1999) recognized need to have legal framework to coordinate management of the Basin In 2001 CLVB (PS) = LVDP Unit In 2003 signing of the Protocol/ratification 2004 Mandate/areas of cooperation/establishment of the LVBC
4 VISION, MISSION, OBJECTIVES STRATEGIC FRAMEWORK SV: a prosperous pop living in a healthy & sustainably managed environment providing equitable benefits & opportunities (Framework based on: ENR,P&IG, LCQL, P&D, GPI) Mission: Promote, facilitate and coordinate activities of different ACTORs towards sustainable development & poverty alleviation Objectives: promote: measures aimed at poverty alleviation; equitable EG; sustainable utilization and management NR; protection of the environment within Basin; and compliance on safety of navigation.


5 GOVERNANCE STRUCTURE EAC Summit Civil Society/ Private Sector Sectoral Council of Ministers EAC Council of Ministers National Focal Point Office LVBC Secretariat Coordination Committee Donor Consultative Group Sectoral Committees


6 Perspectives of LVB


7 THE LAKE AND ITS BASIN DRAINAGE SYSTEMS

,")


8 MORPHOMETRIC DATA FOR LVB Million at beach level), Foreign exchange ~ US $ 250 million Major water transport linkage for the landlocked Uganda, Kagera
9 DESCRIPTION OF THE LAKE AND THE BASIN Country Lake Surface Area Catchment Area Lake Shoreline Sq Km % Sq Km % Km % Tanzania 33, , Uganda 31, , Kenya 4, , Rwanda - 20, Burundi - 13, Total 68, ,950 3,450
10 THREATS ENVIRONMENTAL STRESS Four main types impacting the LVB: Stresses within the lake over-fishing, untreated liquid wastes, water hyacinth, over-abstraction Stresses on littoral zones construction and farming in shoreline, conversion of wetlands, poor solid wastes management Stresses from the basin land degradation, deforestation, inflow of water hyacinth, pollution from agro-chemicals, sediment loads, poor solid waste management Stresses from outside the basin nutrients (N and P) transported into the basin by air, climate change
11 THREATS ECOSYSTEM DEGRADATION Deteriorating water quality caused by increased sedimentation, and pollution and eutrophication Fluctuating lake levels due to unsustainable LVB water management practices and climate change Overexploitation of natural resources caused by increased basin population and competition over natural resources Resurgence of water hyacinth Climate change
12 THREATS MANAGEMENT APPROACH Many stakeholders with diverse interests Several programmes and projects are being implemented independently Minimum interaction between and among the various stakeholders Efforts duplication (lack of synergies) Weak legal and Institutions frameworks to regulate the resource utilization Transboundary (different policies) Without an ILBM approach the lake is likely to suffer irreversible environmental damage. Should this occur, a valuable regional and global asset will become a costly liability


13


14 UPSTREAM DEFORESTATION


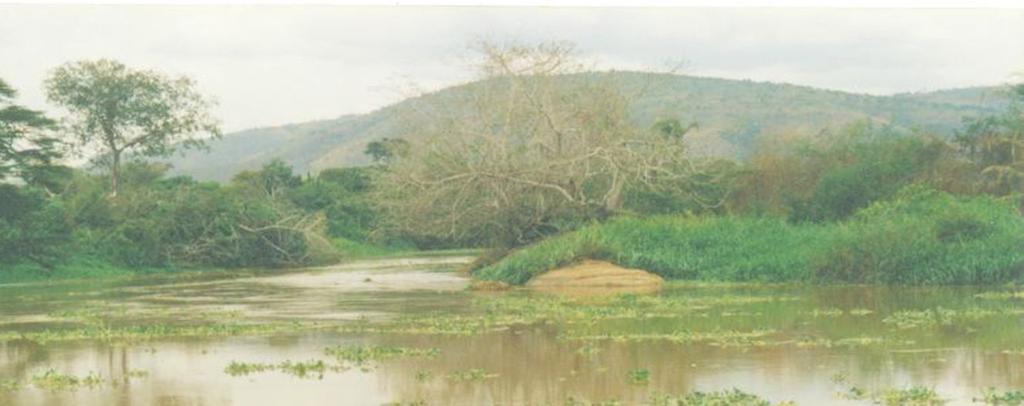
15 INCREASING ENCROACHMENT OF LITTORAL WETLANDS FOR AGRICULTURE


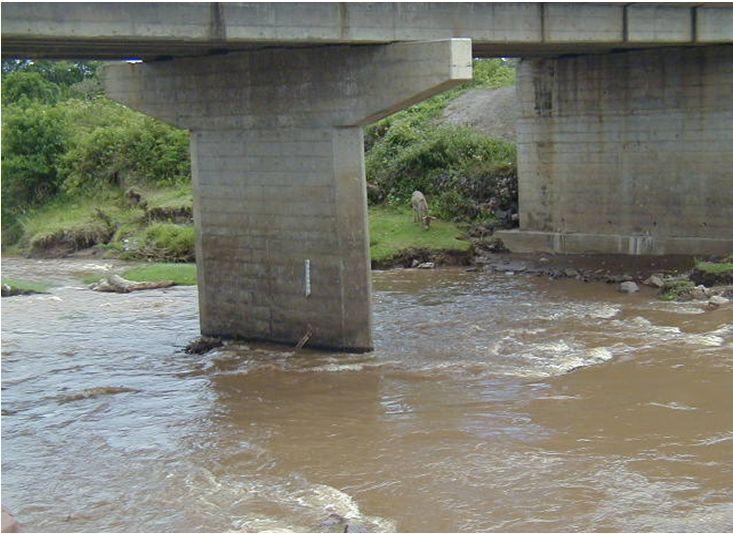
16 INCREASING WATERSHED DEGRADATION DUE TO POOR LAND USE PRACTICES


17 INCREASING INFLOW OF WATER HYACINTH
 Natural hydrology transpiring greater quantities of water (3 times more than native vegetation) Year. Power outagesdays in hours 1990 54.25 2 1991 67.")
18 IMPACTS OF WATER HYACINTH Health issues Biodiversity issues National Economy Power outages eg Uganda Owen falls dam Water supply (KIWASCO water supply reduced by 25% ( cm 3 /day) Kisumu Pier Cargo ( mt) Natural hydrology transpiring greater quantities of water (3 times more than native vegetation) Year. Power outagesdays in hours


19 WATER HYACINTH SUCCESSION Pure mat of hyacinth Mat invaded by I. aquatica and E,fluctuans Mat invaded by hippo grass Late stages


20 WATER HYACINTH SUCCESSION Climax stage Collapse Debris at the lake bottom
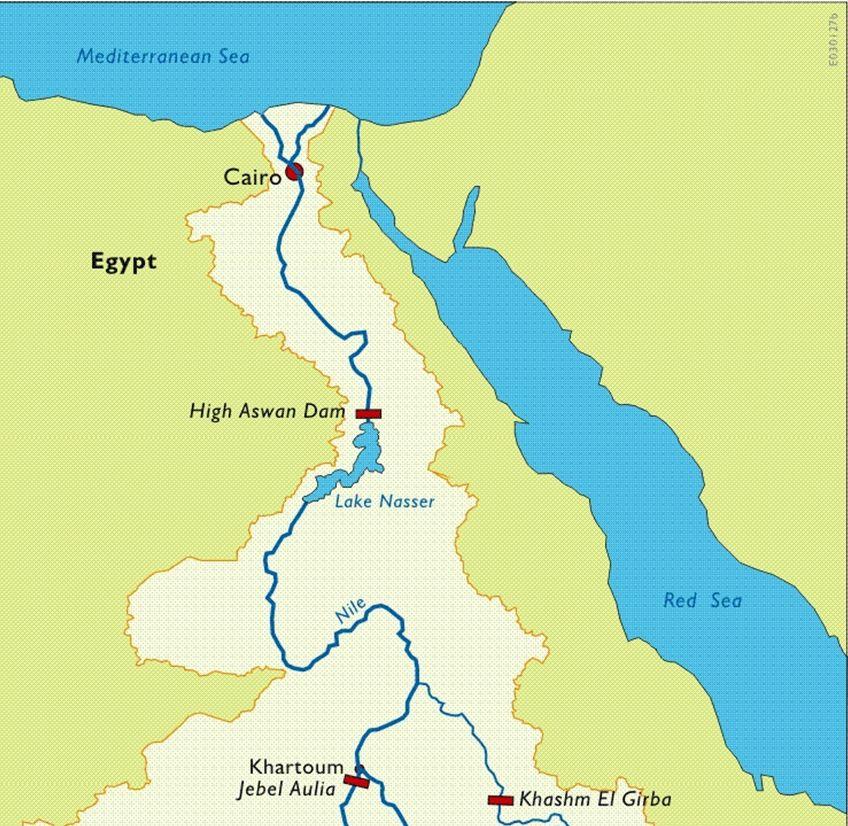
21 THREATS WATER LEVEL FLUCTUATIONS The lake water budget is regulated by rainfall, catchment river inflows, evaporation and River Nile outflows. Changes in these components will either raise or lower the lake level. In the recent past, the lake level has fallen as a result of a combination of two factors, namely; reduced input in terms of rain and inflows; and Increased outflows caused by excess releases and 2004 the lake dropped by over 2 meters.


22 LAKE VICTORIA WATER BUDGET Evolution in the water balance of Lake Victoria
23 WATER RELEASES ON THE BASIS OF THE AC POLICY


24 EFFECTS OF LAKE LEVEL FLUCTUATIONS Terminal at Mwanza South port left hanging
25 EUTROPHICATION Eutrophication occurs when natural waters bodies become excessively fertilized by nutrients LVB has undergone rapid increases in population and agricultural production in the past century and especially post Second World War. Today more 38 million people in five countries share the basin. This regional growth has consequences for Lake Victoria. Long resident time = 23 years Adapted from Verschuren et al. 2002
 Visibility decreased")

 Secchi disc visibility")
26 ABIOTIC INDICATORS OF EUTROPHICATION (SECCHI DEPTH) Visibility decreased by about 75%. (Max readings at 70 m depth in Feb 2006 was ~5 m) 0 Secchi depth (m) TSS (mg/l) Secchi disc visibility (m)


27


28 THREATS POPULATION DENSITY GROWTH 3.8% per annum % for Sub Saharan Africa and 0.5% in many developed countries Lake Victoria Africa Average Africa s Lakes Atlas of Our Changing Environment


29 DEMOGRAPHIC AND BIOPHYSICAL LVBC CHARACTERISTICS OF THE DRAINAGE BASINS Nyando basin the source of sediments and nutrients into the lake. Highest average slope and transport capacity index

30 POLLUTION SOURCES (MUNICIPAL AND INDUSTRIAL) Mwanza and Kampala Supply 57% of the total BOD, 9% of TN and 22% of the TP into the lake (atmospheric deposition excluded) Mwanza Gulf, Murchison Bay, Napoleon Gulf, Winam Gulf and around Kisumu Major hot spots of pollution loading into the lake. Main industries Slaughter houses, Dairy factories, Fish factories, Vegetable oil refineries, Sugar factories, Distilleries, Breweries, Bottlers, Cotton mills, Leather industries, Paper mills, Soap factories Murchison bay (Kampala) Winam Mwanza Catchment Municipal Industrial Catchment Municipal Industrial Catchment Municipal Industrial P (tons/yr) N (tons/yr) BOD (tons/yr) (Redrawn from COWI 2002))

31 MAGNITUDES OF NUTRIENTS LOADS Nitrogen Atmospheri c 17.3% Riverine 4.0% Point 0.4% Phosphorous Riverine 18.2% Point 3.3% Biologic al fixation 0.0% Biological fixation 78.2% Atmosph eric 78.5% Meteorology is dominated by ITCZ two dry and two wet seasons accompanied by wind shifts that affect the lake. During wet season there is a convergence of two humid air masses over the western part of the lake. Waves and turbulence are always higher on the western side of the lake because of the dominance easterly winds and long fetch across the lake.


32 OPPORTUNITIES


33 SOCIO-ECONOMIC BENEFITS


34 SOCIO-ECONOMIC BENEFITS


35 SOCIO-ECONOMIC BENEFITS
36 FISHERY: ANNUAL CATCHES- DEC 06 Total 1,042,866 Others 7,300 Nkejje 137,961 Mukene 574,318 Tilapia 69,495 N. Perch 253, , , , ,000 1,000,000 1,200,000 Annual Catch (MT)
37 FISHERY ANNUAL BEACH VALUE DEC 06 Total 370,500 Tanzania 172,600 Kenya 74,600 Uganda 123, , , , , , , , ,000 Annual Fish Income (Million USD)
38 INTERVENTIONS THROUGH PROJECTS/PROGRAMMES LVEMPII The WB/GEF/Sida MERECP NORAD LVWATSAN AfDB MSCLV AfDB EALP Sida MRB-BHH USAID/EA Partnership Fund Programme on Sustainable Development of LVB (Sweden, Norway, France, Finland, WB, EADB)
39 RESPONSES BY LVB TO THE SIX PILLARS OF ILBM Governance pillars: Responses: Status/Strength Challenges: 1. Institutional Managed by the LVBC established through a protocol/treaty establishing EAC 2. Policy Based on the protocols on sustainable development of LVBC and ENR 3. Public Based on the shared vision and strategy framework for Participation management and development of LVB: Focuses on 5 key policy areas: 1. Environment, Natural Resources and Environment 2. Production and income generation 3. Living conditions and quality of life 4. Population and demography 5. Policies, Institutions and Governance 4. Technology & Through projects and programmes: adaptive research adaptive research component under the LVEMPII 5. Knowledge and information sharing and exchange 6. Sustainable Financing LVB Resource centre (databases). Housed at the LVBC and planned networks and linkages with research institutions and universities. Partner States and Development Partner (a sustainable funding mechanisms proposed LVB Trust Fund & LVB Development Fund Moderate Moderate Moderate Weak Moderate Moderate Upgrading of the Commission into autonomous authority Upgrading of provisions into Act/laws & regulations Varied interests (CSOs representation) Institutionalization of R& D at the Basin Office Inadequate capacity No diversification
40 CONCLUSION LVB though faced with sea of challenges but it has oceans of opportunity Has an operating legal and institutional framework (joint monitoring, implementation, policy formulation and harmonization for transboundary natural resources) Ease of anchorage for ILBM THANK YOU! ASANTE