BESA HIU test procedure. Martin Crane
|
|
|
- Cori Gallagher
- 5 years ago
- Views:
Transcription
1 BESA HIU test procedure Martin Crane
2 Carbon Alternatives After working for a range of consultancies on DH / CHP / renewables / energy efficiency domestic and non-domestic, I spent 8 years at SSE working on real schemes Now independent consultant DH technical issues / problem solving Looking at community ownership options for DH
3 Temperature Typical system return temperatures From block of 150 apartments Flow temperature ( C) Return temperature ( C) Apr 01 Apr 31 Mar 30 Mar 29 Mar 28 Mar 27 Mar 26 Mar 25 Mar 24 Mar 23 Mar
4 The benefits of achieving low return temperature: Low return temperatures = larger dt = lower flow rates (for same kw delivered) = small pumps and pipes Smaller pumps / pumped volume = lower capital costs and lower power consumption Smaller pipes = smaller surface area so lower heat loss Lower return temperature = cooler return pipe = lower heat losses Lower heat losses = less heat input into DH network and reduced unwanted heat gains in buildings Lower return temperatures = potentially improved boiler efficiency, extra CHP heat recovery, improve solar and heat pump performance Larger dt = more thermal storage per unit volume of thermal store = smaller thermal store for same heat storage capacity
5 Factors determining DH return DHW generation Space heating system temperatures DHW / space heating plant operation when no load By-passes on DH network Heat exchangers on the DH network e.g. at building entry


6 Substation performance in practice Data from Guru Systems research project
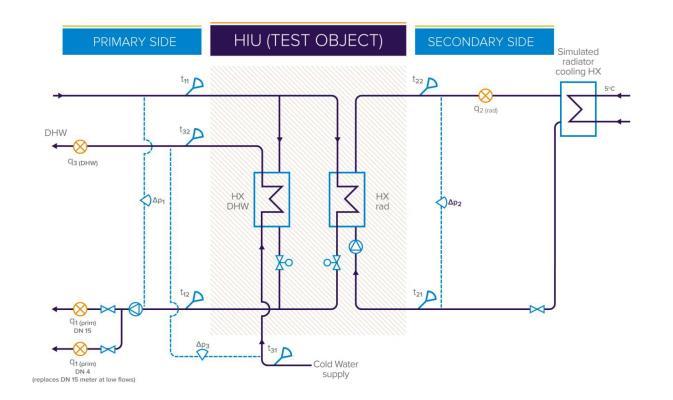
7 The HIU test Developed as part of a BEIS (DECC at the time) funded research project looking into using AMR data to identify issues on DH networks Test developed from Swedish District Heating Association test Evaluate performance of domestic HIUs during: space heating (indirect), DHW generation (instantaneous), standby To explore / demonstrate impacts of different design specification Range of DHW and space heating temperatures Maximum DHW outputs and DHW delivery time after standby period Use of VWART volume weighted average return temperature as the key performance metric.

8
9
10 Substation performance metric The volume weighted average return temperature (VWART) was calculated for each substation function, DHW, space heating and standby Single VWART figure calculated based on typical DHW (1420 kwh /year) and space heating demands (1450 kwh/year) and standby operation at other times Real consumption data has been used make the patterns and magnitudes of demands similar to real, measured, customer demands Both the DHW 6, 10 and 13 l/minute) and space heating loads 1,2 and 4kW) used in VWART calculation are much lower than the peak substation output. Overall VWART is single figure indication of a substation s annual performance

11 VWART results

12 Results annual primary flow
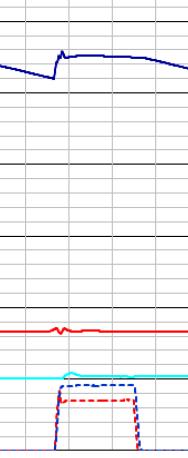
13 Primary return temperatures from space heating simulation - 40 C secondary return

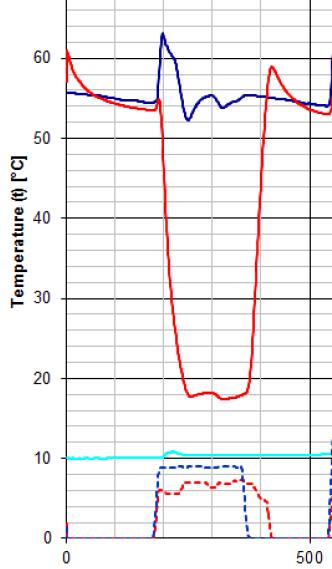
14 DHW supply


15 DHW and space heat

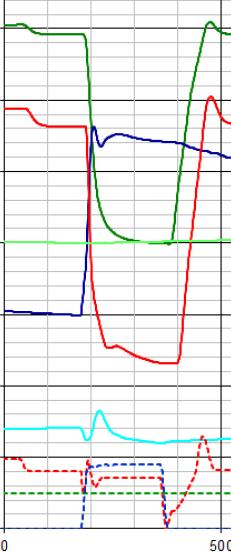
16 Standby operation 2nd International Conference on Smart Energy Systems and 4th Generation District Heating, Aalborg, September 2016
17 Initial impacts and the future Initial impacts VWART results being used in substation marketing 6 substations tested 5 manufacturers now making changes to substations Started a good debate on many issues e.g. requirement for keep warm / standby Observations / comments Future Electronic HIUs better than mechanical? DHW priority a good benefit or not? Include tests for lower temperatures? Variable temperatures? Develop into a standard? Incorporate real radiators into test How to evaluate benefits of more sophisticated electronically controlled substation / benefits of variable speed pumps BESA steering group open to ideas
18 Thoughts on how to use the test Incorporate the HIU VWART requirement into HIU specification. The VWART calculation could be tailored to your site eg retrofit DH where space heating loads much higher Use HIU test data to understand minimum system flow and then design pumps to turndown to this minimum flow Use the VWART at commissioning and handover to confirm correct DH setup eg should be getting VWART back at the energy centre if not why not? Make delivering VWART to Energy Centre a contractural requirement Look at the VWART graphs and understand how an HIU works such understand very useful during commissioning / fault finding etc

19 Vote of confidence in value of test
20 Further information Current test information No result yet though Old test version results of 6 HIUs tested and VWART calculation method at Martin Crane martin@carbonalternatives.com CIBSE paper on lowering return temperatures Paper to DHC Symposium on HIU test Research funding from
21