APPENDIX E Drainage and Stormwater Management Report
|
|
|
- Ashlynn Lane
- 5 years ago
- Views:
Transcription
1 APPENDIX E Drainage and Stormwater Management Report
2
3 Drainage and Stormwater Management Report Courtneypark Drive East Class EA & Preliminary Design Prepared for: City of Mississauga Prepared by: Stantec Consulting 300W-675 Cochrane Drive Markham, ON, L3R 0B8 October 30, 2015
4
5 DRAINAGE AND STORMWATER MANAGEMENT REPORT Table of Contents 1.0 INTRODUCTION EXISTING CONDITIONS GENERAL EXISTING DRAINAGE PATTERNS SWM CRITERIA SWM PLAN QUANTITY CONTROL QUALITY CONTROL EROSION AND SEDIMENT CONTROL Detention Storage Retention Storage DRAINAGE SYSTEM SUMMARY LIST OF TABLES Table 1: Existing Drainage Areas and Discharge Coefficient Table 2: Additional Pavement Areas and Proposed Treatment Table 3: 100-Year Allowable Release Rates and Post-Development Discharges Table 4: Summary of Quantity Control Parameters Table 5: Stormsewer Networks Pre-Development Conditions Table 6: Stormsewer Networks Post-Development Conditions Table 7: Existing and Proposed Storm Sewer Sizes Table 8: Proposed Enhanced Swales LIST OF FIGURES FIGURE 1.1 EXISTING CONDITONS ZONE 1 FIGURE 1.2 EXISTING CONDITONS ZONE 2 FIGURE 1.3 EXISTING CONDITONS ZONE 3 FIGURE 1.4 EXISTING CONDITONS ZONE 4 FIGURE 1.5 EXISTING CONDITONS ZONE 5 FIGURE 2.1 SWM PLAN ZONE 1 FIGURE 2.2 SWM PLAN ZONE 2 FIGURE 2.3 SWM PLAN ZONE 3 FIGURE 2.4 SWM PLAN ZONE 4 FIGURE 2.5 SWM PLAN ZONE 5 FIGURE 3.0 OVERALL DRAINAGE PLAN v:\01650\active\ courtneypark drive east class ea\design\drainage\reports\swm june 2015\ _swm_rpt docx i
6
7 DRAINAGE AND STORMWATER MANAGEMENT REPORT Introduction October 30, Introduction Stantec Consulting Ltd. (Stantec) has been retained by the City of Mississauga (City) to complete a Class Environmental Assessment (Class EA) Schedule C and preliminary design for Courtneypark Drive East, from Kennedy Road to Dixie Road. The project study area covers a road distance of approximately 2.75 km, the intersections at Kennedy Road, Tomken Road, Ordan Drive/Shawson Drive, Ordan Drive and Vipond Drive, as well as the interchange with Highway 410 (study area). The study alternatives include maintaining the present conditions, widening the road, and completing the existing interchange at Highway 410 and Courtneypark Drive East. The Class EA will develop a recommendation and preliminary design for a preferred alternative that seeks to meet network demands, improve traffic flow, identify and address safety issues and access constraints, accommodate active transportation and rehabilitation of the existing road conditions. This Stormwater Management (SWM) Report has been prepared to document the existing drainage, water quantity and quality conditions in the study area, evaluate the relative impacts of the preferred design on the receiving surface water systems, and recommend measures to mitigate the potential impacts. The following materials were reviewed in the preparation of this report: Preliminary Geotechnical and Pavement Investigation Report, by SPL Consulting Ltd., April 2015 [Geotechnical Report]; Stormwater Management Criteria, prepared by Toronto and Region Conservation Authority (TRCA), August 2012 [TRCA SWM Guidelines]; Etobicoke and Mimico Creeks Watersheds, Technical Update Report, Executive Summary 2010, prepared by Toronto and Region Conservation Authority (TRCA), [Etobicoke Watershed Report]; Low Impact Development Stormwater Management Planning and Design Guidelines, prepared by Credit Valley Conservation (CVC) and TRCA, 2010 [CVC and TRCA LID Guidelines]; Highway 410 from South of Highway 401 Northerly to Queen Street, Class Environmental Assessment for Provincial Transportation Facilities, Group B, prepared by Morrison Hershfield, January 2010; and, Stormwater Design Requirements, Development Requirements Manual, Transportation and Works Department, City of Mississauga, 2009 [City of Mississauga Design Manual]. mjb v:\01650\active\ courtneypark drive east class ea\design\drainage\reports\swm june 2015\ _swm_rpt docx 1.1
8 DRAINAGE AND STORMWATER MANAGEMENT REPORT Existing Conditions October 30, Existing Conditions 2.1 GENERAL Courtneypark Drive East is an arterial road running east/west in the northern part of the City of Mississauga. The road is located in Ward 5 and travels through both business employment and industrial lands. The area falls within Tributary 3, Etobicoke Creek subwatershed, which is part of Etobicoke Creek Watershed and falls under the jurisdiction of TRCA. The majority of the lands within the Etobicoke Creek watershed were developed prior to the adoption of current SWM standards; accordingly, stormwater in most of these areas does not receive any treatment before discharging to the receiving watercourse. The study area drains generally from west to east, and drainage is collected via a combination of rural and urban storm drainage systems (roadside ditches, catchbasins, sewers and manholes). The water receives no treatment before discharging to the receiving watercourses, other than grassed swales. 2.2 EXISTING DRAINAGE PATTERNS Runoff from Courtneypark Drive drainage area is collected via existing road side ditches and storm sewer systems. Flow from all existing ditches and storm sewers ultimately discharges into Tributary 3, Etobicoke Creek, which is located about 300 m north of the road. Existing drainage patterns were studied using servicing plans and topographical map, obtained from digital aerial imagery, provided by the City of Mississauga. Nine catchment areas (numbered 101 to 109) were identified in the existing drainage pattern, as illustrated in the attached Figures 1.1 to 1.4. Catchment 101 includes the northern part of Courtneypark Drive East right-of-way (ROW) and adjacent areas, between Kennedy Road and Highway 410. Minor flows from this catchment are collected via catchbasins located along the north of the road. The catchbasins discharge into a roadside ditch (RD1) flowing in an easterly direction. The ditch discharges into the existing culvert CE1, to the north of Courtneypark Drive East at the Highway 410 interchange. Major flows from this catchment are conveyed via the roadway to a low point, located about 230 m west of Highway 410. Flow is then directed toward the north, crosses Highway 410 via the existing culvert CE1, and ultimately discharges into Tributary 3. Catchment 102 includes the southern part of Courtneypark Drive East ROW and adjacent areas, between Kennedy Road and Highway 410. Minor flows from this catchment are collected via catchbasins located along the south sides of the road, the catchbasins discharge into a roadside ditch (RD2) flowing in an easterly direction. The ditch discharges into an existing culvert (CE2) across Highway 410 to the south of the interchange. Major flow from the southern portion of the road is directed from the low point toward the south, through curb cut, into the road side ditch, which discharges into the existing culvert CE1. Catchment 103 extends along the northern part of Courtneypark Drive East ROW and adjacent areas, between Highway 410 and Tomken Road. Minor runoff from this catchment is collected mjb v:\01650\active\ courtneypark drive east class ea\design\drainage\reports\swm june 2015\ _swm_rpt docx 2.2
9 DRAINAGE AND STORMWATER MANAGEMENT REPORT Existing Conditions October 30, 2015 via catchbasins located on the north side of the road, and connected to existing storm sewer system along the property. The storm sewer discharges northerly to a 1200 mm storm sewer located on Gottardo Court, which then discharges into Tributary 3 of Etobicoke Creek, approximately 400 m north of Courtneypark Drive East. The major road flow is conveyed via the roadway toward Tomken Road. The major portion of the sewer system is on the north side of Courtneypark Drive East ROW, which runs from east of the ramp in the northeast quadrant of Courtneypark Drive East & Highway 410 interchange to Tomken Road. A small portion of the sewer system is on the south side of Courtneypark Drive East ROW, which only collects stormwater runoff from the southwest corner area of the Courtneypark Drive East & Tomken Road intersection, connecting to the north side storm sewer system through a 750 mm storm sewer crossing Courtneypark Drive East. Catchment 104 extends along the southern part of Courtneypark Drive East ROW and adjacent areas, between Highway 410 and Tomken Road. Minor runoff from this catchment is collected via catchbasins, which are connected to an existing roadside ditch (RD3) flowing in an easterly direction. The ditch discharges into an existing 450 mm storm sewer system located near the intersection of Courtneypark Drive East and Tomken Road. The storm sewer crosses Courtneypark Drive East to join Catchment 103 storm sewer. The major road flow is conveyed via the roadway towards the east. Catchment 105 extends along Courtneypark Drive East ROW from Tomken Road to about 180 m east of Ordan Drive. An existing storm sewer system along Courtneypark Drive East collects runoff from this catchment. The storm sewer discharges into the existing 1200 mm storm sewer flowing in a northerly direction along Ordan Drive, and ultimately discharges to Tributary 3, Etobicoke Creek, approximately 600 m north of Courtneypark Drive East. Catchment 106 extends along Courtneypark Drive East between Catchment 105 to the west and Vipond Drive to east. The runoff from this catchment is collected via an existing 300 mm storm sewer and conveyed to a 375 mm storm sewer flowing northerly along Vipond Drive. Catchment 107 extends along Courtneypark Drive East, between Vipond Drive and Dixie Road. Runoff from this catchment is collected via an existing storm sewer and flows into a 525 mm storm sewer along Ordan Drive and ultimately discharges to Upper Etobicoke Creek. Catchment 108 represents Highway 410 northbound exit ramp and the surrounding lands. This area slopes towards a catchbasin located in the middle of the catchment. Runoff is captured by the catchbasin and conveyed to Tributary 3 via an existing 450 mm storm sewer. Catchment 109 represents the area to the west of Highway 410, between Courtneypark Drive East and Derry Road. This area sheet flows toward exiting ditches and watercourses with the Highway 410 ROW. Highway 410 northbound and southbound in the vicinity of Courtneypark Drive East is divided by grass medians. The crown of the road is located in the centre of the northbound & southbound lanes. Stormwater runoff drains laterally from the outer lanes into roadside ditches. The inner lanes drain to a central ditch within the grass median. The ditches then drain either north or south and outlet into the nearby tributary of Etobicoke Creek. Historically, stormwater runoff from Highway 410 has not received treatment before discharging to Etobicoke Creek and tributaries. mjb v:\01650\active\ courtneypark drive east class ea\design\drainage\reports\swm june 2015\ _swm_rpt docx 2.3
10
11 DRAINAGE AND STORMWATER MANAGEMENT REPORT SWM Criteria October 30, SWM Criteria Additional stormwater runoff from new pavement can impact receiving watercourses and flood conditions. Quantity and quality control measures to treat runoff should be considered for all new impervious areas and, where possible, existing surfaces. The following applicable SWM criteria are based on the City of Mississauga Design Manual and the Etobicoke Watershed Report: Quantity Control: Post-development peak flows to be controlled to pre-development peak flows for the 2 to 100 year design storms; Quality Control: Implement Enhanced Level (80% Total Suspended Solids (TSS) Removal) water quality control for all new developments; Erosion and Sediment Control: Minimum 24 hour detention of the 25mm storm event; and Conveyance: The storm sewer system should be designed to capture and convey runoff generated by the 10-year storm event. The minimum initial time of concentration is to be 15 minutes. mjb v:\01650\active\ courtneypark drive east class ea\design\drainage\reports\swm june 2015\ _swm_rpt docx 3.5

12
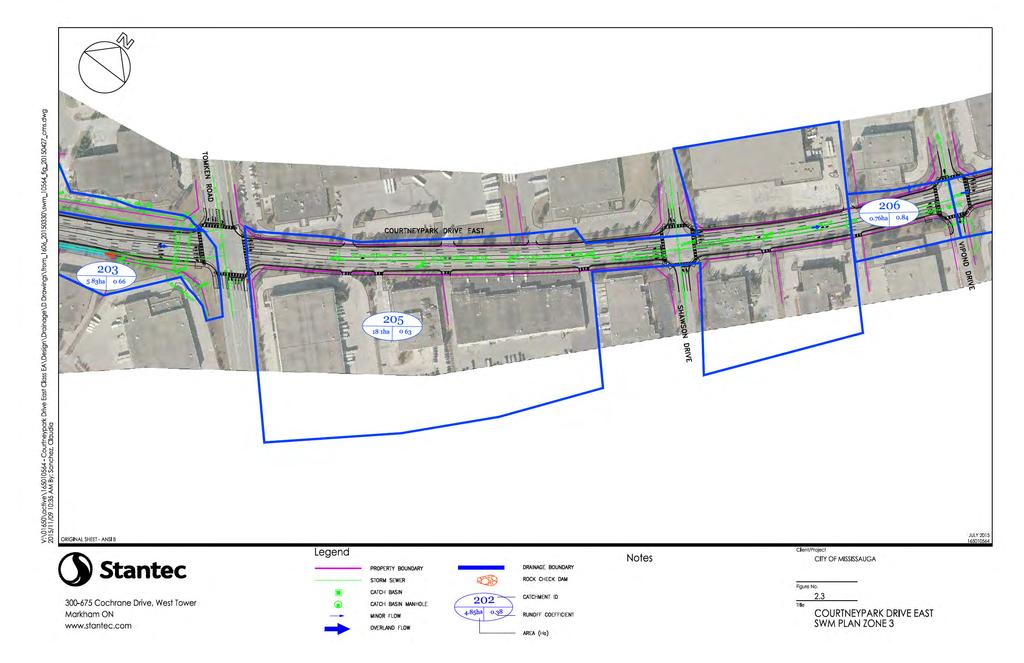
13 DRAINAGE AND STORMWATER MANAGEMENT REPORT SWM Plan October 30, 2015 proposed full interchange with Highway 410. It is also compatible with MTO s design for the reconfigured partial interchange. Additional quantity and quality control will be required for Catchment 209 i.e. the new pavement area resulting from construction of the proposed off-ramp from southbound Highway 410 to Courtneypark Drive East, which is an extension of the existing off-ramp to Derry Road. These additional controls should be provided by a new sediment basin constructed in the undeveloped area between the proposed off-ramp and the west Highway 410 ROW boundary. This sediment basin would require a minimum storage capacity of 400 m 3 and would be owned/maintained by MTO. Ultimately, it would discharge to Tributary 3 of Etobicoke Creek on the west side of Highway 410. See Figure 2.5 for further details. The overall SWM design for the full interchange, including the proposed sediment basin, should be completed during detailed design. 4.1 QUANTITY CONTROL The SWM criteria require controlling post-development peak flows to pre-development peak flows for the 2 to 100 year design storms. The study area currently does not include any measures to control the runoff before reaching the receiving Tributary 3. Due to study area constraints, it is proposed that no quantity control measures will be applied to the flow from Catchments 205, 206 and 207. The required quantity control target will be achieved by over-controlling runoff from Catchments 201, 202, 203, 204, 208, and 209. The allowable release rates were calculated using the Rational Method and the existing conditions discharge coefficients. Table 3 provides a summary of the 100-year allowable release rates and the corresponding post-development discharges without controls. The proposed development will increase the 100-year total discharge from 8.87 m 3 /s to 9.83 m 3 /s. Quantity control measures will be provided to control the total release rates to pre-development levels. The Modified Rational Method was used to calculate the 871 m 3 required quantity control storage volume. mjb v:\01650\active\ courtneypark drive east class ea\design\drainage\reports\swm june 2015\ _swm_rpt docx 4.7

14

15
16 DRAINAGE AND STORMWATER MANAGEMENT REPORT SWM Plan October 30, 2015 runoff from Catchment 206. An STC9000 is proposed to replace the existing manhole MH48 and treat runoff from Catchment 207. OGS sizing calculations are included in Appendix B. To achieve the quality control target, it is required to remove 80% of the TSS from the new 5.33 ha pavement area. The initial sediment load is assumed to be 1.0 unit of sediment x Catchment Area, i.e sediment units. By removing 80% of the TSS, the removed sediment is equal to 80%* 5.33 = 4.30 sediment units. The pre-development TSS removal efficiency for the project total drainage area of ha was calculated as 65%. The proposed quality control measures will increase the overall study area TSS removal efficiency by 22.5% (from 42.4%to 64.8%). Therefore, the additional sediment load removed from the treated areas (i.e. 22.5% * = 9.5 sediment units) is more than the required target removal of 4.40 units. Detailed quality control calculations are included in Appendix B. 4.3 EROSION AND SEDIMENT CONTROL Detention Storage The erosion and sediment control criterion requires a minimum 24 hour detention of the 25 mm storm event. Therefore, a detention volume of 1415 m 3 will be required for the 5.66 ha of new paved area. The enhanced swales and sediment basin will be utilized to provide a total detention volume of about 1875 m 3, which exceeds the required erosion and sediment control storage volume Retention Storage TRCA SWM Guidelines require on-site retention of a minimum of 5 mm of runoff from impervious areas in order to maintain downstream erosion rates. CVC and TRCA LID Guidelines includes a number of LID measures to satisfy this requirement. The following LID measures were reviewed: Bioretention: bioretention areas are planted depressions that store and filter rainwater to enhance water quality. They may be used to pre-treat runoff, prior to discharge into infiltration systems. Bioretention areas can be used to store excess stormwater when the downstream infiltration system has been surcharged. This allows infiltration to occur over an extended duration of time allowing more runoff to be infiltrated by the system. Bioretention areas also treat stormwater runoff by passing it through an engineered filter medium, collecting it in an underdrain and then returning it back to the storm drain system. Bioretention is used as both a water quality and water balance measure. Filter Strips: filter strips are vegetated areas that treat sheet flow from adjacent impervious areas. Filter strips slow runoff velocities and settle out sediment and pollutants. Small depressions can be used to provide some storage. In permeable soils, storage and infiltration occurs. Filter strips are mainly used as a water quality measure and, in suitable soils, also a water balance measure. Bioretention LID is proposed as a suitable measure to satisfy the on-site retention requirement for the proposed widening of Courtneypark Drive East. The total required retention volume is mjb v:\01650\active\ courtneypark drive east class ea\design\drainage\reports\swm june 2015\ _swm_rpt docx 4.10
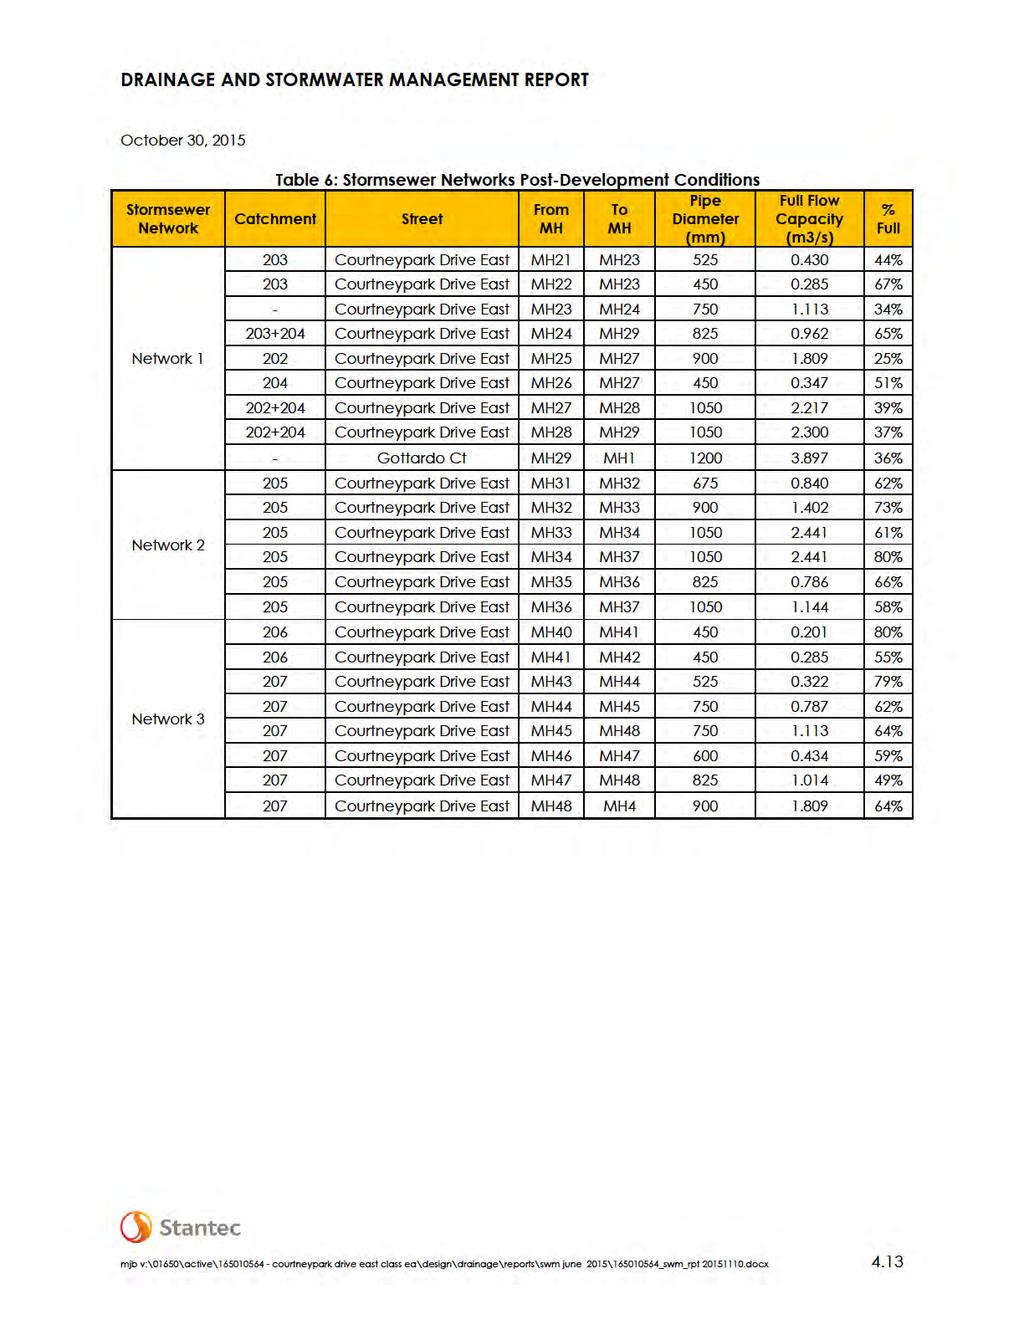
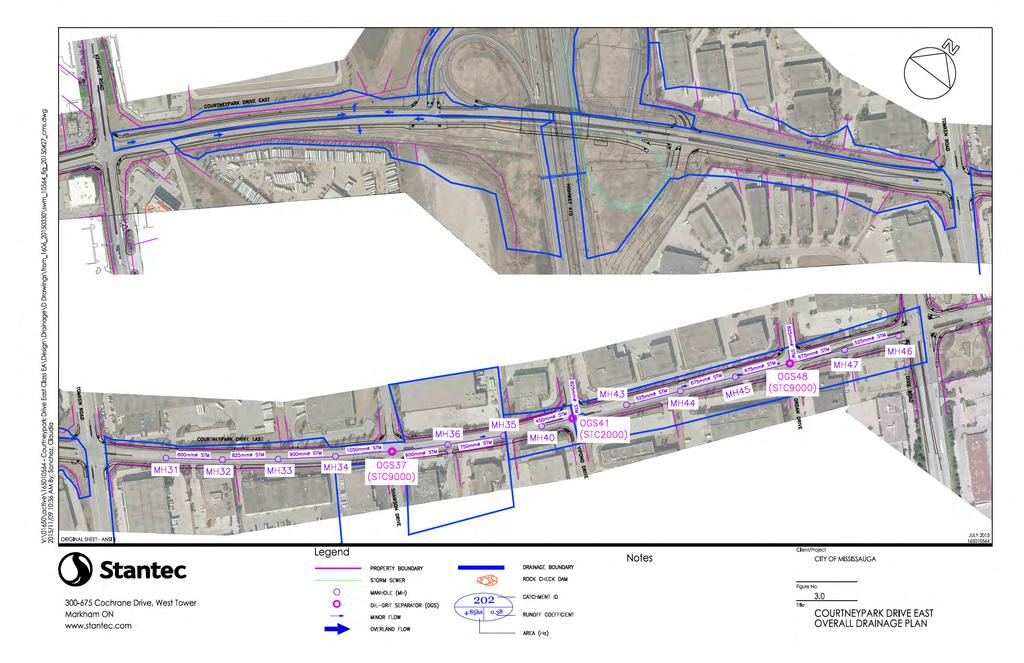
17 DRAINAGE AND STORMWATER MANAGEMENT REPORT SWM Plan October 30, 2015 calculated as 283 m 3, which is equivalent to a total infiltration trench volume of 708 m 3 (assuming a void ratio of 0.40). It is proposed to install the bioretention areas within swales SW1, SW2, and SW3. The Geotechnical Report states that clay till to clayey silt till deposits were encountered in the vicinity of swales SW1 to SW3 (boreholes BH101 to BH108), extending to depths ranging from 5.6 m to 6.7 m below the existing grade. Clay till to clayey silt till deposits are considered to have medium to low permeability. The actual dimensions of the bioretention areas will be determined during the detailed design stage, when further percolation tests results are available at the proposed bioretention areas. 4.4 DRAINAGE SYSTEM Runoff from Catchments 203 to 207 is collected via the existing stormwater systems and conveyed to Tributary 3 of Etobicoke Creek. The City of Mississauga Design Manual requires that the storm sewer network should be designed with adequate capacity to accommodate runoff generated by the 10-year storm events, and recommends 15 minutes initial time of concentration. An analysis was conducted to evaluate the capacity of the three existing networks, and to determine if the networks can adequately accommodate the increased post-development runoff. The analysis was based on the available information provided by the City. This includes plans and profiles of the existing network, topographic map of the existing roadway and adjacent areas, and the actual drainage area for each storm sewer. The analysis was done based on the best available information; however, it is highly recommended that additional information should be acquired during the detailed design stage to confirm the boundaries and characteristics of the existing drainage areas. The drainage system calculations and analysis should then be updated accordingly. Based on the available information, the analysis showed that the existing storm sewer network 1, which is located to the north of Courtneypark Drive East and receives runoff from Catchments 102, 103 and 104, has adequate capacity. The network also has adequate capacity to convey the post-development flow, since the flow from the four catchments is controlled to predevelopment conditions. Network 2, which is located along the roadway centerline, and receives runoff from Catchment 105, has inadequate capacity for both pre- and postdevelopment conditions. Network 3, which is located along the roadway centerline, and receives runoff from Catchments 106 and 107, has inadequate capacity for both pre- and postdevelopment conditions. Table 5 and Table 6 below provide summary of the network analysis, detailed analysis is provide in Appendix C. Therefore, it is proposed that the existing storm sewer system be replaced with larger pipes for Networks 2 and 3 between Tomken Road and Dixie Road. mjb v:\01650\active\ courtneypark drive east class ea\design\drainage\reports\swm june 2015\ _swm_rpt docx 4.11
18
19
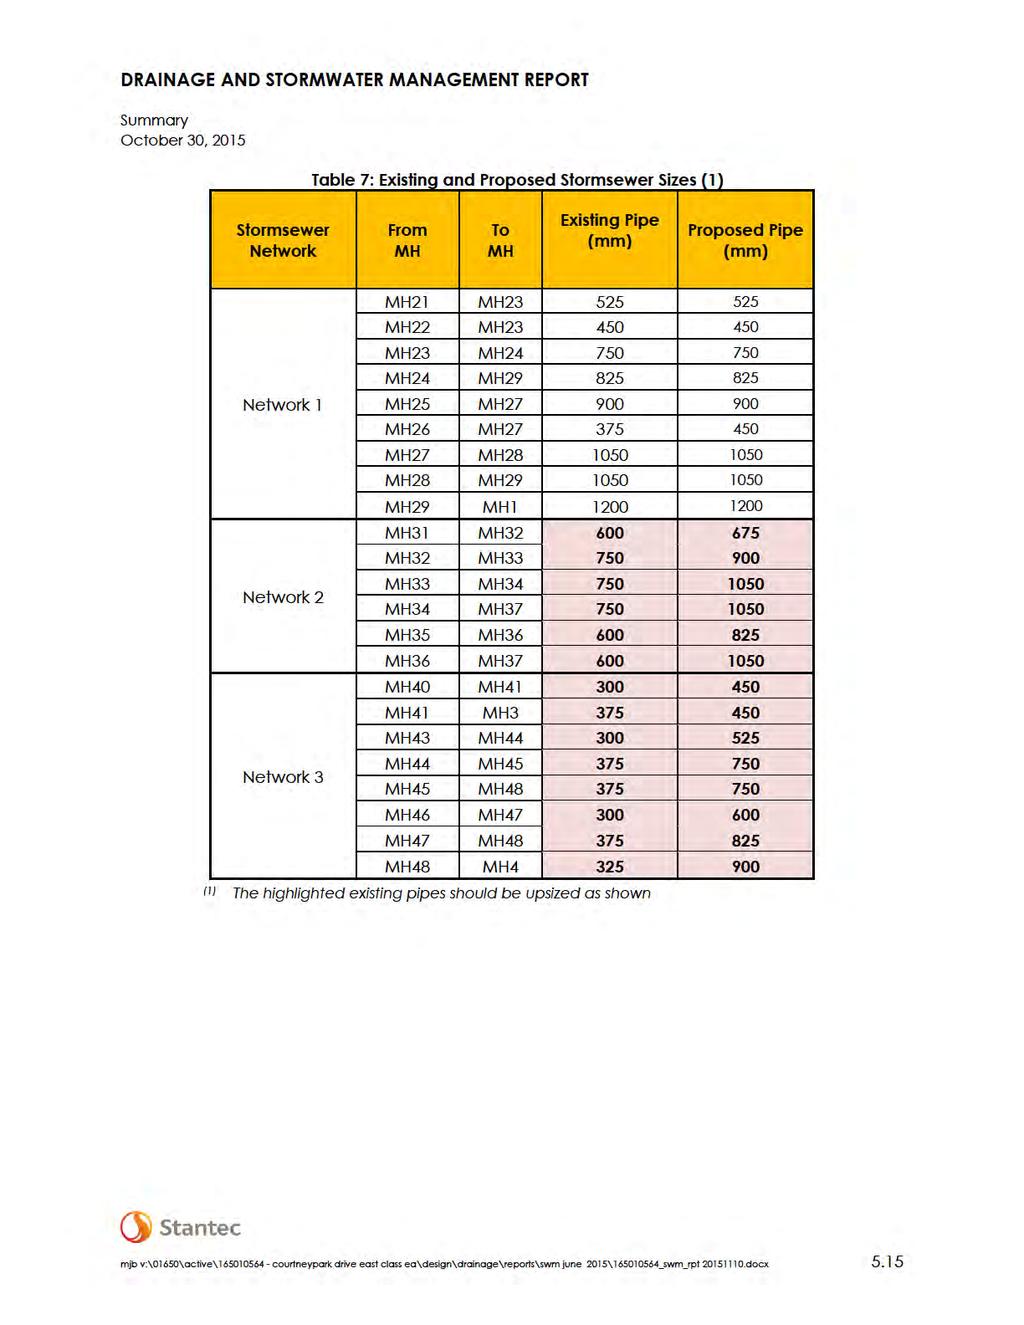
20 DRAINAGE AND STORMWATER MANAGEMENT REPORT Summary October 30, Summary The proposed plan meets the SWM criteria as summarized below: Water Quantity Control: Enhanced swales and sediment basin will be used to achieve the quantity control target of controlling post-development peak flow rates to predevelopment levels. Water Quantity Control: Enhanced swales, OGS units (3), and a sediment basin will be used to achieve the quality control target of 80 % TSS removal efficiency for the developed areas. Erosion and Sediment Control: Enhanced swales and sediment basin will be used to detain runoff generated by the 25 mm storm event for a minimum of 24 hours. Conveyance: The existing storm sewer Network 1 has adequate capacity, while Networks 2 and 3 do not have sufficient capacity to convey the current or post-development flows. Additional information regarding the actual drainage areas should be obtained during the detailed design stage. Table 7 and Table 8 below provide summary of the proposed SWM and drainage works: mjb v:\01650\active\ courtneypark drive east class ea\design\drainage\reports\swm june 2015\ _swm_rpt docx 5.14
21
22

23

24
25

26

27

28
29
30
31
32
33
34
35
36 Modified Rational Method 100 Year Storm Event Project Name : Project No. : Mississauga Rainfall Parameters: Courtneypark Dr E Class EA Apr-15 5-Year Year Year Pre-Development Conditions: Description Catchment ID Area (ha) Impervious Pervious Total Discharge Coefficient C Kennedy to Highway 410 N Kennedy to Highway 410 S Highway 410 to Tomken S Highway 410 to Tomken N Tomken to East of Ordan East of Ordan to Vipond Vipond to Dixie Parking lot Interchange Total Post-Development Conditions: Description Catchment ID Area (ha) Impervious Pervious Total Discharge Coefficient C Kennedy to Highway 410 N Kennedy to Highway 410 S Highway 410 to Tomken N Highway 410 to Tomken S Tomken to East of Ordan East of Ordan to Vipond Vipond to Dixie Parking lot Interchange Total \\cd1215-f01\work_group\01650\active\ Courtneypark Drive East Class EA\Design\Drainage\Analysis\Latest Calcs\MOD_RTNL_100_28_41_2015.xls
37 Project Name : Project No. : Rainfall intensity i: Courtneypark Dr E Class EA Allowable and Recommended Release Rates 100 Year storm i=a/(t+b)^c a,b & c are Intensity-Duration-Frequency (IDF) parameters form Missusssaga a = 1450 IDF Parameters t = 15 min b = 4.90 c = 0.78 Allowable release rate calculated using the Rational Method: Q=CiA/360 Q= Allowable release rate m 3 /s I = Rainfall intensity mm/hr 141 A = Draiange Area C = Pre-development Discharge Co-effecient Allowable Release Calculations ha 28-Apr-15 Description Catchment ID Area Discharge Coefficient C Release Rate ha m 3 /s Kennedy to Highway 410 N Kennedy to Highway 410 S Highway 410 to Tomken N Highway 410 to Tomken S Tomken to East of Ordan East of Ordan to Vipond Vipond to Dixie Parking lot Interchange Total Release Rates and Required Storage Description Catchment ID Allowable Release Required Storage Proposed Release Required Storage m 3 /s m 3 m 3 /s m 3 Kennedy to Highway 410 N Kennedy to Highway 410 S Highway 410 to Tomken N Highway 410 to Tomken S Tomken to East of Ordan East of Ordan to Vipond Vipond to Dixie Parking lot Interchange Total \\cd1215-f01\work_group\01650\active\ Courtneypark Drive East Class EA\Design\Drainage\Analysis\Latest Calcs\MOD_RTNL_100_28_41_2015.xls
38 Modified Rational Method 100 Year Storm Event Controlled Release Project Name : Courtneypark Dr E Class EA Project No. : Area ID: 201 Description: Kennedy to Highway 410 N Area = 2.06 ha "C" = 0.60 AC= 1.24 Tc = 15.0 min Missussaga 100yr Time Increment = 1.0 min a= 1450 Release Rate = 406 l/s b= 4.9 Max.Storage = 71 m 3 c= Apr-15 Time Rainfall Storm Runoff Released Storage Intensity Runoff Volume Volume Volume (min) (mm/hr) (l/s) (m 3 ) (m 3 ) (m 3 ) <<<< \\cd1215-f01\work_group\01650\active\ Courtneypark Drive East Class EA\Design\Drainage\Analysis\Latest Calcs\MOD_RTNL_100_28_41_2015.xls
39 Modified Rational Method 100 Year Storm Event Over-Controlled Release Project Name : Courtneypark Dr E Class EA Project No. : Apr-15 Area ID: 201 Description: Kennedy to Highway 410 N Area = 2.06 ha "C" = 0.60 AC= 1.24 Tc = 15.0 min Missussaga 100yr Time Increment = 5.0 min a= 1450 Release Rate = 210 l/s b= 4.9 Max.Storage = 247 m 3 c= Time Rainfall Storm Runoff Released Storage Intensity Runoff Volume Volume Volume (min) (mm/hr) (l/s) (m 3 ) (m 3 ) (m 3 ) <<<< \\cd1215-f01\work_group\01650\active\ Courtneypark Drive East Class EA\Design\Drainage\Analysis\Latest Calcs\MOD_RTNL_100_28_41_2015.xls
40 Modified Rational Method 100 Year Storm Event Controlled Release Project Name : Courtneypark Dr E Class EA Project No. : Area ID: Apr-15 Description: Kennedy to Highway 410 S Area = 4.85 ha "C" = 0.38 AC= 1.83 Missussaga 100yr Tc = 15.0 min a= 1450 Time Increment = 1.0 min b= 4.9 Release Rate = 639 l/s c= 0.78 Max.Storage = 71 m 3 Time Rainfall Storm Runoff Released Storage Intensity Runoff Volume Volume Volume (min) (mm/hr) (l/s) (m 3 ) (m 3 ) (m 3 ) <<<< \\cd1215-f01\work_group\01650\active\ Courtneypark Drive East Class EA\Design\Drainage\Analysis\Latest Calcs\MOD_RTNL_100_28_41_2015.xls
41 Modified Rational Method 100 Year Storm Event Over-Controlled Release Project Name : Courtneypark Dr E Class EA 28-Apr-15 Project No. : Area ID: 202 Description: Kennedy to Hiha Area = 4.8 "C" = 0.38 AC= 1.83 Missussaga 100yr Tc = 15.0 min a= 1450 Time Increment = 5.0 min b= 4.9 Release Rate = 450 l/s c= Max.Storage = 241 m 3 Time Rainfall Storm Runoff Released Storage Intensity Runoff Volume Volume Volume (min) (mm/hr) (l/s) (m 3 ) (m 3 ) (m 3 ) <<<< \\cd1215-f01\work_group\01650\active\ Courtneypark Drive East Class EA\Design\Drainage\Analysis\Latest Calcs\MOD_RTNL_100_28_41_2015.xls
42 Modified Rational Method 100 Year Storm Event Controlled Release Project Name : Courtneypark Dr E Class EA Project No. : Area ID: 203 Description: Highway 410 to Tomken N Area = 5.83 ha "C" = 0.66 AC= 3.83 Tc = 15.0 min Missussaga 100yr Time Increment = 1.0 min a= 1450 Release Rate = 1395 l/s b= 4.9 Max.Storage = 92 m 3 c= Apr-15 Time Rainfall Storm Runoff Released Storage Intensity Runoff Volume Volume Volume (min) (mm/hr) (l/s) (m 3 ) (m 3 ) (m 3 ) <<<< \\cd1215-f01\work_group\01650\active\ Courtneypark Drive East Class EA\Design\Drainage\Analysis\Latest Calcs\MOD_RTNL_100_28_41_2015.xls
43 Modified Rational Method 100 Year Storm Event Over Controlled Release Project Name : Courtneypark Dr E Class EA 28-Apr-15 Project No. : Area ID: 203 Description: Highway 410 to Tomken N Area = ha "C" = 0.66 AC= 3.83 Tc = 15.0 min Missussaga 100yr Time Increment = 5.0 min a= 1450 Release Rate = 1140 l/s b= 4.9 Max.Storage = 321 m 3 c= Time Rainfall Storm Runoff Released Storage Intensity Runoff Volume Volume Volume (min) (mm/hr) (l/s) (m 3 ) (m 3 ) (m 3 ) <<<< \\cd1215-f01\work_group\01650\active\ Courtneypark Drive East Class EA\Design\Drainage\Analysis\Latest Calcs\MOD_RTNL_100_28_41_2015.xls
44 Modified Rational Method 100 Year Storm Event Controlled Release Project Name : Courtneypark Dr E Class EA Project No. : Area ID: 204 Description: Highway 410 to Tomken S Area = 1.96 ha "C" = 0.60 AC= 1.18 Tc = 15.0 min Missussaga 100yr Time Increment = 1.0 min a= 1450 Release Rate = 362 l/s b= 4.9 Max.Storage = 91 m 3 c= Apr-15 Time Rainfall Storm Runoff Released Storage Intensity Runoff Volume Volume Volume (min) (mm/hr) (l/s) (m 3 ) (m 3 ) (m 3 ) <<<< \\cd1215-f01\work_group\01650\active\ Courtneypark Drive East Class EA\Design\Drainage\Analysis\Latest Calcs\MOD_RTNL_100_28_41_2015.xls
45 Modified Rational Method 100 Year Storm Event Over-Controlled Release Project Name : Courtneypark Dr E Class EA Project No. : Apr-15 Area ID: 204 Description: Highway 410 to Tomken S Area = 1.96 ha "C" = 0.60 AC= 1.18 Tc = 15.0 min Missussaga 100yr Time Increment = 5.0 min a= 1450 Release Rate = 465 l/s b= 4.9 Max.Storage = 0 m 3 c= Time Rainfall Storm Runoff Released Storage Intensity Runoff Volume Volume Volume (min) (mm/hr) (l/s) (m 3 ) (m 3 ) (m 3 ) <<<< <<<< <<<< <<<< <<<< <<<< <<<< <<<< <<<< \\cd1215-f01\work_group\01650\active\ Courtneypark Drive East Class EA\Design\Drainage\Analysis\Latest Calcs\MOD_RTNL_100_28_41_2015.xls
46 Modified Rational Method 100 Year Storm Event Project Name : Courtneypark Dr E Class EA Project No. : Area ID: 205 Description: Tomken to East of Ordan Area = ha "C" = 0.63 AC= Tc = 15.0 min Missussaga 100yr Time Increment = 1.0 min a= 1450 Release Rate = 4232 l/s b= 4.9 Max.Storage = 187 m 3 c= Apr-15 Time Rainfall Storm Runoff Released Storage Intensity Runoff Volume Volume Volume (min) (mm/hr) (l/s) (m 3 ) (m 3 ) (m 3 ) <<<< \\cd1215-f01\work_group\01650\active\ Courtneypark Drive East Class EA\Design\Drainage\Analysis\Latest Calcs\MOD_RTNL_100_28_41_2015.xls
47 Modified Rational Method 100 Year Storm Event Project Name : Courtneypark Dr E Class EA Project No. : Apr-15 Area ID: 205 Description: Tomken to East of Ordan Area = 18.1 ha "C" = 0.63 AC= Tc = 15.0 min Missussaga 100yr Time Increment = 5.0 min a= 1450 Release Rate = 4444 l/s b= 4.9 Max.Storage = 0 m 3 c= Time Rainfall Storm Runoff Released Storage Intensity Runoff Volume Volume Volume (min) (mm/hr) (l/s) (m 3 ) (m 3 ) (m 3 ) \\cd1215-f01\work_group\01650\active\ Courtneypark Drive East Class EA\Design\Drainage\Analysis\Latest Calcs\MOD_RTNL_100_28_41_2015.xls
48 Modified Rational Method 100 Year Storm Event Project Name : Courtneypark Dr E Class EA Project No. : Area ID: 206 Description: 206 Area = 0.76 ha "C" = 0.84 AC= 0.64 Tc = 15.0 min Missussaga 100yr Time Increment = 1.0 min a= 1450 Release Rate = 209 l/s b= 4.9 Max.Storage = 37 m 3 c= Apr-15 Time Rainfall Storm Runoff Released Storage Intensity Runoff Volume Volume Volume (min) (mm/hr) (l/s) (m 3 ) (m 3 ) (m 3 ) <<<< \\cd1215-f01\work_group\01650\active\ Courtneypark Drive East Class EA\Design\Drainage\Analysis\Latest Calcs\MOD_RTNL_100_28_41_2015.xls
49 Modified Rational Method 100 Year Storm Event Project Name : Courtneypark Dr E Class EA Project No. : Apr-15 Area ID: 206 Description: 206 Area = 0.76 ha "C" = 0.84 AC= 0.64 Tc = 15.0 min Missussaga 100yr Time Increment = 5.0 min a= 1450 Release Rate = 250 l/s b= 4.9 Max.Storage = 0 m 3 c= Time Rainfall Storm Runoff Released Storage Intensity Runoff Volume Volume Volume (min) (mm/hr) (l/s) (m 3 ) (m 3 ) (m 3 ) \\cd1215-f01\work_group\01650\active\ Courtneypark Drive East Class EA\Design\Drainage\Analysis\Latest Calcs\MOD_RTNL_100_28_41_2015.xls
50 Modified Rational Method 100 Year Storm Event Project Name : Courtneypark Dr E Class EA Project No. : Area ID: 207 Description: Vipond to Dixie Area = 4.51 ha "C" = 0.77 AC= 3.48 Tc = 15.0 min Missussaga 100yr Time Increment = 1.0 min a= 1450 Release Rate = 1228 l/s b= 4.9 Max.Storage = 120 m 3 c= Apr-15 Time Rainfall Storm Runoff Released Storage Intensity Runoff Volume Volume Volume (min) (mm/hr) (l/s) (m 3 ) (m 3 ) (m 3 ) <<<< \\cd1215-f01\work_group\01650\active\ Courtneypark Drive East Class EA\Design\Drainage\Analysis\Latest Calcs\MOD_RTNL_100_28_41_2015.xls
51 Modified Rational Method 100 Year Storm Event Project Name : Courtneypark Dr E Class EA Project No. : Apr-15 Area ID: 207 Description: Vipond to Dixie Area = 4.51 ha "C" = 0.77 AC= 3.48 Tc = 15.0 min Missussaga 100yr Time Increment = 5.0 min a= 1450 Release Rate = 1362 l/s b= 4.9 Max.Storage = 0 m 3 c= Time Rainfall Storm Runoff Released Storage Intensity Runoff Volume Volume Volume (min) (mm/hr) (l/s) (m 3 ) (m 3 ) (m 3 ) \\cd1215-f01\work_group\01650\active\ Courtneypark Drive East Class EA\Design\Drainage\Analysis\Latest Calcs\MOD_RTNL_100_28_41_2015.xls
52 Modified Rational Method 100 Year Storm Event Controlled Release Project Name : Courtneypark Dr E Class EA Project No. : Area ID: Apr-15 Description: Parking lot Area = 2.17 ha "C" = 0.61 AC= 1.32 Tc = 15.0 min Missussaga 100yr Time Increment = 5.0 min a= 1450 Release Rate = 375 l/s b= 4.9 Max.Storage = 126 m 3 c= 0.78 Time Rainfall Storm Runoff Released Storage Intensity Runoff Volume Volume Volume (min) (mm/hr) (l/s) (m 3 ) (m 3 ) (m 3 ) <<<< \\cd1215-f01\work_group\01650\active\ Courtneypark Drive East Class EA\Design\Drainage\Analysis\Latest Calcs\MOD_RTNL_100_28_41_2015.xls
53 Modified Rational Method 100 Year Storm Event Over-Controlled Release Project Name : Courtneypark Dr E Class EA Project No. : Area ID: Apr-15 Description: Parking lot Area = 2.2 ha "C" = 0.61 AC= 1.32 Tc = 15.0 min Missussaga 100yr Time Increment = 5.0 min a= 1450 Release Rate = 100 l/s b= 4.9 Max.Storage = 418 m 3 c= Time Rainfall Storm Runoff Released Storage Intensity Runoff Volume Volume Volume (min) (mm/hr) (l/s) (m 3 ) (m 3 ) (m 3 ) <<<< \\cd1215-f01\work_group\01650\active\ Courtneypark Drive East Class EA\Design\Drainage\Analysis\Latest Calcs\MOD_RTNL_100_28_41_2015.xls
54 Modified Rational Method 100 Year Storm Event Controlled Release Project Name : Courtneypark Dr E Class EA Project No. : Area ID: Apr-15 Description: Highway 410 Interchange Area = 1.89 ha "C" = 0.90 AC= 1.70 Tc = 15.0 min Missussaga 100yr Time Increment = 5.0 min a= 1450 Release Rate = 202 l/s b= 4.9 Max.Storage = 428 m 3 c= 0.78 Time Rainfall Storm Runoff Released Storage Intensity Runoff Volume Volume Volume (min) (mm/hr) (l/s) (m 3 ) (m 3 ) (m 3 ) <<<< \\cd1215-f01\work_group\01650\active\ Courtneypark Drive East Class EA\Design\Drainage\Analysis\Latest Calcs\MOD_RTNL_100_28_41_2015.xls
55 Project Name : Project No. : Courtneypark Dr E Class EA Apr-15 Swales and Check Dams Design Swale SW1 (Located North of the proposed road between Kennedy Road and Highway 410) Storage Calculations: Drainage Area ha 2.06 Swale Length m 420 Upstream Invert m Downstream Invert m 189 Longitudinal Slope (S) 0.36% Bed Width (B) m 0.75 Side Slope (Z) 2 Manning Coefficient (n) 0.04 ( grassed swale ) Allowable Release rate (100-Year) m 3 /s Required Storage Volume m To provide storage, install 3 concrte check m intervals Average length of swale reach m 140 Upstream max depth m 0.1 Upstream flow X-section area m Downstream maximum depth m 0.60 ( 100 Year Storm flow) Downstream flow X-section area m Stored water Volume per reach m 3 89 (between check dams) Total swale storage volume m (For full length of swale) Swale D/S Cross Section W= Z=2:1 B=0.75 Swale Flow Capacity and Velocity Calculations Rational Method Used to Calculate Catchment Peak Flow Manning's Equation to Calcualate Channel Flow Velocity Storm Event 2 Yaer 100 Yaer Rainfall intensity mm/hr (Q=.028*C*I*A) (V=R 2/3 * S 1/2 /n) Peak Flow m 3 /s (Rational Marthod) Water Depth (D) m ( Assumed) Top Width (W) m (W=B+2*Z*D) Flow Area (A) m (A=W+B)/2*D Wetted Perimeter (P) m (P=B+2*D*sqrt(1+2*Z2)^) Hydraulic Radius 'R m (R=A/P) Design Velocity V(des) m/s (V=R 2/3 * S 1/2 /n) Channel Discharge (Q) m 3 /s (Q=V * A) \\cd1215-f01\work_group\01650\active\ Courtneypark Drive East Class EA\Design\Drainage\Analysis\Latest Calcs\MOD_RTNL_100_28_41_2015.xls
56 Project Name : Project No. : Courtneypark Dr E Class EA Apr-15 Swales and Check Dams Design Flow across the dams will be controlled by orifice tubes and broad crested weirs The orifice tubes will be located at the bottom of the check dams The broad crested weirs will be located 0.3 m below the maximum water elevation 3 concrete check dams will be m intervals Check Dam 1: The dam will be located 140 m from swale upstream end Dam height 0.60 m Dam width 3.1 m The allowable 100 Year Flow 0.07 m 3 /s Orifice tube flow: Orifice Equation: Q = CdA(2gh) 1/2 Max. water elevation m Invert m Size 75 mm C 0.8 Obvert m Area m 2 Head 0.56 m Maximum Release m 3 /s Rectangular Broad Crested Weir Flow: Rectangular Broad Crested Weir equation Weir Invert = m Weir Length = 0.3 m Maximum water elevation m Head above weir 0.30 m Weir Coefficient (C d ) 1.6 Flow Area 0.09 m 2 Weir flow 0.08 m 3 /s Total flow through the check dam (orifice + weir flow) 0.09 m 3 /s Q=CLH^1.5 \\cd1215-f01\work_group\01650\active\ Courtneypark Drive East Class EA\Design\Drainage\Analysis\Latest Calcs\MOD_RTNL_100_28_41_2015.xls
57 Project Name : Project No. : Check Dam 2: Courtneypark Dr E Class EA Apr-15 The dam will be located 280 m from swale upstream end Swales and Check Dams Design Dam height 0.60 m Dam width 3.1 m The allowable 100 Year Flow 0.14 m 3 /s Orifice tube flow: Orifice Equation: Q = CdA(2gh) 1/2 Max. water elevation m Invert m Size 75 mm C 0.8 Obvert m Area m 2 Head 0.56 m Maximum Release m 3 /s Rectangular Broad Crested Weir Flow: Rectangular Broad Crested Weir equation Q=CLH^1.5 Weir Invert = m Weir Length = 0.67 m Maximum water elevation m Head above weir 0.30 m Weir Coefficient (C d ) 1.6 Flow Area m 2 Weir flow 0.18 m 3 /s Total flow through the check dam (orifice + weir flow) 0.19 m 3 /s \\cd1215-f01\work_group\01650\active\ Courtneypark Drive East Class EA\Design\Drainage\Analysis\Latest Calcs\MOD_RTNL_100_28_41_2015.xls
58 Project Name : Project No. : Check Dam 3: Courtneypark Dr E Class EA Apr-15 The dam will be located 420 m from swale upstream end Swales and Check Dams Design Dam height 0.60 m Dam width 3.1 m The allowable 100 Year Flow 0.21 m 3 /s Orifice tube flow: Orifice Equation: Q = CdA(2gh) 1/2 Max. water elevation m Invert m Size 100 mm C 0.8 Obvert m Area m 2 Head 0.55 m Maximum Release m 3 /s Rectangular Broad Crested Weir Flow: Rectangular Broad Crested Weir equation Q=CLH^1.5 Weir Invert = m Weir Length = 0.97 m Maximum water elevation m Head above weir 0.30 m Weir Coefficient (C d ) 1.6 Flow Area m 2 Weir flow 0.26 m 3 /s Total flow through the check dam (orifice + weir flow) 0.28 m 3 /s \\cd1215-f01\work_group\01650\active\ Courtneypark Drive East Class EA\Design\Drainage\Analysis\Latest Calcs\MOD_RTNL_100_28_41_2015.xls
59 Project Name : Project No. : Courtneypark Dr E Class EA Apr-15 Swales and Check Dams Design Swale SW2 (Located South of the proposed road between Kennedy Road and Highway 410) Storage Calculations: Drainage Area ha 4.85 Swale Length m 500 Upstream Invert m 190 Downstream Invert m Longitudinal Slope (S) 0.30% Bed Width (B) m 1.00 Side Slope (Z) 2 Manning Coefficient (n) 0.04 ( grassed swale ) Allowable Release rate (100-Year) m 3 /s 0.45 Required Storage Volume m To provide storage, install 4 concrte check m intervals Average length of swale reach m 125 Upstream max depth m 0.2 Upstream flow X-section area m Downstream maximum depth m 0.58 ( 100 Year Storm flow) Downstream flow X-section area m Stored water Volume per reach m 3 95 (between check dams) Total swale storage volume m (For full length of swale) Swale D/S Cross Section W= Z=2:1 B=1 Swale Flow Capacity and Velocity Calculations Rational Method Used to Calculate Catchment Peak Flow Manning's Equation to Calcualate Channel Flow Velocity Storm Event 2 Yaer 100 Yaer Rainfall intensity mm/hr (Q=.028*C*I*A) (V=R 2/3 * S 1/2 /n) Peak Flow m 3 /s (Rational Marthod) Water Depth (D) m ( Assumed) Top Width (W) m (W=B+2*Z*D) Flow Area (A) m (A=W+B)/2*D Wetted Perimeter (P) m (P=B+2*D*sqrt(1+2*Z2)^) Hydraulic Radius 'R m (R=A/P) Design Velocity V(des) m/s (V=R 2/3 * S 1/2 /n) Channel Discharge (Q) m 3 /s (Q=V * A) \\cd1215-f01\work_group\01650\active\ Courtneypark Drive East Class EA\Design\Drainage\Analysis\Latest Calcs\MOD_RTNL_100_28_41_2015.xls
60 Project Name : Courtneypark Dr E Class EA Project No. : Apr-15 Swales and Check Dams Design Flow across the dams will be controlled by orifice tubes and broad crested weirs The orifice tubes will be located at the bottom of the check dams The broad crested weirs will be located 0.3 m below the maximum water elevation 3 concrete check dams will be m intervals Check Dam 1: The dam will be located 125 m from swale upstream end Dam height 0.57 m Dam width 3.3 m The allowable 100 Year Flow 0.11 m 3 /s Orifice tube flow: Orifice Equation: Q = CdA(2gh) 1/2 Max. water elevation m Invert m Size 75 mm C 0.8 Obvert m Area m 2 Head 0.54 m Maximum Release m 3 /s Rectangular Broad Crested Weir Flow: Rectangular Broad Crested Weir equation Weir Invert = m Weir Length = 0.45 m Maximum water elevation m Head above weir 0.30 m Weir Coefficient (C d ) 1.6 Flow Area m 2 Weir flow 0.12 m 3 /s Total flow through the check dam (orifice + weir flow) 0.13 m 3 /s Q=CLH^1.5 \\cd1215-f01\work_group\01650\active\ Courtneypark Drive East Class EA\Design\Drainage\Analysis\Latest Calcs\MOD_RTNL_100_28_41_2015.xls
61 Project Name : Courtneypark Dr E Class EA Project No. : Apr-15 Swales and Check Dams Design Check Dam 2: The dam will be located 250 m from swale upstream end Dam height 0.57 m Dam width 3.3 m The allowable 100 Year Flow 0.23 m 3 /s Orifice tube flow: Orifice Equation: Q = CdA(2gh) 1/2 Max. water elevation m Invert m Size 100 mm C 0.8 Obvert m Area m 2 Head 0.52 m Maximum Release m 3 /s Rectangular Broad Crested Weir Flow: Rectangular Broad Crested Weir equation Q=CLH^1.5 Weir Invert = m Weir Length = 0.9 m Maximum water elevation m Head above weir 0.30 m Weir Coefficient (C d ) 1.6 Flow Area 0.27 m 2 Weir flow 0.24 m 3 /s Total flow through the check dam (orifice + weir flow) 0.26 m 3 /s \\cd1215-f01\work_group\01650\active\ Courtneypark Drive East Class EA\Design\Drainage\Analysis\Latest Calcs\MOD_RTNL_100_28_41_2015.xls
62 Project Name : Courtneypark Dr E Class EA Project No. : Apr-15 Swales and Check Dams Design Check Dam 3: The dam will be located 375 m from swale upstream end Dam height 0.57 m Dam width 3.3 m The allowable 100 Year Flow 0.34 m 3 /s Orifice tube flow: Orifice Equation: Q = CdA(2gh) 1/2 Max. water elevation m Invert m Size 100 mm C 0.8 Obvert m Area m 2 Head 0.52 m Maximum Release m 3 /s Rectangular Broad Crested Weir Flow: Rectangular Broad Crested Weir equation Q=CLH^1.5 Weir Invert = m Weir Length = 1.35 m Maximum water elevation m Head above weir 0.30 m Weir Coefficient (C d ) 1.6 Flow Area m 2 Weir flow 0.35 m 3 /s Total flow through the check dam (orifice + weir flow) 0.38 m 3 /s \\cd1215-f01\work_group\01650\active\ Courtneypark Drive East Class EA\Design\Drainage\Analysis\Latest Calcs\MOD_RTNL_100_28_41_2015.xls