TNO-MACC emission inventory:
|
|
|
- Bartholomew Gilmore
- 5 years ago
- Views:
Transcription

1 TNO-MACC emission inventory: To support the reanalysis exercise in EU FP7 MACC a consistent, high resolution anthropogenic emission database for is needed Hugo Denier van der Gon, Antoon Visschedijk, Jeroen Kuenen, Magdalena Jozwicka, Rene van Gijlswijk
2 TNO European emission databases for AQ modelling a bit of history (and excluding HM and POP data) s emission databases for TNO LOTOS model CEPMEIP base year 1995 focused on PM (TNO, 2000) UBA base year 2000; ¼ x 1/8 lon_lat resolution (~13 x 13 km); priority pollutants (TNO, 2005) GEMS base year 2003; based on UBA (TNO, 2005) increased resolution 1/8 x 1/16 lon_lat (~ 7 x 7 km) (TNO, 2007) TNO base year 2005: On-going improvements in three projects UBA - PAREST (spatial distribution base year 2005); FP6 EUCAARI (EC/OC); FP7 MEGAPOLI (Mega city scale) FP7 MACC High resolution emission data for FP7 TRANSPHORM & ENERGEO focus on transport & energy sectors
3 Approach to base year inventory (2005) In the past independent emission inventories were made.. The TNO year 2005 emission inventory is set up using official reported emissions at the source sector level as much as possible Makes use of national expertise & links to the policy arena Emissions are downloaded from the European Environment Agency ( However, the reported emissions by individual countries contain gaps and errors various consistency checks need to be made. Alternative emissions : IIASA GAINS emissions and /or TNO default. Extreme deviations adjusted - allows maximum use of official data while not hazarding the quality of the final result 3

4 EPER reported power plants overlaying the TNO data base 5


5 Non-urban road transport emissions distributed using a European traffic intensity road map based on EU Transtools project Completed East-ward with simple road network 6
6 MACC European emissions Emission (2005=1) Year Reported data NOx SO2 CO NMVOC NH3 CH4 PM10 PM2.5 Direct use of reported annual emission data is not possible... Consistency checks and gapfilling For countries where no emission data for these years are available linear interpolation between and projected 2010 Result is scaling factors relative to 2005 emission by individual source category by country by year 7
7 Final emission data for UNECE-Europe (TNO MACC emission set) Emissions (kton) Difference vs 2003 NOx % SO % CO % NMVOC % NH % CH % PM % PM % Base year data. AQMEII year 8
8 Emission reduction in 2007 compared to 2003 in EU15, EU12 and Non EU countries 9

9 Checks are done on observed patterns Oil platform flaring: error in NL scaling factor SNAP09 > corrected Denmark PM10 increase ~ 20% from = correct 10
 to validate emissions with NO2 satellite data 11")
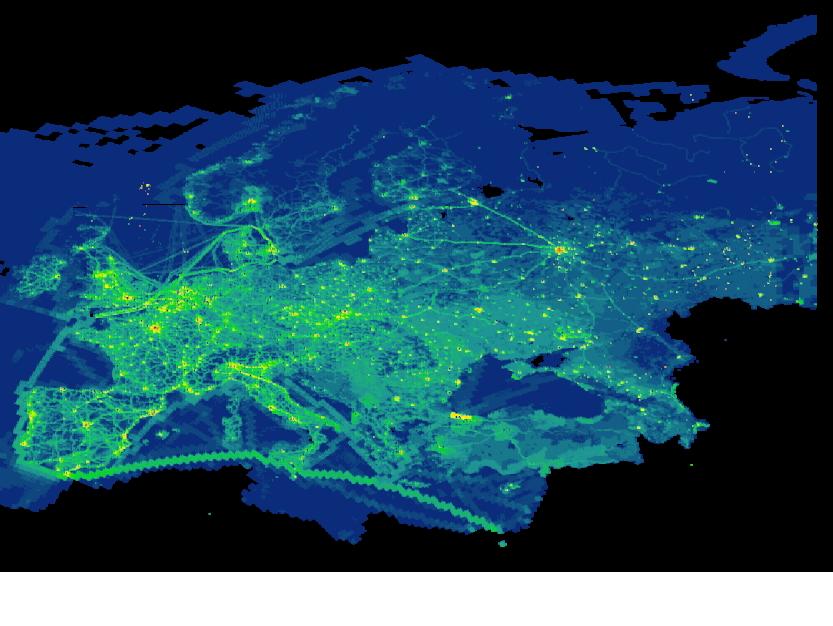
10 Intensity of NOx emission Europe 2005 on 1/8th x 1/16th degree lon-lat This data is currently being used by various groups (e.g. KNMI, TNO, EMPA) to validate emissions with NO2 satellite data 11
11 Chemical composition of the MACC PM emissions Air quality models often need to split the PM emissions into its chemical components to account for the particulate behaviour. To accommodate this need a specific PM bulk composition profile file was composed based on work done by TNO in e.g. FP6 EUCAARI and others. Chemical components: elemental carbon (EC), organic carbon (OC), sulphate, sodium and other mineral components. Best service (within budget ;-)) to MACC regional is to make a PM split table by country by source sector that breaks down the PM10 and PM2.5 into components. (sum = 1) Why per country? Because fuel and technologies differ widely between countries (e.g. residential combustion NL vs Poland) 14
12 Example of application to Austria PM10 emissions Austria 2005 (45.5 kt) PM10 emission (tonnes) SO4 Other mineral OC (Full Molecular Mass) Na EC Source sector 16

13 Spatial distribution of the EC component in PM2.5 17


14 Spatial distribution of EC emission over the North of Spain Spatial distribution of particlebound sulphate over the North of Spain. Note the importance of point sources. 18
15 EEA Questions: What are the data flows, challenges and successes in developing emissions inventory data for GMES projects? What made TNO-MACC a successful EI for GMES & AQ modelling? High resolution > 50 x 50 km is not sufficient Gap filled, checked for errors (PM2.5 > PM10 etc.) complete, replace unlikely figures Consistent in space (one grid, all countries distributed in equal quality, transparent & easy to implement) Consistent in time (over the years) trends are trends, not artifacts A group that is responsible for your emission grid and answers your questions.e.g., When there is no EC grid, we make it.(if project funded) When a certain hotspot doesn t show up in the satellite image we jointly try to clarify.errors? Artifacts of distribution? Or overestimated emissions? Really every user has questions.e.g. in FP7 Pasodoble we don t develop emissions we only provide & answer questions 19
16 Is there a mismatch between available emission inventory data and application of these in GMES and atmospheric modelling projects? Available from EEA or from TNO? ;-) Domain EU27 is not enough; reporting is slow in including new pollutants (EC, PN); unclear what (semi-natural) sources are missing; strike a balance between official & accurate Annual totals and lumped species (NMVOC) are not the detail that is needed What has been done to fix this mismatch? This is apparently no ones task Case by case basis, depending on projects and project needs fixing lags behind: time profiles, NMVOC splits often outdated Emission reporting/inventory world often has different aims (fulfilling of an obligation, policy negotiations) This is not understood by GMES and AQ users. 20
17 21 Example of what a user from another discipline will not understand Consistency in base year reported EI data (PM10; kt) NETHERLANDS DENMARK POLAND GERMANY It s great that this can still be downloaded!!!!! Thnx to CEIP.
18 PM10 discrepancies. (max. Base Year value min. BY value)/ min BY value Differences: Base Year Austria 29% 23% Belgium 54% 22% Denmark 79% 23% France 13% 3% Germany 29% 12% Italy 13% 11% Netherlands 62% 20% Norway 4% 2% Poland 0% 0% Sweden 70% 28% United Kingdom 10% 11% Realize that often we discuss measures that have a few % impact. It might be progress in emission reporting. but clear that some guidance is needed for a user to understand and believe in the data 22
19 What are the key datasets that are important? EEA gap-filled data & CEIP webdab, IIASA GAINS All spatial distribution proxy maps (road network, point sources etc.) TNO s own bottom-up data: Activity data (statistics) & EFs to fill gaps, cross check How is the data kept up-to-date? All It in is not!....again all the wrong case perspective my by case, depending personal projects. back of enveloppe figure: For example, EU27 to spends limit costs ~ we work milj euro/yr with base on years. emission Current reporting base (incl year GHG) is but Next impossible base year to should get 1% be to improve 2012 across would the be the board right year to work establish on that base but no years funds every yet. 5 years.. It should not just be keep up-to-date but also improve!!! Quite a problem difficult/impossible to convince e.g the Dutch government that they need to fund a project that harmonizes and cross-checks European data why should they? 23
20 24 Wrap-Up & outlook the TNO-MACC emission data is widely used (MACC, various other EU IPs, AQMEII) we can claim it is state of the art used by basically all model groups in Europe! It links in with accepted and reported data (but omits outliers) thus being close to policy making Gaps are filled, it is complete but substantial uncertainties exist A time series of now 1999 added (EURODELTA_3) Note that the high resolution is a down-scaled approach large deviations are possible (FP7 MEGAPOLI experience) In MACC-II we hope to work on updating of temporal profiles, inclusion of , and improved shipping emissions Improvements are now feasible using source apportionment studies For specific problems we make full bottom-up inventories again there is a clear need for scientific shadow emission inventories for particular pollutants or source sectors


21 Acknowledgements: EUCAARI 25 Contact: