Management of Thunder Bay Contaminated Sediment
|
|
|
- Shannon Taylor
- 5 years ago
- Views:
Transcription
1 Management of Thunder Bay Contaminated Sediment Sue-Jin An Kay Kim, Roger Santiago, and Rupert Joyner Environment Canada Oct. 24, 2012
2 Great Lakes Areas of Concern (AOC) Thunder Bay was designated an AOC in 1987 under the Canada United States Great Lakes Water Quality Agreement (GLWQA). GLWQA has been amended in Under the GLWQA, AOCs are sites on the Great Lakes system where significant impairment of beneficial uses has occurred as a result of human activities at the local level.

3 Canadian Great Lakes AOCs

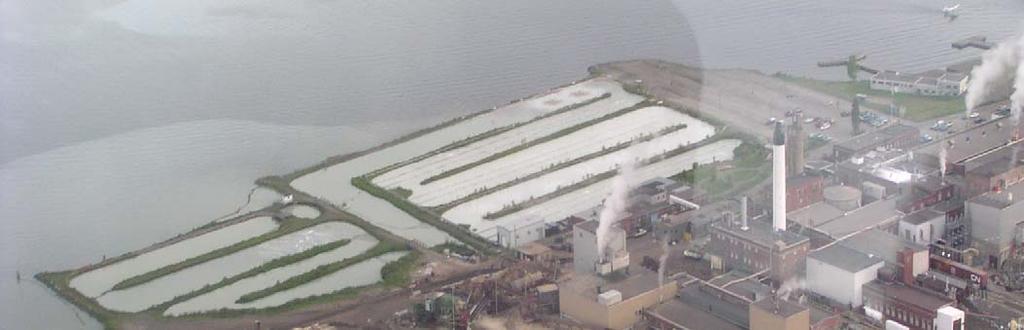

4 Thunder Bay North Harbour Historical operation of paper mill

 Up to ~6 m of greyish,")

5 Background COCs: TOC, Cu, Hg, Resin Acids Volume: ~350,000 m 3 Area: 22 Ha (54.4 acres) Up to ~6 m of greyish, digested pulp deposit Sediment consists mainly of digested pulp, silt and clay Entrapped gas bubbles
6 Summary of Studies and Investigations BEnthic Assessment of Sediment (BEAST) * by Environment Canada Sediment Characterization Studies: Chemical/Geotechnical characterization Standard Penetration Test (SPT) Cone Penetration Test (CPT) Vane Shear Test Sampling/coring via split spoon and freeze core for lab analyses soil index properties chemical analyses Sediment Treatability Studies Dewatering Studies * Based on Canada-Ontario Decision Making Framework

7 Canada-Ontario Decision-Making Framework Standard Approach to decision-making process taking into account site specific considerations


8 BEnthic Assessment of Sediment (BEAST) Management Action Required Biomagnification Potential Toxic Non-Toxic Based on Canada-Ontario Decision Making Framework


9 Sediment Characterization Low density Able to absorb water 6 times its weight (86% in water wt./sample wt.) Unable to determine grain size using standard methods due to fibrous nature Likely anaerobic Generally loose Generally soft and compressible

10 Sediment Characterization Cone Penetration Test indicates native sediments below soft organic layer were soft and compressible. Organic material could not be defined Underlying substance composed of silts and clayey silts with some sensitive fines Very low strength after disturbance


11 Sediment Characterization Freeze Coring was undertaken to obtain samples of soft organic sediment Enriched organic sediments exhibited high surface tension: a thin weave like surface texture of the wood fibre/pulp waste, unable to collect core samples. Attempt to recover samples using vibracore was unsuccessful; only able to penetrate the surficial layer of the organic sediment.
12 Sediment Treatability Test Dredge Elutriate Test Helps to understand site-water column contaminant concentrations Total Hg concentration in the mixture: 42µg/L Dissolved Hg in the mixture: 0.2µg/L Ontario Provincial Water Quality Objective (PWQO) of 0.2µg/L Further studies are ongoing to identify whether mitigation measure will be required.


13 Sediment Treatability Test Column Settling Test Visible turbidity persisting throughout 96 hours. Minimal reduction after 6 hours; Organic particles will stay in suspension
 L/kg and 0.")
14 Sediment Treatability Test Pancake Column Leach Test (PCLT) Total mass of mercury partitioned to water in12 leach cyc: mg Kd and Total [Hg] at the end of PCLT : 4.77 (Log) L/kg and 0.3µg/L

15 Sediment Treatability Test Pancake Column Leach Test (PCLT) Methyl Mercury Concentration Methyl mercury leachate concentrations ranged up to 52.5 ng/l which exceeds the interim CWQG of 4 ng/l. Based on these results, containment requirements will need to be studied for CDF/capping option.
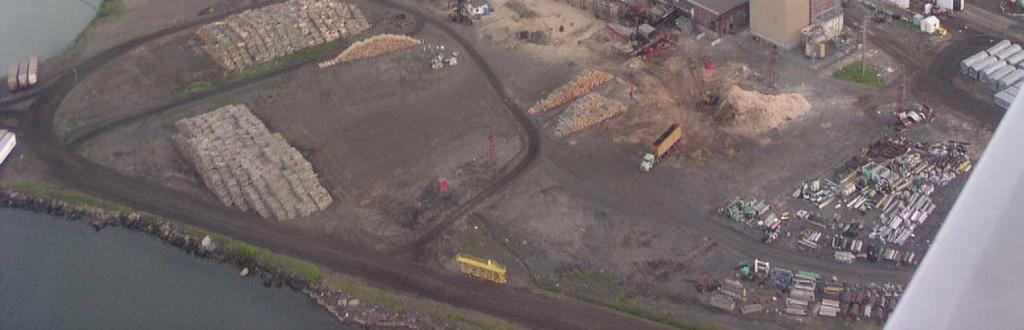
16 Dewatering Study Excavator was used for sample collection Results of 3 separate mechanical dewatering tests indicated at least approx. 49% (vol.) can be removed by the following methods The best results were achieved using a filter press with 79% volume reduction Dewatering study effluent indicates: ~ph 4 Mechanical Dewatering Tests Parameters Centrifuge Filter Press Belt Press Starting % solids Ending % solids by wt Percent reduction by vol Percent reduction by wt Cake specific gravity Cake ph Cake appearance Effluent appearance Moist, spongy, water squeezes out of cake Clear/slight haze Moist, no water squeezes out of cake Clear/hazy/ cloudy Moist, spongy, water squeezes out of cake Clear/hazy/clou dy


17 Observations during sample collection If dredged, resuspension of organic sediment will need to be managed


18 Footage of Sampling


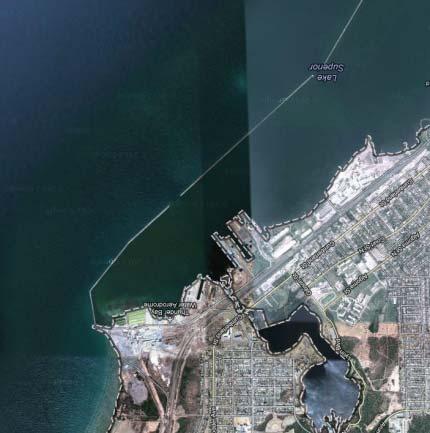
19 Potential Management Actions Isolation Capping Dredging and Disposal at Mission Bay CDF Potential Capping Area

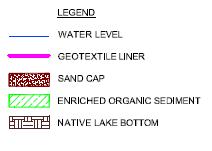
20 Isolation Capping

21 Dredging & Disposal at Mission Bay CDF Mission Bay CDF
22 Next Steps Complete Ecological Risk Assessment and Human Health Risk Assessment Refine Feasibility Studies of Management Options with additional studies: Core and/or grab sampling for organic sediment and native sediment for geotechnical and chemical characterization In-situ strength tests for organic sediments Cap Modelling Geotechnical borings for Mission Bay CDF berms Core and/or grab sampling for Mission Bay Containment Cell sediments Seepage Induced Consolidation Testing (SICT), etc. Recommend preferred Management Option


23 Thank You! Questions? Special Thanks to Matt Graham and Erin Hartman Sue-Jin An