SCOPING AND PLANNING OF THE ASSESSMENT OF BASIN-WIDE DEVELOPMENT SCENARIOS
|
|
|
- Maurice Christopher Watts
- 5 years ago
- Views:
Transcription

1 Mekong River Commission Basin Development Plan Programme, Phase 2 Assessment of basin-wide development scenarios Technical Note 1 SCOPING AND PLANNING OF THE ASSESSMENT OF BASIN-WIDE DEVELOPMENT SCENARIOS Version: 3.1 Date: March 23, 2009
2 Contents Amendment Record This report has been issued and amended as follows: Revision Description Date Approved 0 Scoping of the assessment of basin-wide development scenarios, 1st draft 1 Scoping and planning of the assessment of basin-wide development scenarios, 2 nd draft. This version incorporates the suggestions by MRC Programmes and the RTWG 2 Scoping and planning of the assessment of basin-wide development scenarios, Final draft. This version incorporates additional information regarding the work plan and the implementation modalities 3 Final report, which addresses the comments and suggestions of the RTWG on March 2009 November 2008 PTH 15 January 2009 PTH 17 March 2009 PTH 23 March 2009 PTH
3 TABLE OF CONTENTS Abbreviations and Acronyms... iii Contents Amendment Record... i 1 BACKGROUND Aim of this note Development context Objective and scope of basin development planning Participatory process SCOPING OF THE FORMULATION OF SCENARIOS approach Purpose of scenarios Scope of scenarios Scoping of scenario formulation Defined scenarios SCOPING OF THE ASSESSMENT OF SCENARIOS Assessment approach Scoping of the hydrological assessment Preliminary results of the hydrological assessment Blockage of migratory fish by dams Scoping of broader assessment criteria Scoping of the economic, social and environmental impact assessment IMPLEMENTATION OF THE SCENARIO ASSESSMENT Two-track approach Priority assessment activities Work plan Risks and uncertainties Output, reporting and capacity building Data and information needs Implementation arrangements Implementation of the research activities Terms of reference for work plan components Estimated expert requirements... 39
4 List of Tables 1. Summary of scenario components 2. Main water resources developments in the considered scenarios 3. Schedule of hydrological assessments 4. Preliminary scoping of the main and minor hydrological changes, and the associated transboundary economic, environmental and social impacts caused by the Chinese Dam and the Definite Future 5. Preliminary scoping of the main and minor hydrological changes, and the associated transboundary economic, environmental and social impacts caused by the LMB 20- Year Plan and the LMB 20-Year Plan without Mainstream Dams in the Middle and Lower LMB 6. Preliminary scoping of the main and minor hydrological changes, and the associated transboundary economic, environmental and social impacts of the LMB 20-Year Plan without Mainstream Dams 7. Preliminary scoping of the main and minor hydrological changes, and the associated transboundary economic, environmental and social impacts caused by the Mekong Delta Flood Management 8. Preliminary scoping of the main and minor hydrological changes, and the associated transboundary economic, environmental and social impacts caused by the LMB Long-Term Development 9. Preliminary scoping of the main and minor hydrological changes and the associated transboundary economic, environmental and social impacts of the LMB Very High Development 10. assessment framework (goal, objectives, issues, indicators and data requirements) 11. Assessment of the main economic, social and environmental benefits and costs of the Definite Future for the upper part of the LMB (as identified in Table 4) 12. Assessment of the main economic benefits and costs of the LMB 20-Year Plan by sector and country (a similar table can be prepared for the LMB 20-Year Plan without Mainstream Dams in the Middle and Lower LMB and the LMB 20-Year Plan without Mainstream Dams 13. Employment and livelihoods created by the LMB 20-Year Plan by sector and country (a similar table can be prepared for the LMB 20-Year Plan without Mainstream Dams in the Middle and Lower LMB and the LMB 20-Year Plan without Mainstream Dams) 14. Main trade-off in the LMB 20-Year Plan by sector and country (a similar table can be prepared for the LMB 20-Year Plan without Mainstream Dams in the Middle and Lower LMB and the LMB 20-Year Plan without Mainstream Dams) 15. Investment requirements (million US$) of the LMB 20-Year Plan by sector and country (a similar table can be prepared for the LMB 20-Year Plan i
5 without Mainstream Dams in the Middle and Lower LMB and the LMB 20-Year Plan without Mainstream Dams) 16. Assessment of the main economic and environmental benefits of present water resources use 17. Assessment of the main economic, environmental and social benefits and costs of the Mekong Delta Flood Management 18. Distribution of the assessed economic benefits and costs of the LMB 20-Year Plan for Lao PDR (see Table 5) among segments of society in %. (a similar table can be prepared for other countries and other scenarios for the foreseeable future) 19. Comparison of economic, social and environmental performance of selected scenarios by country 20. Comparison of economic, social and environmental performance of selected scenarios by sector 21. Linkage of assessment criteria with the work packages 22. Proposed work plan 23. Identified data and information needs List of Figures 1. Key elements of the Rolling IWRM-based Basin Development Plan 2. The BDP planning cycle 3. BDP s integration with national processes 4. The approach to formulate scenarios 5. Key monitoring stations along the mainstream and Tonle Sap 6. The Assessment Framework for basin development planning ii
6 Abbreviations and acronyms ANB Annual Net Benefits ANR Annual Net Revenue bcm billion cubic meters BDP2 Basin Development Programme Phase 2 CSIRO Commonwealth Scientific Industrial Research Organization DSF Decision Support Framework EP Environment Programme FMMP Flood Management and Mitigation Programme FP Fisheries Programme GWh Giga Watt hour ha hectares IBFM Integrated Basin Flow Management IKMP Information Knowledge Management Programme IPCC Intergovernmental Panel on Climate Change IWMI International Water Management Institute IWRM Integrated Water Resources Management JC Joint Committee LMB Lower Mekong Basin mcm million cubic meters MRC Mekong River Commission MW Mega Watt NAP Navigation Programme NGO Non-Government Organization NPV Net Present Value PIN Project Identification Note PNPCA Procedures for Notification and Prior Consultation RTWG Regional Technical Working Group SEA Strategic Environmental Assessment SIM Social Impact Monitoring SPCP Stakeholder Participation and Communication Plan UN United Nations USD United States Dollars VA Vulnerability Assessment WUP Water Utilization Programme iii
7 1 BACKGROUND 1.1 Aim of this note The aim of this Technical Note is to describe the agreed approach, scope and work plan for the formulation and assessment of basin-wide development scenarios. Earlier drafts of this note were discussed with the MRC Programmes (3 December 2008) and the Regional Technical Working Group (RTWG) on Basin Development s and Strategy (8-9 December 2008). Moreover, elements of the Note were discussed with other planning partners. The Technical Note will be finalized after the workshop of the RTWG on March 2009 and submitted to the 29th Meeting of the Joint Committee for guidance and endorsement (26-27 March 2009). After finalization of the Note, selected information will be integrated into the BDP2 Report Assessment Framework for the Development of the IWRM-based Basin Development Plan, which will serve as an important reference document throughout the BDP planning cycle. 1.2 Development context While millions of poor people exploit the natural resources of the Mekong Basin for their food security and livelihoods, water infrastructure development is limited compared with most other large river basins in the world. The most downstream part of the Mekong Basin, the Vietnamese Delta, is by far the largest water-using area in the Basin. Currently, water resources development is being accelerated, in particular for the generation of hydro-electric power, driven by markets and the private sector. A range of factors is driving this development: At the global level, fluctuating oil and natural gas prices make hydropower development financially more attractive, and rises in food prices make irrigation more profitable. In addition, global climate changes may affect water demand and availability in the Mekong Basin. At the basin level, increases in the population, the economy and trade are resulting in greater demands for energy and water related commodities and services. Also, the financial attractiveness of run-of-river dams on the mainstream in the Lower Mekong Basin (LMB) is enhanced by the large storage dams that are being constructed on the Lancang in the Upper Mekong Basin (however, the feasibility 1
8 studies need to consider the impact the dams on ecological based resources in the basin, including the large fishery sector). At the national level, the Governments increasingly recognize that developing some of the economic potential of the water resources in the Mekong Basin for hydropower, navigation, irrigation, and flood management can contribute to increased economic growth, poverty alleviation, improve livelihoods, and work towards meeting the UN Millennium Development Goals. 1.3 Objective and scope of basin development planning Given the above described situation, there has been an increasing pressure from the basin countries and project developers for provision of an integrated basin perspective against which national plans and proposed projects can be assessed to ensure an optimal balance between economic, environmental, and social outcomes in the LMB, and mutual benefits to the LMB countries. The development of such a basin perspective is beyond the responsibility of any individual country or project developer. For example, a developer of a particular mainstream dam in the LMB cannot effectively assess the impact of the dam on the basin s capture fisheries, since the impact typically depends on other possible developments, such as a downstream dam. MRC s Basin Development Plan Phase 2 (BDP2) is designed to provide such an integrated basin perspective through the participatory development of a rolling IWRMbased Basin Development Plan (Figure 1 to 3). The plan comprises: Basin-wide Development s, which will provide the information that Governments and other stakeholders need to develop a common understanding of the most acceptable balance between resource development and resource protection in the various parts of the LMB. Each considered scenario represents a specific balance between economic, social and environmental objectives. The results of the economic, environmental and social assessment of the considered scenarios will guide the formulation of the IWRM-based Basin Strategy. IWRM-based Basin Strategy, which provides a shared vision and strategy of how the water and related resources in the LMB could be developed in a sustainable manner for economic growth and poverty reduction, and a coherent and consistent IWRM planning framework that brings basin perspectives into the national planning process, and vice versa. The results will guide the formulation of the Project Portfolio. 2
9 A Project Portfolio of significant water resources development projects and supporting non-structural projects that would require either promotion or strengthened transboundary water governance, as envisioned in the 1995 Mekong Agreement. The preparation of the Plan will bring all existing and planned water and related resources development projects in a joint basin planning process, through a combination of participatory sub-basin and sector activities and a basin-wide integrated assessment approach. The formulation of the Plan will employ appropriate knowledge and tools that will ensure the plan achieves benefits for all countries and the projects comply with sound environmental and socioeconomic principles. It is envisioned that the IWRM-based Basin Development Plan will provide an incentivized framework for a more strategic implementation of the water utilization procedures, developed under the Water Utilization Project (implemented during ). In particular, the early identification of projects that might not comply with the IWRM-based Basin Strategy could provide a role for the MRC to engage in facilitating dialogue on significant projects and add value to project assessment, preparation and implementation, with a view to enhancing the mutual benefits available to the riparian countries and the sustainable management of the river s natural resources. This would provide an integrative platform for the MRC to engage in transboundary assessment and multi-stakeholder consultation to facilitate a broad and informed dialogue on sustainable water resources development and management. 1.4 Participatory process Building on the achievements of BDP1, various participatory and quality assurance mechanisms are put in place to ensure that the main stakeholders are engaged in the planning process and the resulting IWRM-based Basin Development Plan is relevant and of the highest quality. The mechanisms include: Joint activities with most MRC Programmes. A multi-sector Regional Technical Working Group on Basin Development s and Strategy, with representatives of national planning and sector agencies. Periodic consultations with planning partners, including international and scientific organizations, NGOs, and the private sector. 3
10 Engagement of civil society groups and local organizations through workshops in BDP sub-areas. Implementation of a capacity building programme to promote the understanding and acceptance of the results of the scenario assessment. Involvement of planning partners that have specific tools and knowledge to verify modeling results of scenarios. An independent quality assurance panel to provide an independent and multisectoral appraisal of BDP2 outputs and ensure that the basin development planning process and outputs are of the highest quality and tailored to the conditions of the region. The adopted process for the formulation and assessment of development scenarios is consistent with the BDP2 Stakeholder Participation and Communication Plan (SPCP) for Basin Development Planning in the Lower Mekong Basin. It is also consistent with existing best practice guidance on the implementation of a Strategic Environmental Assessment (SEA) and Transboundary Cumulative Environmental Impact Assessment. The purpose is to produce information that supports a basin wide dialogue and national decision-making on the level of development of water and related resources that most likely will achieve an optimal balance between economic, environmental, and social outcomes in the LMB. 4
11 2 SCOPING OF THE FORMULATION OF SCENARIOS 2.1 approach At the basin level, a common vision and strategy needs to be developed that describes how the basin could be developed, based on an agreed acceptable balance between water resources development for economic growth and poverty reduction, on the one hand, and the protection of riverine ecology on which many people rely on for their livelihoods, on the other. Although the concept of IWRM holds the promise of reconciling goals of economic efficiency, social equity and environmental sustainability, the BDP2 faces several pertinent questions, including: How to achieve these goals given that China and Myanmar are not yet involved in collaborative planning, while China is developing very significant hydropower developments in the Upper Mekong Basin? How to achieve these goals in a context where national decisions in many sectors may affect the Basin s water and related resources, while MRC has no direct mandate for economic and social planning at the national level? How to achieve these goals, given that the LMB is a complex system of interdependent elements with a range of water-related sectors, actors and interests? How best to ensure the realization of the goals at the national and sub-basin levels in the LMB, i.e. how to bring basin perspectives into the national planning process? A reasonable way to approach this complexity is to define an agreed development space for water and related resources, within which the LMB countries can plan and work, taking into account the impact of foreseeable developments in the Upper Mekong Basin (China, Myanmar). The 1995 Mekong Agreement is implicitly framed in this way, with its emphasis on maintenance of agreed flows in the mainstream; reasonable and equitable utilization; and recognition of sovereign equality and territorial integrity in the utilization and protection of the water resources. 5
12 The question, then, is how to define the LMB development space for water and related resources in a way that is mutually beneficial to the LMB countries, sustainable from a basin perspective, and practical to implement. There are a few options, including: To set boundaries for acceptable cumulative changes due to development and define the share of that space available to each country and sectors. However, such a rigid and prescriptive definition is most likely not feasible in the complex context of the LMB with four sovereign countries and a high natural year-to-year hydrological variability, which could increase further due to climate change. A more sensible option is to define the LMB development space through a basinwide dialogue of the results of a comprehensive assessment of basin-wide scenarios that represent different levels of water resources development in the Mekong Basin. Each scenario would be formulated to represent different combinations of sectoral development, recognizing the synergies and trade-offs between sectors. 2.2 Purpose of scenarios The main objective of the formulation and assessment of alternative development scenarios is to support the definition of the LMB development space that will be defined in the IWRM-based Basin Strategy. The IWRM-based Basin Strategy will describe how the selected scenario identifies a development space - for example, the part of the Basin s flow regime that the LMB countries agree can be used for development and what might be any limitations on how this development can be used. It will also provide the sectoral guidelines, processes and procedures that water managers could follow in allocating and managing the Basin s water resources. Each scenario would provide a balance (or trade-off) between economic, environmental and social objectives of the MRC member countries. The assessment will appraise (quantify and qualify) how well each scenario would achieve these objectives. After basin-wide consultations on the assessment results, senior Government officials would decide which scenario would provide the most acceptable balance between economic, environmental, and social outcomes in the LMB, and would bring mutual benefits to the LMB countries. The selected scenario will support the definition of the LMB development space. The results of the scenario assessment must be presented in a way that facilities comprehension and suits the needs of the various stakeholder groups. Some 6
13 stakeholders would like to review all data and documentation to better understand the assumptions underlying the ultimate results, while decision makers may want to see only an executive summary with the results shown in self-explanatory maps, tables, graphs and charts. It is noted that in choosing a development scenario, the LMB countries are not committing to a particular set of projects (which are in any case subject to feasibility studies, EIAs etc.), but are identifying a development space within which they can plan and work. Conflicts and trade-offs may occur, but within an agreed vision of an overall outcome, which will be described in the IWRM-based Basin Development Strategy. A subsidiary objective is to provide the MRC member countries by July 2009 with an initial assessment of the trade-off between developing mainstream dams within the LMB and the expected negative impacts on fisheries. This information would feed into the implementation phase of the Strategic Environmental Assessment (SEA) of the proposed LMB mainstream dams, implemented under MRC s Sustainable Hydropower Initiative. 2.3 Scope of scenarios The scope of the development scenarios to be assessed is limited to those with transboundary impacts where trade-offs between sectors will have to be considered when decisions are made on how to use the available development space available to member states. From earlier studies and consultations, the key issues affecting basin-level decision taking are: The trade-off between developing mainstream dams within the LMB and the expected negative impacts on fisheries. The impacts and the development of opportunities emerging from the construction and operation of China dams. The future direction for sustainable development of the Cambodian and Vietnam flood plains. The impacts that climate change may have on basin hydrology and water resource demands and how these may affect and need to be factored into the decision making process. 7
14 The scope of the assessments is to be triple bottom line, i.e. to embrace economic, social and environmental cumulative impacts, at a level of detail that enables decisions to be reached on the key issues within the defined time-frame. The level of detail is also conditioned by the data now readily available (which are considerable) and that the opportunity for further field work is limited to that which is currently in process and due for completion by mid Further studies and field work may continue thereafter, but their results will not be brought into the scenario assessments until after February 2010 when the assessments are being refined. The scope of assessments is expressly not to endorse specific project-level interventions, which will require detailed studies of their own to confirm their individual viability and acceptability. The extent of the assessment is limited to the following potential impact areas: Those areas directly affected by changed hydrological conditions in the mainstream. This is a corridor along the mainstream and up tributaries where backwater affects may occur of a width determined by the dependence of those living within that corridor whose livelihoods are directly affected by hydrological and water quality conditions in the mainstream. The Tonle Sap and adjacent areas and the flood plains in Cambodia and Vietnam. Those areas where there is direct dependence upon capture fisheries as defined by a corridor (overlaid on the above) delineated by the extent of fish migration (defined as the mainstream and significant tributaries up to the point where natural or existing man-made obstructions prevent further migration). Socio-economic benefits that arise, or could arise, outside the above areas will be evaluated only where they are directly linked to development and management of the mainstream (e.g. hydropower generated and irrigation made possible by increased dry season flows) and where they are relevant to the trade-offs under consideration. Since the precise locations where these benefits may arise will not be known, no attempt will be made to make environmental assessment of these unless it can be reasonably shown that their cumulative impacts might have an impact on mainstream water quality (e.g. from use of agricultural fertilisers and pesticides). It is recognized that basin planning will not stop in February As such it is vital that the data compiled for and during the assessments is quality assured and entered onto the IKMP MRCS-IS and/or knowledge base. This will facilitate such further assessments as may be required in 2010 and to underpin updates of the IWRM-based Basin 8
15 Development Plan under future editions of the rolling plan. The work plans are therefore proposed in a manner that prioritises the establishment of the necessary information platform (in parallel to the priority assessment of mainstream dams). 2.4 Scoping of scenario formulation A development scenario in BDP2 context is defined as a hypothetical combination of possible changes in hydrological condition and/or multi-sector water demands and/or proposed interventions, describing a plausible future situation. Accordingly, the scenarios need to cover the following components: projected time horizon, hydrological conditions, and water demands and associated interventions, as described below. Projected time horizon Previous studies demonstrate that it is important for planning purposes to distinguish between the following future situations: Baseline situation, which represents the development conditions (physical and management characteristics) that existed in the year 2000 and the hydrometeorological conditions of At the basin scale, these hydrometeorological conditions still represent the natural situation, since there is as yet (2008) no statistical evidence of man-induced or climate-induced change to the hydrological regime of the Mekong mainstream. Definite future situation, which includes the water resources developments that will be fixed parts of the Mekong system in a few years from now, such as the planned dams in the Upper Mekong Basin, as well as water developments (eg hydropower and irrigation) that are being constructed in the LMB. The development conditions of the baseline situation will be updated accordingly. IKMP is working with the LMB countries to update the hydro-meteorological conditions through 2007/2008. Foreseeable future situation, which represents the development conditions that could become a reality during the next 20 years. The economic, environmental and social impacts of possible water resources developments in the LMB over and above the definite future situation is in particular relevant to decision-making on the development space for water and related resources in the LMB. Long-term future, which represents development conditions in the Mekong Basin that are plausible (or at least not implausible) in 50 years from now. Given the large 9
16 uncertainties in the formulation and assessment of long-term scenarios, they will be used to explore the potential of the Mekong Basin. Future hydrological conditions In addition to man-induced water resources development, the hydrological regime of the Mekong mainstream could change during the coming decades as a result of climate change or continuing land use changes. Initial assessments by CSIRO 1 of the hydrological consequences of climate change studies suggest significant changes in the mainstream hydrological regime, specifically in the longer term (2030 and beyond). Rainfall and stream flow could increase by some 20%, in particular in the wet season, increasing the likelihoods of major floods. Given this situation, the scenarios for the foreseeable future and the longer term will be assessed for situations without and with climate change to analyze the impact of climate change on water availability and water resources development. For the situation without climate change, historical data from the period will be used to represent future climate conditions 2. For the situation with climate change, global climate change scenarios of Intergovernmental Panel on Climate Change (IPCC) 3 will be used to derive possible climate conditions for the Mekong Basin in the next 50 years 4. Despite major changes in forest cover and land use in the LMB countries, there is no statistical evidence that the hydrological regime of the Mekong mainstream has changed. The impact of land use changes on the flow of the Mekong mainstream is complex. More research is needed to improve the understanding of the detailed rainfallrunoff relationships in the various tributary basins. 1 Mekong River Basin Water Resources Assessment: Impact of Climate Change, CSIRO, August The MRC countries are working with MRC IKMP to update the hydro-meteorological data in the DSF up to 2007/ A Special Report of IPCC Working Group III, Emissions s, Intergovernmental Panel on Climate Change, Currently, the impact of global climate change on the Mekong Basin is being studied under MRC s Environment Programme (EP). BDP will collaborate with EP to assess formulated water resources development scenarios for conditions with climate change. 10
17 Future multi-sector water demands and associated interventions All eight water related sectors shown in the textbox will be considered in scenario formulation and assessment of the basin-wide development scenarios. The main sectors considered for scenario formulation are those that can significantly change the hydrological regime of the river, such as water supplies, irrigation, hydropower, and flood control. Other (passive) water-using sectors such as fisheries, tourism, navigation and the environment will be considered in the assessment of the scenarios. The possible future water demands and associated infrastructure interventions will be derived from available sub-area and sector reports, and still ongoing sector work by specialists from the responsible line agencies and MRC Programmes. The BDP2 led sector work has resulted in comprehensive hydropower and irrigation databases, which compile the technical, economic and operational data of present, planned and potential projects. For the formulation of the development scenarios, relevant data will be used of individual hydropower and flood management projects. The relevant data of the agricultural and domestic and industrial water supply sectors will be aggregated at the sub-tributary basin level 5 and then used for the formulation of the scenarios. Since the scenario assessment is concerned with the impacts on the mainstream, no added value can be created by modeling the many projects in these Sectors considered Active sectors Water supplies (domestic and industrial uses) Irrigated agriculture Hydropower Flood management and mitigation Passive sectors Fisheries Navigation and river works Tourism and recreation (water-related) Environment, including water 5 Primary tributary rivers discharge directly into the main Mekong mainstream; secondary tributary rivers discharge directly into a primary tributary river. The basin of a secondary tributary river is in this document referred to as sub-tributary basin. 11
18 sectors individually (the BDP2 irrigation database contains more than 13,000 existing, planned and potential irrigation projects). Principles considered The following key principles derived from other scenario studies have guided the definition of the basin-wide development scenarios: The number of scenarios must be restricted to the minimum necessary to permit coverage of reasonably possible future developments in the Basin. There is no point in defining a large number of scenarios, each slightly different from the others. Too many scenarios lead to scenario fatigue by providing more information to policy makers and their advisors than they can absorb. A reasonably possible scenario is a plausible scenario, or at least not implausible. However, scenarios that are low in probability but high in consequences could be of interest to the Mekong Basin. Such scenarios are considered in the longer term scenarios. With projection into the future, error rate of scenarios grows rapidly. Long-term scenarios (say more than 20 years) are typically totally off. Therefore, the economic, social and environmental impact of longer-term scenarios will be described (not assessed), based on the results of the assessment of their hydrological impact. 2.5 Defined scenarios In consultation with the RTWG, the scenarios are classified in a baseline scenario, definite future scenarios, scenarios for the foreseeable future (a twenty-year LMB plan scenario and alternative development scenarios), and longer term scenarios that explore the basin s potential. In August 2008 the JC has approved the scenario classification in principle. The 4 th meeting of the RTWG agreed with the defined nine alternative basin-wide development scenarios, which are classified in four situations as shown in the table below. 12
19 Baseline Definite future Foreseeable future situation Longer-term future situation situation 1. Baseline line scenario 2. Chinese Dam 3. Definite Future 4. LMB 20-Year Plan 5. LMB 20-Year Plan without Mainstream Dams 6. LMB 20-Year Plan without Mainstream Dams in the Middle and Lower LMB 8. LMB Long-term Development 9. LMB Very High Development 7. Mekong Delta Flood Management The following provides a description of each defined scenario, including the main purpose. A. Baseline Situation 1) Baseline represents the development conditions (physical and management characteristics) that existed in the basin in the year Physical conditions include climate; land use; public and industrial water demand; irrigated areas, cropping patterns, and delivery infrastructure; storage characteristics (location, size, shape and outlet structures); and hydraulic conveyance and flood storage. Management conditions include operating rule curves for storages; water allocation policies; and operating rules for salinity barriers. At the basin scale, the baseline still represents the natural situation, since there is as yet no statistical evidence of man or climate induced change to the hydrological regime of the Mekong mainstream. The baseline scenario will be used as a reference scenario with which the hydrological changes caused by the other scenarios can be compared. 6 The Baseline will be updated later in BDP2 has collected the data and information regarding future water demands and interventions. The hydro-meteorological data is being updated through 2007/2008 by the MRC member countries and IKMP. 13
20 B. Definite Future Situation 2) Chinese Dam, which comprises the baseline scenario, plus the hydropower cascade that is being developed on the Lancang in the Upper Mekong Basin, including the large storage projects Xiaowan and the Nuozhadu, with 9,800 and 12,400 million m3 of active storage, respectively, which are likely to cause the most significant seasonal redistribution of flow of any of the foreseeable water resources developments in the basin. The main purpose of this scenario is to assess the impact of the Chinese dams on the Lower Mekong Basin (LMB). 3) Definite Future, which comprises the Chinese Dam, plus the significant water resources developments on the LMB tributaries that have been constructed since 2000 or are being constructed (such as Nam Theun 2, Nam Ngum 2 hydropower projects, and several irrigation projects). Like the hydropower cascade on the Lancing, these projects will be fixed parts of the Mekong system in several years from now. Therefore this scenario should be considered as a definite future situation for LMB planning purposes. The main purpose of this scenario is to: 1) assess the impact over and above the Baseline and 2) provide an updated baseline against which possible future scenarios for the LMB can be assessed. C. Foreseeable Future Situation (20 years) C1 National Perspectives 4) LMB 20-Year Plan, which comprises the definite Future, plus the current development plans of the LMB countries for the next two decades, including the currently studied 11 dams on the mainstream in Lao PDR and Cambodia, realistic diversions from the mainstream to Northeast Thailand, considerable increases in irrigation, in particular in Cambodia and Lao PDR, and other developments that are planned for implementation during the coming 20 years in the various BDP sub-areas, including flood management and mitigation, and domestic and industrial water supply. The main purpose of this scenario is to assess the impact of the currently planned water resources development over and above the Baseline and the Definite Future. 14
21 C2 Alternative Perspectives 5) LMB 20-Year Plan without Mainstream Dams, which comprises the current water resources development plans of the LMB countries for the next two decades (as formulated in the LMB 20-Year Plan ), except for the currently studied 11 dams on the mainstream, which would block migratory fish. The main purpose of this scenario is to assess the impact of the planned water resources developments without the mainstream dams over and above the Baseline and Definite Future, and compare the results with the LMB 20-Year Plan. 6) LMB 20-Year Plan without Mainstream Dams in the Middle and Lower LMB, which will include the current water resources development plans of the LMB countries for the next two decades (as formulated in the LMB 20-Year Plan ), except for the currently studied mainstream dams downstream of Vientiane/Nong Khai. The main purpose of this scenario is to assess the economic and social impacts of predicted declines in migratory fish yield, which could be significantly lower than in the LMB 20-Year Plan. 7) Mekong Delta Flood Management, which is similar to the LMB 20- Year Plan but includes additional flood risk reduction and drainage measures in the Mekong Delta. In the Vietnam Delta, technical and operational measures would control flooding of the annually deep flooded areas beyond the early floods and mitigate the increase in damaging flood frequencies that are being predicted due to climate change (see below). Flood management measures for the Cambodian Delta would be implemented to protect the shallow flooded areas throughout the wet season and deep flooded areas against early floods only, allowing the safe harvest of a second crop. The (transboundary) impact of the loss of flood storage capacity could be mitigated by the diversion of flood waters in the border zone towards the Gulf of Thailand and/or the Vam Co River according to recent studies by a consultant consortium for MRC FMMP Component 2: Structural Measures and Flood Proofing. The main purpose of this scenario is to study the transboundary impact of regional flood management options in the Mekong Delta. The scenario comprises several sub-scenarios, which will be assessed with support of the MRC FMMP Component 2. D. Longer-Term Future (50 years) 8) LMB Long-Term Development, which represents a plausible continuation of currently planned water resources development, as defined in the scenarios for the foreseeable future, including likely feasible hydropower developments (based on the economic screening of the projects in the MRC/BDP 15
22 hydropower database), likely feasible irrigation developments (based on the screening of projects in the MRC/BDP irrigation database), likely increases in other water demands, linked to increasing population and economic activities. The main purpose of this scenario is to examine the longer term hydrological changes of the continued development of plausible levels of water resources development, such as changes in sediment and nutrient transport, and changes in water quality. 9) LMB Very High Development, which comprises the LMB 20-Year Plan, plus full potential development of water supply, irrigated agriculture, hydropower and flood management sectors in the LMB countries. This would include, for example, significant diversions from the mainstream in the upper part of the LMB, a controlled diversion of early flood waters to the Tonle Sap Great Lake, supplemented with works to regulate the outflow of the Great Lake and adjacent flood plains to improve low flow conditions in the Mekong Delta. The main purpose of this scenario is to explore the impact of very high levels of basin development on: 1) the Tonle Sap flow reversal system, 2) the dry season flows, 3) salinity intrusion in the Mekong Delta, and 4) sediment transport and the associated implications for nutrient transport, bank erosion and coastal erosion. The results of the modeled flow changes will be compared with the Definite Future. The economic, environmental and social impacts will be described. In parallel, full potential sector scenarios will be modeled individually to explore the contribution of each sector to the assessment results of the LMB Very High Development. The approach to the formulation of the scenarios is summarized in Figure 4. The scenario components are summarized in Table 1. The data needed to populate the scenarios for modeling with the Decision Support Framework (DSF) are available with IKMP and BDP2. Table 2 provides an example of how the main input data of the considered scenarios can be summarized for use as background information to a discussion of the results of the scenario assessment. These tables will be reviewed and refined as the assessment proceeds. 16
23 3 SCOPING OF THE ASSESSMENT OF SCENARIOS 3.1 Assessment approach Previous MRC studies indicate that the most effective approach is to first assess the considered basin-wide development scenarios on a range of direct hydrological indicators (flow and level changes at different locations at various times of the year) and indirect hydrological indicators (changes in sediment transport and water quality). Section 3.2 provides the scoping of the hydrological assessment. A summary of the results of the preliminary hydrological assessment of some of the defined scenarios is given in Section 3.3. In addition, transboundary impacts of scenarios will be assessed which are not driven by hydrological changes. In particular, the barrier effect of dams on migratory fish could result in significant decreases in capture fisheries production and possibly changes in habitats, such as wetlands. Section 3.4 summarizes the preliminary findings of a recent expert analysis of the risks to the capture fisheries production of mainstream dam development. The nature and level of the changes in hydrology and capture fisheries production will drive the scoping of the economic, environmental and social impact assessment of the development scenarios. To determine how well each scenario would achieve national and regional development objectives, a set of policy relevant and measurable assessment criteria has been defined (see Section 3.5). Section 3.6 provides the scoping of the economic, environmental and social assessment of the considered scenarios. Figure 6 provides a flow chart of the scenario assessment process in the context of the development of the rolling IWRM-based Basin Development Plan. 3.2 Scoping of the hydrological assessment Several previous MRC studies and peer reviews demonstrate that the simulation models of the DSF are proven tools to provide a basin-scale picture of the flow changes caused by development scenarios, rather than to describe in detail the impacts of any single project. The hydrological changes of all nine considered development scenarios will be assessed. The scenarios for the foreseeable future and longer term will be assessed for situations without and with climate change, as described in Section
24 The hydrological assessment will use similar impact indicators as have been previously used to show the flow and water level changes at different locations at various times of the year. These locations would coincide with existing monitoring stations (Figure 5). The hydrological impact indicators comprise: Changes in flow and water level at 12 monitoring stations on the mainstream and Tonle Sap: Average seasonal flow and water level; Average monthly flow and water level; Daily flow and water level duration curves; Annual average minimum and maximum daily flow and water levels; Flow volumes during wet, dry and average years; Reverse flow to Tonle Sap at Prek Kdam; Water levels in the Tonle Sap Lake. Changes in the floodplain of Tonle Sap and Mekong Delta (> 0.5 m water depth) Flood inundation area; Flood duration; Flood volume; Flood timing. Changes in salinity intrusion in the Vietnam Delta (concentration > 4 g/l, duration > 10 days) Salinity intrusion areal extent; thresholds; Salinity intrusion duration; Salinity intrusion concentration. Other hydrology-related changes Sediment transport; Water quality. The other hydrology-related changes caused by the considered scenarios will assessed by expert analysis, using available data and specific models, as needed. In the medium term, when the DSF is upgraded and sufficient data are available from improved monitoring programmes, quantitative assessments can be made by using the DSF. 18
25 A preliminary schedule of the hydrological assessments required is given in Table 3, noting that this list may be extended if other combinations of circumstances may prove worthwhile to investigate. 3.3 Preliminary results of the hydrological assessment During the period July-September 2008 a preliminary hydrological assessment was made of some scenarios for the definite and foreseeable future, with a view to: 1) informing the Regional Multi-Stakeholder Consultation on September 2008 and 2) supporting the scoping of the transboundary economic, social and environmental assessment of the considered development scenarios. The assessments were carried out by MRCS specialists drawn from the IKMP modeling team and BDP2. National modeling specialists validated the input data and the modeling results 7. In parallel, FMMP modeled various flood management scenarios to investigate the options to reduce flood risks in the Mekong Delta 8. A presentation of the main results is available on the MRC website 9. The results of the preliminary hydrological assessment of the scenarios are summarized in the first column of Tables 4 to 9. Wherever appropriate a distinction is made between the main and minor hydrological changes caused by a specific scenario. This distinction is preliminary and will be reviewed, refined and described as the assessment proceeds. The following overall and preliminary conclusions can be drawn from the tables: In the foreseeable future the main flow changes in the LMB would be caused by the large storage projects that are being developed on the Lancang in China (Chinese Dam and Definite Future ). These developments, if constructed and operated in accordance with their current preliminary designs, would very significantly increase the dry season mainstream flows in the northern parts of Thailand and Lao PDR, and could have a mitigating effect on floods that arrive early 7 Results of Fast-Tracked Basin-Wide Water Resources Development s, Internal Technical Note; 1 December The Flood Management and Mitigation Program, Component 2: Structural Measures and Flood Proofing, Draft Stage 1 Evaluation Report; August tation%20presentation%20(final%2025%20sep%2008).pdf). 19
26 in the wet season when the storage reservoirs are being filled. These scenarios could also significantly reduce sediment transport in the mainstream in the upper part of the LMB. The various considered LMB scenarios for the foreseeable future (such as the LMB 20-Year Plan ) would result in relatively small flow changes in the mainstream over and above the changes caused by the developments on the Lancang and developments that are under construction in the LMB (Definite Future ). The calculated changes in the defined impact indicators for changes in flow, floodplain and salinity intrusion (see Section 3.2) constitute a fraction of the historically observed natural year-to-year variability. The long-term scenarios, and in particular the LMB Very High Development, would cause large changes of the flow and levels in the mainstream, as well as changes in sediment transport, water quality, the working of the Tonle Sap, and flooding and salinity intrusion in the delta. The long-term development scenarios include some water resources developments that may help combat the possibly large increases in the size and frequency of floods caused by climate change. It is expected that the main impact of the LMB scenarios for the foreseeable future will not be driven by changes in hydrology but by the barrier effect of dams on fish migration. In particular the mainstream dams in the lower and middle sections of the LMB may cause a significant reduction of migratory fish production. The barrier effect of Khone Falls and the proposed mainstream dams is being studied by the MRC FP and WorldFish. The preliminary results will be available in April IKMP is leading the preliminary assessment of the impact of the considered scenarios on sediment and nutrient transport, with an emphasis on sediment trapping by dams. If not managed, sediment trapping by dams will reduce the life of the dam and reservoir, and could cause significant adverse downstream impacts (erosion of river bed and banks, slope tilt). Experiences from elsewhere indicate that sediment management strategies exist at the dam design and operational stages to minimize sediment trapping behind the dam and maintain the seasonal distribution of sediment transport. Adequate sediment management is essential for the proposed mainstream dams in the LMB. The mean annual suspended sediment load in the mainstream is million tons: the same order of magnitude as the volume of the reservoirs behind most of the proposed LMB mainstream dams. It has been assumed in Table 5 and 6 that the mainstream dams will be designed, constructed and operated to minimize sediment trapping to prevent the early filling of the reservoir and the associated economic losses 20
27 and potential structural failure of the dam. There is a need for improved sediment monitoring. The impact of the considered scenarios on water quality will be assessed in collaboration with MRC s EP. The predicted increases in irrigated agriculture in the foreseeable future (20 years) may not lead to diffuse pollution levels (nitrates, phosphates) in most of the mainstream above international standards for the protection of aquatic life and agricultural use. Locally along the mainstream, the level of diffuse pollution could rise above proposed thresholds during the dry season. This could occur downstream of inflowing tributaries that drain sub-basins with large irrigated areas and in the Vietnam Delta, due to a high population density and intensive agriculture. Increased impacts of point sources of pollution need to be regulated by water use licenses and enforced by the resource management agencies. 3.4 Blockage of migratory fish by dams Millions of people in the Mekong Basin depend on the world-largest inland fisheries for their food security and livelihood. The total fish consumption is estimated at 2.5 million tons per year and valued at US$ 3 billion/year. Dam construction, in particular on the mainstream, could block migration routes and reduce migratory fish populations that provide 70% of the above value. The MRC Fisheries Programme is studying the impact of dams on fish populations. Activities include the identification of spawning sites; fisheries impact assessment, forecasting and mitigation; the assessment of appropriate mitigation measures; and periodic meetings of experts from around the world on fisheries ecology and hydropower development. The first independent expert group meeting on the barrier effect of mainstream dams to fish migration in the Mekong Basin was organized on September The conclusions of the meeting are available on the MRC website. They can be summarized as follows: The impact of the barrier effect of dams on the mainstream is greater than the impact of dams on tributaries. Dams that stop fish migration in the middle and lower LMB will have a greater impact on capture fisheries production than dams in the upper LMB. Existing fish passage facilities cannot cope with the large migratory fish biomass and high species biodiversity as found in the Mekong. New passage facilities, tailored to 21
28 the specific conditions in the Mekong, would need to be developed and tested. The technical and economic feasibility of appropriate fish passage facilities is doubtful. If feasible, the fish passage facilities need to be integrated into the dam design from the start. Existing feasibility studies of mainstream dams indicate that appropriate fish pass facilities are not considered yet. Aquaculture, including reservoir fisheries, cannot compensate for declines in capture fisheries production. Based on existing data and information, the FP and WorldFish are currently modeling the decline in migratory fish production, which would likely be caused by the defined scenarios for the foreseeable future that include mainstream dams in the LMB. In the process, they are considering the feasibility of mitigating measures and the adaptability of fish species to new environments. Preliminary results indicate that the migratory fish production at risk from mainstream dams is in the range of million tons per year, depending on the number and location of the dams and other factors, such as the barrier effect of Khone Falls on some migratory fish species. Such large potential decline in fish yield migration will have very significant basin-wide economic and social impacts, which need to be assessed. The economic and social impact assessment of predicted declines in migratory fish production should also consider the adaptability of fish species to new environments and the potential future increases in aquaculture, including reservoir and irrigation field fisheries. This assessment will be carried out using existing data and the results of the recently started field work on Social Impact Monitoring (SIM) and Vulnerability Assessment (VA). The VA will also look into the consequences for poverty reduction and food security of the predicted considerable increases in irrigated agriculture, including Northeast Thailand. 3.5 Scoping of broader assessment criteria Working Group 2 of the WUP has conducted useful research on the characteristics of good assessment criteria. Subsequently, many different hydrological, environmental, social, and economic indicators have been defined and tested for specific purposes under WUP scenario modeling studies and related Integrated Basin Flow Management (IBFM) studies. 22
29 The review of this knowledge base of research and practical application experience, and subsequent discussions with the RTWG, suggests that good criteria for the assessment of the considered development scenarios comply with the following characteristics: The assessment criteria must be policy relevant, which also implies that they should be clearly related to a specific development objective, as can be derived from the 1995 Mekong Agreement and national socio-economic and sector plans. The assessment criteria must be user driven, which implies that they are easy to understand by decision-makers and the public at large. Moreover, the number of criteria must be kept to a minimum to facilitate the presentation and comparison of considered development scenarios. The assessment criteria must be sensitive to changes caused by water and land resources developments. The assessment criteria must be measurable and attainable, i.e. the value of the indicator can be determined with confidence and within acceptable limits of uncertainty, using internationally proven methods, and within a short time frame using readily available data The assessment criteria must not duplicate each other. The assessment criteria must be acceptable to each of the four LMB countries. The BDP2 has drawn on the vast amount of research and practical application experience that is available with the MRC and its member countries to select appropriate assessment criteria. The proposed criteria are given in Table 10. The table builds on and refines a series of drafts prepared earlier in consultation with the RTWG and MRC Programmes. It also incorporates the recommendations of the 28 th meeting of the Joint Committee. The assessment criteria provided in Table 10 comprise: The goal and primary objectives. They are based on MRC s aspiration under the 1995 Mekong Agreement for economic and social development of the LMB through cooperation and protection of the natural environment. Together with shared benefits and a goal for optimal development, these represent the primary objectives of economic development, environmental protection, and social development. Specific objectives. The main objectives above are articulated through 13 specific objectives, which, in the context of river basin planning, are considered necessary to 23
30 achieve in order to attain the main objectives. Each specific objective is further translated into a number of basin-level strategic issues to which measurable indicators can be applied. The specific objectives are derived from national policies, strategies and sector plans, the MRC Strategic Plan , and the Strategic Directions for IWRM in the LMB. Measurable indictors. The chosen indicators enable the measurement of how well a specific objective is met by a particular development scenario. Table 10 shows that the assessment criteria cover the triple bottom line of economically beneficial, socially just, and environmentally sound development. They also cover two criteria that can measure how well each scenario achieves equitable development. The criteria were approved in principle by the JC in August The measurable indicators of the specific objectives are as much as possible expressed in the same unit to facilitate a meaningful analysis of the balance between economic, environmental and social outcomes of each scenario. The units chosen will also facilitate the comparison of scenarios for decision-making on the preferred scenario(s). Not all indicators are relevant to the assessment of each scenario, since in some cases the assessments are set up to investigate specific issues. Table 10 therefore identifies which indicators are to be used for each work packages described in the next Chapter. In addition, Table 10 identifies the key data sets and information required to assess the indicators given for each of the specific objectives. It is recognised that some data are available in more detail than others and that the level of analysis may need to vary. An estimate of the likely means of evaluation for each indicator is given, categorised as: (3) can be calculated with reasonable detail, (2) outline quantification only, and (1) cannot be quantified, expert judgment needed. A summary of data requirements is given in Chapter 4. Where indicators require expert opinion to evaluate and where these are considered as potentially significant for future planning, the indicator is labeled R implying that further research appears merited. A discussion of these is given in Chapter Scoping of the economic, social and environmental impact assessment In Tables 4 to 9 the transboundary economic, social and environmental impacts of the considered basin-wide development scenarios are identified, based on the results of the preliminary hydrological assessment (Section 3.3) and the ongoing modeling of the effect of dams on fish migration (Section 3.4). The various identified impacts have been 24
31 linked to appropriate assessment indicators derived from Table 10. Tables 4 to 9 will be reviewed and refined as the scenario assessment proceeds; judgments of what are main and minor changes or impacts will be described. The preliminary tables show that the transboundary economic, social and environmental impacts caused by the considered scenarios fall into two categories: 1) Main transboundary impacts, which comprise the positive and negative impacts that are caused by significant changes in hydrology or blockage of migratory fish by mainstream dams. The impacts suggest that each scenario for the foreseeable and longer term future constitutes a clear trade-off between the anticipated economic and social benefits in one or more economic sectors (hydropower, irrigation etc.), on the one hand, and the anticipated economic, environmental or social costs of changes in specific natural (biophysical) resources, on the other. 2) Other transboundary impacts, which comprise the positive and negative impacts that are caused by minor hydrological changes in specific areas. These impacts will be difficult to assess separately from of the larger impacts caused by the natural year-to-year flow variability and the impacts of climate change. The assessment of these impacts requires applied research, which will take time. Thus, it is difficult to see how the assessment of these impacts can influence decision-making on water resources development in the near term. The assessment of some of the other transboundary impacts identified in Tables 4 to 9 cannot be based on a direct relation between the results of the hydrological assessment and their possible economic, environmental and social implications. It would require the assessment of chains of inter-related impact indicators, as pioneered in the IBFM process by the MRC s EP and WUP during the period The IBFM process provides a critical link between the modeled hydrological changes and the assessment of economic, social and environmental indicators. In the remainder of this Section, the main economic, environmental and social impacts of the nine considered development scenarios are summarized, based on the identification of the main transboundary impacts in Tables 4 to 9. The economic, environmental and social assessment of the considered development scenarios will focus on the appraisal of these impacts, using the appropriate indicators listed in Table 10 and summarized in Table 4 to 9. The Chinese Dam and the Definite Future could create flood protection benefits and potential irrigated agricultural benefits in the LMB. The flood protection benefits are confined to the northern parts of Thailand and Lao PDR; they can be further enhanced by suitable agreements with China. On the downside, the scenarios 25
32 could create economic and environmental costs related to bank erosion in the northern parts of Thailand and Lao PDR (see Table 4). Since these scenarios will be a reality in few years from now, there is no point in formulating a trade-off between economic, environmental and social benefits and costs. However, it is useful to assess the main impacts of the Definite Future on the mainstream in the LMB, with a view to: 1) assessing the benefits and costs and 2) providing another baseline situation against which LMB scenarios can be assessed. The assessment results can be presented as shown in Table 11. The LMB 20-Year Plan and the alternative perspectives (the LMB 20-Year Plan without Mainstream Dams and the LMB 20-Year Plan without Mainstream Dams in the Middle and Lower LMB) would create significant economic and social benefits in the hydropower and irrigation sectors in all four LMB countries. On the other hand, the scenarios could result in significant economic and social costs caused by declines in migratory fish production (see Tables 5 and 6). Consequently, each of the three scenarios provides a clear trade-off between: Increased economic and social benefits created in the hydropower and irrigated agricultural sectors, and Foregone economic and social benefits in the fishery sector as a result of predicted declines in migratory fish yield. Consideration of navigation and garden irrigation along mainstream banks will be considered to the extent that this will demonstrate that these are not critical to decisionmaking. The assessment of the foregone benefits will be based on the preliminary results of the assessment of the decline in migratory fish production (see Section 3.4). The assessment of the increased economic benefits can be assessed using the improved hydropower and irrigation databases (see Section 2.4). The required social data is being assembled (see also Section 4.6). It is expected that during the scenario assessment research issues could be identified where it appears that there is insufficient data or no proven methods available to permit quantification of all relevant assessment indicators. The results of the assessment of this trade-off can be presented for each of the three scenarios as shown in Tables 12 and 13, and summarized as shown in Table 14. The assessment could also include a distributional analysis of benefits and costs among population groups in each of the two countries (Table 18). The proposed tables with assessment information will be reviewed and refined as the scenario assessment proceeds. 26
33 Different scenarios can be compared and evaluated by country and sector as shown in 19 and 20. It can be expected that the benefits of the scenarios will not be equally distributed among the LMB countries. To support the discussion on the results of the scenario assessment, supporting information will be provided on: 1) the investment requirements of the scenarios in each of the countries (see Table 15) and 2) the benefits from current water use by each of the countries (see Table 16). The Mekong Delta Flood Management could create significant economic and social benefits in both the Vietnam Delta and the Cambodian Delta. The possible negative transboundary impact of this scenario can be likely mitigated (see Table 7). The main trade-off in this scenario is between: Increased economic and social benefits of reduced levels of flood risk reduction in terms of improvement of agricultural production and other economic activities, reduction of damage to infrastructure, and the reduction of loss of life (people and livestock), on the one hand, and The costs of flood protection measures and the forgone benefits in the agricultural and environmental sectors, including natural soil fertilization, flushing of acid and pollutants, pest control, reductions in capture fisheries and wetland productivity, on the other. This trade-off needs to be assessed for several sub-scenarios which will include different levels of impoundment of the floodplain. By also considering climate change impacts, a holistic approach to long-term floodplain management will be established within which potential significant infrastructural projects will be considered. The results can be presented as shown in Table 17. The assessment could also include a distributional analysis of benefits and costs among population groups in each of the two countries (Table 18). Different scenarios can be compared and evaluated by country and sector as shown in Table 19 and 20. The proposed tables with assessment results will be reviewed and refined as the scenario assessment proceeds. The LMB Long-Term Development and the LMB Very High Development could create basin-wide large positive and negative economic, social and environmental impacts. The main trade-off in these scenarios is between: Increased economic and social benefits created in the economic sectors (e.g. hydropower, agriculture, navigation, domestic and industrial water supply), on the one hand, and 27
34 Various economic, environmental and social costs related to: 1) changes in the habitats and beneficial use of a variety of water-related flora and fauna species, including fish and 2) channel effects, including river bed, river bank, and coastal erosion, leading significant changes in the river and coastal geomorphology, on the other. The various benefits and costs in this trade-off will be described, based on the results of the assessment of their hydrological impact (see Section 2.3). 28
35 4 IMPLEMENTATION OF THE SCENARIO ASSESSMENT 4.1 Two-track approach Given the analysis in Section 3.6, the following approach to the assessment of the considered nine basin-wide development scenarios seems reasonable: 1) Priority assessment activities: assessment of the identified main impacts of the Definite Future and the appraisal of the identified trade-off in the remaining scenarios. The preliminary assessment of the LMB 20-Year Plan, the LMB 20-Year Plan without Mainstream Dams and the LMB 20-Year Plan without Mainstream Dams in the Middle and Lower LMB, needs to be completed by mid 2009 and finalized by February 2010 to: 1) inform the preparation of the IWRM-based Basin Strategy, 2) Phase 2 of the Strategic Environmental Assessment (SEA) of the LMB mainstream dams, and 3) possible near-term decision making on the large water resources developments in the LMB, such as mainstream dams. 2) Research activities: assessment of the transboundary economic, social and environmental impacts that are associated with the minor hydrological changes indentified in Tables 4 to 10, which requires research and a longer time frame to assess. Although the results will likely not influence decision-making in the near term, there is merit for MRC as a knowledge-based organization to engage in applied research on some of the identified issues, which could be relevant to the management of significant water resources developments and to longer-term decision-making on basin development. 4.2 Priority assessment activities In accordance with the above approach, and the analysis in Chapter 3, the following assessment activities need to be implemented immediately and largely completed by the end of The activities are grouped in 7 packages of work (A1 and B1 through B6), as follows: A. Assessment of hydrological changes 29
36 A1. The hydrological changes of the considered water resources development scenarios will be assessed to confirm and improve the results of the preliminary hydrological assessment conducted in The scenarios for the foreseeable future and the longer-term will be assessed for situations with and without climate change. B. Assessment of the main economic, environmental and social impacts B1. The available economic, environmental and social baseline information will be reviewed and improved as necessary and appropriate to support the assessment of the considered development scenarios. B2. Assessment of the defined trade-off between the hydropower and irrigation sectors, on the one hand, and the fisheries sector, on the other in the LMB 20- Year Plan and alternative perspectives (the LMB 20-Year Plan without Mainstream Dams in the Middle and Lower LMB, and the LMB 20-Year Plan without Mainstream Dams). B3. Assessment of the identified significant economic, environmental and social impacts caused by the Definite Future. B4. Assessment of the defined trade-off in various sub-scenarios of the Mekong Delta Flood Management between increased economic and social benefits of reduced levels of flood risk reduction, on the one hand, and the costs of flood protection measures and the forgone benefits in the agricultural and environmental sectors, on the other. B5. The description of the economic, social and environmental impacts of the scenarios for the longer term, conducted in two stages: an initial report in July 2009 (B5a) and a detailed report (B5b) in February B6. Delivery of a triple bottom line assessment of the considered scenarios, the comparison of the scenarios by country and sector, and a description of the options for discussion and decision-making. The main assessment criteria that will be used in each of the work packages are identified in Table 21. The table is based on the scenario assessment framework described in Section 3.5 and Table
37 4.3 Work plan The proposed work plan conforms to the overall timetabling requirements established by MRC: to make a preliminary assessment of the trade-off between mainstream dams and fisheries by July 2009 and to complete and present an overall assessment for MRC consideration by February The build-up of the work plan takes into account the following further significant considerations, which are illustrated below and in Figure 21 at the end of this report. Flow chart for main components of the work plan for scenario assessment Completed Ongoing Further planned for 2009 Beyond February 2010 Identification of key issues Definition of scenarios to be tested Establishment of assessment framework Assembly of planning data sets A.1 and B.1 Research programmes IKMP databases Fast-track analysis (scoping hydrological impacts) Priority assessments B2 and B5a Detailed assessments B3, B4 and B5b Stakeholder consultations Draft final assessments B6 Future assessments The assessment process is structured around investigating the key issues independently (Work Packages B2, B3 and B4) to ensure a clear understanding of what will underpin the key decisions to be made in due course. In parallel, an assessment will be made of the medium and long term overall development potential (B5), split into two phases: a preliminary assessment with immediately available data (B5a) followed by a more thorough analysis (once all data sets are in place (B5b). The results from B5a may prompt identification of particular issues that require more detailed investigation as a result of their apparent relevance to decision-taking. The final assessment (B6) will draw together all of the foregoing in a concise overview of the strategic choices available to the MRC member states. 31
38 The preparation and quality assurance of the many data sets required for the assessment should be treated as work packages in themselves to: 1) ensure that the basic information is transparently assembled and placed in the IKMP database, and is readily available for all experts to use, and 2) ensure consistency of all data used in the assessments and to preserve the data platform for future use by the BDP and other MRC Programmes. The data shown in the assessment framework (see Table 10) thus represent outputs from the data preparation packages and inputs to the assessment and trade-off analyses. The hydrological assessment of each scenario is an activity in itself (A1), which should be reported upon by an expert hydrologist. The results (maps, time series etc) should be placed in the same information platform as the data above. There is a priority need to: 1) define the exact set-ups for each scenario (e.g. which dams and where, what irrigation demands, etc) and 2) obtain a quality assured hydrological data set for the climate change scenario(s) from EP. Consultations with the various stakeholder groups may most usefully be held based on the findings from activities A1, B2, B5a and interim information from the other activities as may be meaningful to present. The results of the consultations will then need to feedback into the draft main report (B6). In parallel to the BDP assessments, MRC will undertake a SEA of the mainstream dams which will consider the impacts in the broader energy sector context of the region as a whole. Clearly it is important that there is adequate sharing of information between the two assessments. Each assessment has similar reporting schedules, which will certainly help the knowledge sharing process. 4.4 Risks and uncertainties During the assessment, various assumptions will have to be made where data and information are insufficient, inaccurate or uncertain. For example, an important assumption for the assessment of most of the considered scenarios is that the hydropower cascade on the Lancang in China will be operated to maximize electricity production within the variability of historical inflow data. Also, some data sets, such as socio-economic data, may be incomplete or inaccurate. Areas of risk and uncertainty will be identified and analyzed during the assessment process. In the instances where assumptions or approximate data are critical to the trade-offs under examination, it will be appropriate to undertake sensitivity tests within the stated reliability or accuracy levels to assess whether varied assumptions would change the conclusion that may be reached from the trade-off. 32
39 In the reporting on the assessment results, the risks and uncertainties will be described clearly, so that decisions can be made with knowledge of the degree of reliability of the estimated benefits and costs and the effectiveness of the alternative development scenarios (in achieving the specific development objectives (see Tables 10 and 21). 4.5 Output, reporting and capacity building In terms of outputs and reporting the following is suggested: The hydrological assessment and data preparation work packages (A1 and B1) should be focused on delivery of quality assured data sets to IKMP, accompanied by reports which include a commentary on the basis for the data set, the quality assurance procedures adopted, and any caveats that appear pertinent. It is imperative for future assessments that an estimate of the level of accuracy of the data is attached, as it must be anticipated that some data will be relatively approximate. The assessment of the identified trade-off in each scenario (B2-B5) must be presented in a consistent summary format together with a ready-prepared presentation and concise hand-out (e.g. max 5 pages) to be used in the consultations with stakeholders. In addition, each work package should present such supporting material as required to substantiate the summary information and presentations. The outcomes from the final activity (B6) would be a report that could be presented in three formats: 1) a detailed report that describes the entire assessment (process, methods, tools, data used, assumptions, results, risks and uncertainties) to be used to convince external stakeholders of the quality of the results, 2) a concise report which sets out a summary of the overall findings and the nature of the trade-offs which the MRC recommends for consideration by the member countries, and 3) a five-page brochure that summarizes the assessment process and results. In the presentation of the various outputs and reports, use will be made of easy to interpret GIS-based maps, tables, graphs, and charts. In addition, a programme of consultations and capacity building will be implemented at the basin, national and subbasin levels to promote the understanding and acceptance of the scenario assessment results. 33
40 4.6 Data and information needs The large majority of the data and information required for the assessments is available in various databases and documents at the MRCS (in Vientiane and Phnom Penh). In particular the socio-economic and environmental data should drawn together, and where necessary and possible updated and improved, in consultation with the NMCs. Therefore, it would be useful to establish a planning database, which will greatly facilitate and enhance the assessment and subsequent planning processes by providing a robust, transparent and auditable platform for the subsequent work. The planning database would comprise the processed data listed in the scenario assessment framework table (Table 10). Once established and quality assured (by the responsible Programmes in consultation with the NMCs), the data sets would be placed on the IKMP MRCS-IS and accessible to all. This would enhance consistency of subsequent analyses and provide a ready basis to a much improved planning atlas. The data represent the outputs from the data assembly work packages (B1) and the inputs to the subsequent assessments (B2 to B5). Key data sets (irrigation, hydropower, and flood management) already exist in order to facilitate a rapid start to the B2 assessment. A listing of the data requirements as outputs for the B1 activities is given in Table 22. The data sets should be compiled with as little aggregation of raw data as possible to enable subsequent users the greatest possible flexibility to meaningfully overlay or combine one data set with another. Different sectors will wish to combine data in different ways (e.g. socially or environmentally significant zones; flooded areas; specific land use areas; district, provincial and national administrative boundaries; watersheds and sub-watersheds; BDP sub-areas, etc). The more disaggregated the data the easier and more accurately it can be added up within these different boundaries. It is also important that, as part of the quality assurance, an estimate is made of the accuracy of the data. Planners and assessors need to know this, so they can make judgments on the validity of conclusions drawn from trade-off assessments. 4.7 Implementation arrangements Work Package A1. The assessment of the flow changes caused by the considered development scenarios with the DSF is being undertaken in a similar way as the preliminary hydrological assessment of some of the scenarios in The work will be led by the BDP2 modeling expert, who will work with the IKMP modeling team. 34
41 Selected national modelers will review input data and modeling results and conduct sensitivity analysis. A CSIRO/IWMI team has been mobilized for the assessment of the scenarios with climate change impact. IKMP is taking the lead in the assessment of the impact of the considered scenarios on sediment and nutrient transport, with an emphasis on sediment trapping by dams. It would also prepare guidelines for sediment management strategies to minimize erosion of the river bed and banks. The BDP team will work with IKMP and EP on the assessment of the impact of the scenarios on water quality. Work Package B1. The BDP team is taking the lead in pulling together the relevant economic, environmental and social baseline data and information available in the MRCS and the member countries. Support will be provided by the other MRC Programmes. Work Package B2 to B6. A multi-disciplinary team of riparian, international and MRC experts will be established in April to undertake the economic, environmental and social assessment of the considered scenarios. A Terms of References (TOR) has been prepared for each of the work packages yet to start. The implementation of each work package will be led by a senior expert, who guides the contributions of thematic teams of economic, social and environmental experts. Individual members of the expert team will be required to support the various national and regional consultation meetings and workshops events that will be organized by the BDP team. One of the senior experts will take the lead in pulling the results of work packages B2 to B5 together in a concise main report (B6). FMMP-C2 has mobilized a consultant team that will support the assessment of the Mekong Delta Flood Management and provide advice on the assessment of the longer-term scenarios. The entire assessment will be managed by the BDP2 Coordinator with assistance of the BDP2 Economist. The BDP2 CTA will provide technical direction whenever needed. Throughout the assessment there will be frequent consultation with the NMCs through the National BDP2 Coordinators. The latter will review draft presentations and handouts and other documents with intermediate results to be used in national and regional consultations. 4.8 Implementation of the research activities The assessment of the other economic, environmental and social impacts identified in Tables 4 to 9 requires research. Potential research issues have been identified in Table 10 where it appears that there is insufficient information or no proven methods available to permit quantification of the assessment indicators. Some of the research activities would 35
42 include the use of improved GIS applications to delineate the (relatively small) hydrological changes and the revitalization of some of the IBFM methods and processes. Potential research topics Where possible, it is suggested that research is undertaken in these areas, with a view to obtaining a better understanding and more readily quantifiable indicators for future assessments. A provisional list is provided below, but others may emerge from the assessment exercise. Specific development objective 1.5 Maintain productivity of fishery sector 3.1 Maintain livelihoods of vulnerable resource-users 2.1 Maintain water quality and acceptable flow conditions 2.4 Minimize channel effects on bank erosion 2.5 Conservation of biodiversity Issue Impact of flow and sediment transport changes on deep pools Health, food and income security Water quality and flow characteristics Protection of forests around Tonle Sap River bank erosion Impacts of flow management changes on endangered species Indicator requiring further R&D in order to quantify Sediment loads at specified locations on mainstream Net incremental economic values Severity of impact on health, food and income security Water quality incl. sediment in transport in mainstream Net incremental economic values Incremental area at risk to erosion Vulnerability to bank erosion Net incremental economic values Estimated number of species affected Incremental net economic value to tourism During the scenario assessment in 2009, the most important research activities will be identified and a Project Identification Notes (PINs) prepared. Some of the research activities could be implemented by the appropriate MRC Programmes. Other activities could be undertaken by other organizations with research capabilities, such as international organizations (IUCN, IWMI, WWF, etc.), universities and research institutes. The forthcoming Finnish modeling support project ( ) managed by IKMP is well placed to implement some of the already identified activities. Priority should be given to the assessment of impacts in environmentally and socially sensitive areas, such as the Tonle Sap and wetlands in Northeast Thailand. The presence in 2009 of multi-disciplinary teams of experts will be used to confirm, and where necessary improve, the current plans for the upgrading of the DSF impact analysis and reporting tools. Once the DSF in 2010, future assessment of development scenarios can be largely carried out by using the data, models and impact analysis tools of the DSF. 36
43 4.9 Terms of reference for work plan components Based on this Technical Note, a detailed TOR is prepared for each of the work packages yet to start. These TOR include staffing requirements and an elaboration of the tasks and deliverables of the individual experts. The TOR will be discussed with the RTWG on March All work packages should commence with a detailed review of the TOR to confirm that the data are indeed available and in useable form, and that outputs are appropriately described. Any deviations should however be discussed and agreed with the BDP management. A summary of the TOR is given below along with the proposed main objective of each work package. Compilation of the available economic, social and environmental information (B1) B1.4 Social baseline data and analysis of impact functions Objective: To collect and assemble all required data and resource material in MRCS-IS, and analyze input functions for social indicators. This is to ensure that the task teams responsible for each work package have all the available information necessary to undertake the social impact assessment studies. The information collected should therefore enable work on the subsequent packages to move ahead without delay. The results of the ongoing field work on vulnerability assessment are expected to improve the social knowledge base by May B.1.5 Economic baseline data and analysis of impact functions Objective: To collect and assemble all required data and resource material in MRCS-IS, and analyze input functions for economic indicators. This is to ensure that the task teams responsible for each work package have all the available information necessary to undertake the economic impact assessment studies. The information collected should therefore enable work on the subsequent packages to move ahead without delay. B.1.6 Environmental baseline data and analysis of impact functions Objective: To collect and assemble all required data and resource material in MRCS-IS, and analyze input functions for environmental indicators. This is to ensure that the task teams responsible for each work package have all the available information necessary to undertake the environmental impact assessment studies. The information collected should therefore enable work on the subsequent packages to move ahead without delay. 37
44 Assessment of the LMB 20-Year Plan and alternative perspectives regarding the number and location of mainstream dams (B2) Objective: To examine the social, economic and environmental trade-offs associated with the three scenarios (LMB 20-Year Plan, the LMB 20-Year Plan without Mainstream Dams and the LMB 20-Year Plan without Mainstream Dams in the Middle and Lower LMB) regarding the benefits and costs relating to hydropower development, fisheries, irrigation and river transport. Assessment of impacts of the Definite Future in Northern LMB (B3) Objective: To assess the trans-boundary social, economic and environmental impacts within Northern Thailand and Lao PDR of increased storage capacity in Upper Mekong Basin. Assess the identified opportunities (e.g. increased irrigation and flood mitigation) and the costs of mitigating the adverse impacts (e.g. river bank erosion) resulting from alternative operating strategies of upstream dams. Assessment of the Mekong delta Flood Management (B4) Objective: To assess the key social, economic and environmental trade-offs associated with alternative flood management options in the Mekong Delta, including both structural and non-structural measures. Description of the economic, social and environmental consequences of the scenarios for the longer term (B5) Objective: To describe the likely economic, social and environmental consequences of the LMB Long-Term Development and the LMB Very High Development. The assessment will be split into two phases: a preliminary assessment with immediately available data (B5a) followed by a more thorough analysis (once all data sets are in place (B5b). The results from B5a may prompt identification of particular issues that require more detailed investigation as a result of their apparent relevance to decision-taking. Main Report: Triple bottom line assessment of BDP development scenarios: overview of impacts and trade offs (B6) Objective: To present a concise description for decision makers of the likely economic, social and environmental consequences of different water-related development scenarios in the medium (20 years) and long term (50 years) in order to facilitate informed discussion on the trade-offs that may be necessary to achieve the objectives of 1995 Mekong Agreement. 38
45 4.10 Estimated expert requirements The expert requirements have been estimated for each work package. In total 130 person months would be required, to be delivered by individually recruited riparian and international consultants.. 39
46 Table 1: Summary of scenario components 40
47 Table 2: Main water resource developments in the considered scenarios Country Baseline Definite Future s for the Foreseeable Future (20 years) Longer Term s (50 years) Situation Situation Baseline Chinese Definite LMB 20- LMB 20-Year LMB 20 Year Mekong Delta LMB Long- LMB Extreme Climate Dam Future Year Plan Plan Plan Flood Term Development Change without without Management Development s Mainstream Mainstream Dams in the Dams Middle and Lower LMB China Hydropower (MW) Hydropower storage (bcm) Irrigation wet season ( 000 ha) Irrigation dry season ( 000 ha) Flood protection ( 000 ha) Water supply (mcm) Cambodia Hydropower (MW) Hydropower storage (bcm) 41
48 Country Baseline Definite Future s for the Foreseeable Future (20 years) Longer Term s (50 years) Situation Situation Baseline Chinese Definite LMB 20- LMB 20-Year LMB 20 Year Mekong Delta LMB Long- LMB Extreme Climate Dam Future Year Plan Plan Plan Flood Term Development Change without without Management Development s Mainstream Mainstream Dams in the Dams Middle and Lower LMB Irrigation wet season ( 000 ha) Irrigation dry season ( 000 ha) Flood protection ( 000 ha) Water supply (mcm) Lao PDR Hydropower (MW) Hydropower storage (bcm) Irrigation wet season ( 000 ha) Irrigation dry season ( 000 ha) Flood protection ( 000 ha) Water supply (mcm) 42
49 Country Baseline Definite Future s for the Foreseeable Future (20 years) Longer Term s (50 years) Situation Situation Baseline Chinese Definite LMB 20- LMB 20-Year LMB 20 Year Mekong Delta LMB Long- LMB Extreme Climate Dam Future Year Plan Plan Plan Flood Term Development Change without without Management Development s Mainstream Mainstream Dams in the Dams Middle and Lower LMB Thailand Hydropower (MW) Hydropower storage (bcm) Irrigation wet season ( 000 ha) Irrigation dry season ( 000 ha) Flood protection ( 000 ha) Water supply (mcm) Vietnam Hydropower (MW) Hydropower storage (bcm) Irrigation wet season ( 000 ha) 43
50 Country Baseline Definite Future s for the Foreseeable Future (20 years) Longer Term s (50 years) Situation Situation Baseline Chinese Definite LMB 20- LMB 20-Year LMB 20 Year Mekong Delta LMB Long- LMB Extreme Climate Dam Future Year Plan Plan Plan Flood Term Development Change without without Management Development s Mainstream Mainstream Dams in the Dams Middle and Lower LMB Irrigation dry season ( 000 ha) Flood protection ( 000 ha) Water supply (mcm) 44
51 Table 3: Schedule of hydrological assessments Scoping and planning of the assessment of basin-wide development scenarios Basin Development Plan Programme, Phase 2 Ref Title Hydrology Dams China Mainstream Tributary Irrigation and water supply demands Flood control works 100 Baseline scenario Standard No addition None Existing in 2000 As in 2000 No addition 200 Chinese Dam scenario Standard Max power None Existing in 2000 As in No addition 201 Standard Max flood control None Existing in 2000 As in No addition 300 Definite future scenario Standard Max power None Existing + under construction As in No addition 400 LMB 20-year plan scenario Standard Max power All 11 dams Existing + planned by 2030* Existing + planned by 2030* Existing + planned by 2030* 401 Climate change Max power All 11 dams Existing + planned by 2030* Existing + planned by 2030* Existing + planned by 2030* 500 LMB 20-year plan scenario without Standard Max power None Existing + planned by 2030* Existing + planned by 2030* Existing + planned by 2030* 501 mainstream dams Climate change Max power None Existing + planned by 2030* Existing + planned by 2030* Existing + planned by 2030* 600 LMB 20-year plan scenario without Standard Max power All u/s of VTE Existing + planned by 2030* Existing + planned by 2030* Existing + planned by 2030* 601 mainstream dams in Middle and Lower LMB Climate change Max power All u/s of VTE Existing + planned by 2030* Existing + planned by 2030* Existing + planned by 2030* 700 Mekong delta flood management scenario Standard Max power None Existing + planned by 2030* Existing + planned by 2030** Existing + planned by Option Standard Max power None Existing + planned by 2030* Existing + planned by 2030** Existing + planned by Option Standard Max power None Existing + planned by 2030* Existing + planned by 2030** Existing + planned by Option Standard Max power None Existing + planned by 2030* Existing + planned by 2030** Existing + planned by Option Climate change Max power None Existing + planned by 2030* Existing + planned by 2030** Emerging best option A 705 Climate change Max power None Existing + planned by 2030* Existing + planned by 2030** Emerging best option B 800 LMB long-term development scenarios Standard Max power None Existing + expected by 2060 Existing + expected by 2060 Existing + expected by year horizon Climate change Max power None Existing + expected by 2060 Existing + expected by 2060 Existing + expected by LMB very high development scenarios Standard Max power None Full potential Full potential Existing + expected by year horizon Climate change Max power None Full potential Full potential Existing + expected by Alternative scenarios etc 23 scenario runs Notes: * the term planned here refers to that in each country's own plans ** in the case of flood control assessments, the irrigation area comprises that which is in each country's plans plus that in addition made possible by the flood control works 45
52 Table 4: Preliminary scoping of the main and minor hydrological changes and the associated transboundary economic, environmental and social impacts caused by the Chinese Dam and the Definite Future 10 Main hydrological changes (see modelling results of fast tracked scenarios at Large flow increases (25-50%) during the dry season in the mainstream in the northern part of Lao PDR and Thailand. The increased flows are higher than the historical observed range In particular the Chinese Dam may significantly reduce sediment transport in the northern part of Lao PDR and Thailand The major storage projects Xiaowan and the Nuozhadu could have a mitigating effect on floods in the northern part of Lao PDR and Thailand that are caused by storms in the Upper Mekong Basin that arrive early in the wet season, when the reservoirs are being filled up. Related economic, environmental and social impacts Relevant assessment indicators (see Table 10) Potential economic benefits in the Changes in irrigable area and yields irrigated agricultural sector throughout (irrigated area (ha), production (tons), the LMB net economic value (million USD/year) Changes in employment in the various economic water-related sectors (number of jobs created, including for locals) Possibly economic and environmental Changes in sediment load at specific costs related to increased bank erosion, locations along the mainstream (net in particular in the northern part of economic value (million USD/year) Thailand and Lao PDR The mitigating effect of the upstream Changes in flood risk reduction (net storages could be extended for the economic value (million USD/year) entire wet season through a reservoir operation strategy that includes flood control, which would require suitable agreements with China The large increases in dry season flow The increased flow provides a safety Changes in the areal extent and damage Main trade-off There is no point in defining a trade-off. The Definite Future will become a reality within 5 to 10 years from now. However, it is useful to assess the main impacts of the scenarios on the mainstream in the LMB; the purpose is to: 1) assess their benefits and costs and 2) provide another baseline situation against which LMB scenarios can be assessed 10 Tables 4 to 9 will be reviewed and refined as understanding improves during assessments 46
53 Main hydrological changes Related economic, environmental and Relevant assessment indicators Main trade-off (see modelling results of fast tracked social impacts (see Table 10) scenarios at in the northern part of Thailand and factor against salinity intrusion in the of salinity intrusion (areal extent Lao PDR (see above) decrease to 10% Vietnam Delta, which is difficult to (hectares), net economic value (million in the Vietnam Delta quantify in terms of economic and USD/year) environmental benefits Increase in the water level during the Potential economic benefits in the Changes in safe draught condition for dry season in the northern parts of navigation and tourism sectors in the different categories of ships (net Thailand and Lao PDR of about 0.5 northern parts of Thailand and Lao economic value (million USD/year) meter. The increase is small compared PDR to the historically observed seasonal Changes in areal extent and production variation (between wet and dry Possibly negative economic and of wetlands (areal extent (hectares), net seasons) of about 10 meter environmental impacts to wetlands and economic value (million USD/year) river bank gardens in the northern parts of Thailand and Lao PDR Relatively small changes (< 10%) in the Positive and negative economic, Changes in capture fisheries and volume, duration and timing of the environmental and social impacts, aquaculture production (production flood pulse in Cambodia (Tonle Sap which are difficult to quantify (tons), net economic value (million Lake and Cambodian Delta) and the separately from of the larger impacts USD/year) Vietnam Delta. The calculated changes caused by the natural year-to-year flow are less than the historically observed variability. Changes in subsistence livelihoods natural year-to-year flow variability. depending on the use of natural resources from flood plains, wetlands, streams, etc. (number of lost subsistence livelihoods and/or reductions in food security and cash income) Changes in areal extent and production of wetlands (areal extent (hectares), net 47
54 Main hydrological changes Related economic, environmental and Relevant assessment indicators Main trade-off (see modelling results of fast tracked social impacts (see Table 10) scenarios at economic value (million USD/year) Changes in sediment load at specific locations along the mainstream, depth of deep pools in the mainstream, areal extent of periodically flooded forests around Tonle Sap (net economic value (million USD/year) 48
55 Table 5: Preliminary scoping of the main and minor hydrological changes and the associated transboundary economic, environmental and social impacts caused by the LMB 20-Year Plan and the LMB 20-Year Plan without Mainstream Dams in the Middle and Lower LMB 11 Main hydrological changes Related economic, environmental and Relevant assessment indicators Main trade-off (see modelling results of fast tracked social impacts (see Table 10) scenarios at The hydrological changes caused by The economic and social impacts could Changes in hydropower generating The main trade-off in these mainstream dams in the LMB are be very significant throughout the LMB, capacity and hydroelectricity generation scenarios is between: relatively small (see below). The main depending on the location and number (installed capacity (MW), production impact of the formulated mainstream of dams. The impacts need to be (GWh), net economic value (million the economic and social dam scenarios is a likely significant assessed, taking into account: 1) USD/year) benefits created in the basin-wide reduction in migratory fish decreases in migratory fish production Changes in irrigable area and yields hydropower and irrigated yield, due to the blockage of fish due to non-water related factors, (irrigated area (ha), production (tons), net agricultural sectors migration by dams, which is difficult economic value (million USD/year) to mitigate. The possible declines in Changes in capture fisheries and and fish yield are being predicted aquaculture production (production (tons), net economic value (million USD/year the economic and social 2) the adaptability of fish species to new environments, and 3) increases aquaculture, including reservoir and irrigation field fisheries Changes in employment in the various economic water-related sectors above (agriculture, hydropower, fisheries) (Number of jobs created (including for locals) costs resulting from decreases in total fish production (capture and aquaculture) Changes in subsistence livelihoods depending on the use of natural resources from flood plains, wetlands, 11 Tables 4 to 9 will be reviewed and refined as understanding improves during assessments 49
56 Main hydrological changes Related economic, environmental and Relevant assessment indicators Main trade-off (see modelling results of fast tracked social impacts (see Table 10) scenarios at streams, etc. (number of lost subsistence livelihoods and/or reductions in food security and cash income) Relatively small (<5%) flow and level The economic, environmental and Most of the criteria listed in Table 10 changes in the mainstream in the LMB; social benefits and costs are difficult to the changes are a fraction of the quantify separately from of the larger historically observed natural year-to- impacts caused by the natural year-to- year flow variability year flow variability Small (<10%) reduction of the duration The economic and environmental Changes in the areal extent and damage of salinity intrusion in a small (<10%) benefits, if any, are difficult to quantify of salinity intrusion (areal extent part of the Vietnam Delta (hectares), net economic value (million USD/year) Small changes (< 10%) in the volume, Positive and negative economic, Changes in capture fisheries and duration and timing of the flood pulse environmental and social benefits and aquaculture production (production (tons), in Cambodia (Tonle Sap Lake and costs are difficult to quantify separately net economic value (million USD/year) Cambodian Delta) and the Vietnam from of the larger impacts caused by Changes in subsistence livelihoods Delta. The calculated changes are a the natural year-to-year flow variability depending on the use of natural fraction of the historically observed resources from flood plains, wetlands, natural year-to-year flow variability Also the impact of these habitat changes streams, etc. (number of lost subsistence Also habitats, including wetlands, may are difficult to assess livelihoods and/or reductions in food security change, as a result of changes in fish and cash income) biodiversity and biomass Changes in areal extent and production of wetlands (areal extent (hectares), net economic value (million USD/year) Changes in sediment load at specific locations along the mainstream, depth of deep pools in the mainstream, areal 50
57 Main hydrological changes Related economic, environmental and Relevant assessment indicators Main trade-off (see modelling results of fast tracked social impacts (see Table 10) scenarios at extent of periodically flooded forests around Tonle Sap (net economic value (million USD/year) The dams may cause local changes in If the dams are designed to pass on Changes in sediment load at specific sediment transport and water quality. sediments (which is necessary because locations along the mainstream, depth of their upstream reservoirs are small), deep pools in the mainstream, areal and are equipped with an aeration extent of periodically flooded forests system, then economic and around Tonle Sap (net economic value environmental costs will be small and (million USD/year) difficult to estimate. Changes in key regional water quality parameters at specific locations (salinity, dissolved oxygen, turbidity and temperature (and associated units), net economic value (million USD/year) 51
58 Table 6: Preliminary scoping of the main and minor hydrological changes, and the associated transboundary economic, environmental and social impacts of the LMB 20-Year Plan without Mainstream Dams 12 Main hydrological changes Related economic, environmental and Relevant assessment indicators Main trade-off (see modelling results of fast tracked social impacts (see Table 10) scenarios at This scenario causes relatively small The economic and social impacts could Changes in hydropower generating The main trade-off in these hydrological changes beyond a daily be very significant throughout the LMB, capacity and hydroelectricity generation scenarios is between: time frame (see below). The reduction depending on the location and number (installed capacity (MW), production in migratory fish yield, due to the of dams. (GWh), net economic value (million the economic and social blockage of fish migration by tributary USD/year) benefits created in the dams, could be significant, although Changes in irrigable area and yields hydropower and irrigated the reduction would be considerable (irrigated area (ha), production (tons), net agricultural sectors less severe than in the 20 Year Plan economic value (million USD/year). Changes in capture fisheries and and aquaculture production (production (tons), net economic value (million the economic and social USD/year) costs resulting from Changes in employment in the various decreases in total fish economic water-related sectors above production (capture and (agriculture, hydropower, fisheries) aquaculture) (Number of jobs created (including for locals) Changes in subsistence livelihoods depending on the use of natural resources from flood plains, wetlands, 12 Tables 4 to 9 will be reviewed and refined as understanding improves during assessments 52
59 Main hydrological changes Related economic, environmental and Relevant assessment indicators Main trade-off (see modelling results of fast tracked social impacts (see Table 10) scenarios at streams, etc. (number of lost subsistence livelihoods and/or reductions in food security and cash income) Relatively small (<5%) flow and level The economic, environmental and Most of the criteria listed in Table 10 changes in the mainstream in the LMB; social benefits and costs are difficult to the changes are a fraction of the quantify separately from of the larger historically observed natural year-to- impacts caused by the natural year-to- year flow variability year flow variability Small (<10%) reduction of the duration The economic and environmental Changes in the areal extent and damage of salinity intrusion in a small (<10%) benefits, if any, are difficult to quantify of salinity intrusion (areal extent part of the Vietnam Delta (hectares), net economic value (million USD/year) Small changes (< 10%) in the volume, Positive and negative economic, Changes in capture fisheries and duration and timing of the flood pulse environmental and social benefits and aquaculture production (production in Cambodia (Tonle Sap Lake and costs are difficult to quantify separately (tons), net economic value (million Cambodian Delta) and the Vietnam from of the larger impacts caused by USD/year) Delta. The calculated changes are a the natural year-to-year flow variability Changes in subsistence livelihoods fraction of the historically observed depending on the use of natural natural year-to-year flow variability resources from flood plains, wetlands, streams, etc. (number of lost subsistence livelihoods and/or reductions in food security and cash income) Changes in areal extent and production of wetlands (areal extent (hectares), net economic value (million USD/year) Changes in sediment load at specific locations along the mainstream, depth of 53
60 Main hydrological changes Related economic, environmental and Relevant assessment indicators Main trade-off (see modelling results of fast tracked social impacts (see Table 10) scenarios at deep pools in the mainstream, areal extent of periodically flooded forests around Tonle Sap (net economic value (million USD/year) Reduction in migratory fish yield in Negative economic and social impacts Changes in capture fisheries and the LMB, due to the blockage of fish throughout the LMB, depending on the aquaculture production (production migration by tributary dams, which is location and number of dams, which (tons), net economic value (million difficult to mitigate. are difficult to assess USD/year) 54
61 Table 7: Preliminary scoping of the main and minor hydrological changes, and the associated transboundary economic, environmental and social impacts caused by the Mekong Delta Flood Management 13 Main hydrological changes Related economic, environmental and Relevant assessment indicators Main trade-off (see FMMP C2 modelling results 2008) social impacts (see Table 10) To be confirmed. The management of It is expected that with appropriate Changes in flood risk reduction (net The main trade-off is floods beyond the early floods may mitigating measures, the transboundary economic value (million USD/year) between: cause significant hydrological changes economic, environmental and social Changes in irrigable area and yields at both sides of the impacts are relatively small (irrigated area (ha), production (tons), The economic and social Vietnamese/Cambodian border. The net economic value (million USD/year) benefits of reduced levels of changes result essentially from the loss At the national level there will be Changes in employment in the various flood risk reduction in of storage capacity during the different changes in the beneficial use of a economic water-related sectors above terms of improvement of stages of the floods. Retention options variety of water-related flora and fauna (agriculture, hydropower, fisheries) agricultural production and to compensate for the lost storage species, in particular in wetlands, as (Number of jobs created (including for other economic activities, capacity are hardly available. well as benefits foregone in the locals) reduction of damage to Therefore, significant compensating agricultural sector Changes in capture fisheries and infrastructure, and the measures are needed, such as the aquaculture production (production reduction of loss of life diversion of floodwaters in the border (tons), net economic value (million (people and livestock) zone towards the Gulf of Thailand and USD/year) /or the Vam Co River. Changes in subsistence livelihoods and depending on the use of natural Various options for flood management resources from flood plains, wetlands, Economic, environmental will need to be studied in sub- streams, etc. (number of lost subsistence and social costs resulting scenarios livelihoods and/or reductions in food security from 1) investments in and cash income) flood protection measures 13 Tables 4 to 9 will be reviewed and refined as understanding improves during assessments 55
62 Main hydrological changes Related economic, environmental and Relevant assessment indicators Main trade-off (see FMMP C2 modelling results 2008) social impacts (see Table 10) Changes in areal extent and production and 2) benefits foregone, of wetlands (areal extent (hectares), net including natural soil economic value (million USD/year) fertilization, flushing of Changes in the areal extent and damage acid and pollutants, pest of salinity intrusion (areal extent control, reductions in (hectares), net economic value (million capture fisheries and USD/year) wetland productivity To be determined. With appropriate The resulting economic, environmental Most of the assessment criteria listed in mitigating measures in place, and social impacts are largely national Table 10. developments in Cambodia have a in nature small impact on flood risks in Vietnam and vice versa 56
63 Table 8: Preliminary scoping of the main and minor hydrological changes, and the associated transboundary economic, environmental and social impacts caused by the LMB Long-Term Development 14 Main hydrological changes Related economic, environmental and Relevant assessment indicators Main trade-off social impacts (see Table 10) To be determined. Similar but larger Increased levels of positive and Most of the assessment criteria listed in The main trade-off in these changes are expected as predicted for negative economic, environmental and Table 10. scenarios is between: the foreseeable future scenarios. social impacts from water resources Increased irrigation demand may still development in comparison with the the economic and social be balanced by increases of dry season impacts described for the foreseeable benefits created in the flows due to hydropower future scenarios economic sectors (e.g. development. Changes in sediment hydropower, agriculture, transport and water quality become navigation, domestic and more important issues industrial water supply) To be determined To be determined Most of the assessment criteria listed in Table 10. and Various costs related to 1) changes in the habitats and beneficial use of a variety of water-related flora and fauna species, including fish and 2) channel effects, including river bed, river bank, and coastal erosion 14 Tables 4 to 9 will be reviewed and refined as understanding improves during assessments 57
64 Table 9: Preliminary scoping of the main and minor hydrological changes and the associated transboundary economic, environmental and social impacts of the LMB Very High Development 15 Main hydrological changes Related economic, environmental and Relevant assessment indicators Main trade-off social impacts (see Table 10) To be determined. Basin-wide, large changes of the flow and levels in the mainstream, sediment transport, water quality, the working of the Tonle Sap, and flooding and salinity intrusion in the delta. This scenario includes major water resources developments, some of which may help mitigating increases in the size and frequency of floods caused by climate change and sustaining historically observed minimum flows in the Mekong Delta Not relevant Large basin-wide economic, social and environmental impacts. This scenario would transform the LMB. As a result, opportunities for living with floods and subsistence agriculture/fisheries would be confined to a few protected areas. Not relevant All assessment criteria listed in Table 10 Not relevant The main trade-off in these scenarios is between: the economic and social benefits created in the economic sectors (e.g. hydropower, agriculture, navigation, domestic and industrial water supply) and Economic, environmental and social costs related to 1) changes in the habitats and beneficial use of a variety of water-related flora and fauna species, including fish and 2) changes in the river and coastal geomorphology 15 Tables 4 to 9 will be reviewed and refined as understanding improves during assessments 58

65 Table 10: assessment framework (goal, objectives, issues, indicators and data requirements) 59

66 Table 10: Selected policy relevant, user driven, and measurable assessment criteria and main data requirements (Contd.) 60
67 Table 11: Assessment of the main economic, social and environmental benefits and costs of the Definite Future for the upper part of the LMB (as identified in Table 4) 16 Criteria Northern Thailand Northern Lao PDR China NPV 17 of decreases in flood damage under an operating strategy of the Xiaowan and Nuozhadu Hydropower Projects aimed at maximizing power production by the hydropower cascade in the Upper Mekong Basin (million US$) NPV of decreases in flood damage under an operating scenario of the Xiaowan and Nuozhadu Hydropower Projects that includes flood management (million US$) NPV of increases in irrigation, using part of the increased dry season flow (million US$) Jobs created (#) NPV of a reduced quantity and reliability of electricity of power production by the hydropower cascade in the Upper Mekong Basin due to flood management services (million US$) NPV of the cost of increased bank erosion due to decreases in sediment transport Jobs lost (#) Totals NPV (million US$) Employment balance (#) 16 This table will be reviewed and refined as the assessment proceeds 17 The Net Present Value (NPV) is calculated by subtracting the discounted value of the 30-year cost stream from the discounted value of the 30-year benefit stream 61
68 Table 12: Assessment of the main economic benefits and costs of the LMB 20-Year Plan by sector and country (a similar table can be prepared for the LMB 20-Year Plan without Mainstream Dams in the Middle and Lower LMB and the LMB 20- Year Plan without Mainstream Dams 18 Sector Cambodia Lao PDR Thailand Vietnam Total for Four Countries Hydropower Capacity (MW Production (GWh) NPV 19 (million US$) Irrigation Wet season area ( 000 ha) Dry season area ( 000 ha) NPV(million US$) Fisheries Capture fishery Production (tons) NPV(million US$) Aquaculture Production (tons) NPV(million US$) Other sectors NPV (million US$) Totals NPV (million US$) 18 This table will be reviewed and refined as the assessment proceeds 19 The Net Present Value (NPV) is calculated by subtracting the discounted value of the 30-year cost stream from the discounted value of the 30-year benefit stream 62
69 Table 13: Employment and livelihoods created by the LMB 20-Year Plan by country and sector (a similar table can be prepared for the LMB 20-Year Plan without Mainstream Dams in the Middle and Lower LMB and the LMB 20-Year Plan without Mainstream Dams) 20 Criteria LMB Thailand Lao PDR Cambodia Vietnam Outside LMB Jobs created by increases in hydropower (million #) Jobs created by increases in irrigation (million #) Jobs/livelihoods created in aquaculture (incl. reservoir and irrigation field fishery) (million #) Jobs/livelihoods created in other beneficial uses Jobs/livelihoods lost by decreases in capture fisheries yield (million #) Jobs/livelihoods lost in other beneficial uses (million #) Totals Balance of gains and losses (million #) 20 This table will be reviewed and refined as the assessment proceeds 63
70 Table 14: Main trade-off in the LMB 20-Year Plan by sector and country (a similar table can be prepared for the LMB 20- Year Plan without Mainstream Dams in the Middle and Lower LMB and the LMB 20-Year Plan without Mainstream Dams) 21 Criteria Unit Thailand Lao PDR Cambodia Vietnam Outside LMB NPV 22 of increases in hydropower million US$ NPV of increases in irrigation million US$ NPV of increases in other beneficial uses million US$ Jobs/livelihoods created million NPV of decreases in total fish yield million US$ NPV of decreases in other beneficial uses million US$ Jobs/livelihoods lost million # Totals Total NPV million US$ Employment balance Million # 21 This table will be reviewed and refined as the assessment proceeds 22 The Net Present Value (NPV) is calculated by subtracting the discounted value of the 30-year cost stream from the discounted value of the 30-year benefit stream 64
71 Table 15: Investment requirements of the LMB 20-Year Plan by sector and country (a similar table can be prepared for the LMB 20-Year Plan without Mainstream Dams in the Middle and Lower LMB and the LMB 20-Year Plan without Mainstream Dams) 23 Sector Cambodia Lao PDR Thailand Vietnam Total Four Countries Hydropower Capacity (MW) Private investment (million US$) Public investment (million US$) Total investment (million US$) Irrigation Wet season area ( 000 ha) Dry season area ( 000 ha) Public investment (million US$) Fisheries Capture fishery Private investment (million US$) Public investment (million US$) Aquaculture Private investment (million US$) Totals investment (million US$) Other sectors Public investment (million US$) 23 This table will be reviewed and refined as the assessment proceeds 65
72 Sector Cambodia Lao PDR Thailand Vietnam Total Four Countries Private investment (million US$) Total investment Public investment (million US$) Private investment (million US$) 66
73 Table 16: Assessment of the main economic and environmental benefits of present water resources use 24 Sector Cambodia Lao PDR Thailand Vietnam Total Four Countries Hydropower Capacity (MW) Production (GWh/year) ANR 25 (million US$) Irrigation Wet season area ( 000 ha) Dry season area ( 000 ha) ANR (million US$) Fisheries Capture fishery Production (tons/year) ANR (million US$) Aquaculture Production (tons/year) ANR (million US$) Wetlands Area ( 000 ha) ANR (million US$) Flood protection ANB 26 (million US$) 24 This table will be reviewed and refined as the assessment proceeds 25 Annual Net Revenue (ANR) is calculated as the difference between the annual gross revenue and annual cost (which does not include (annualized) investment costs). For example for irrigation it can be calculated as the annual sales value of the crops at the farm gate minus the annual production costs 67
74 Sector Cambodia Lao PDR Thailand Vietnam Total Four Countries Other sectors ANR (million US$) Totals ANR/ANB (million US$) 26 Annual Net Benefits (ANB) can be calculated by: 1) identifying a series of historically observed annual flood damages, 2) estimating how each annual flood damage would have been reduced by the flood management works in a considered water resources development scenario, and 3) adding up the estimated reductions in flood damage and dividing the result with the number of years. 68
75 Table 17: Assessment of the main economic, environmental and social benefits and costs of the Mekong Delta Flood Management 27 Sector Cambodia Vietnam Other Reduction in flood damage Protection of shallow flooded area ( 000 ha) Protection of deep flooded area ( 000 ha) NPV 28 (million US$) Saved lives (#) Incremental benefits in agriculture Crop 1 ( 000 ha) Crop 2 ( 000 ha) Crop 3 ( 000 ha) NPV 29 (million US$) Jobs created ( #) Incremental Benefits in Other Sectors NPV (million US$) Jobs/livelihoods (#) 27 This table will be reviewed and refined as the assessment proceeds 28 The Net Present Value (NPV) is calculated by subtracting the discounted value of the 30-year cost stream from the discounted value of the 30-year benefit stream. The investment cost stream comprises the construction costs phased over a number of years and the annual O&M costs. The benefit stream can be calculated by: 1) identifying a series of historically observed annual flood damages, 2) estimating how each annual flood damage would have been reduced by the flood management works in a considered water resources development scenario, and 3) adding up the estimated reductions in flood damage and dividing the result with the number of years. 29 The Net Present Value (NPV) is calculated by subtracting the discounted value of the 30-year cost stream from the discounted value of the 30-year benefit stream 69
76 Decline in Fisheries Capture fisheries Production (tons) NPV (million US$) Jobs/livelihoods (#) Aquaculture Production (tons) NPV (million US$) Jobs/livelihoods ( #) Sector Cambodia Vietnam Other Decline in Wetland Production Area ( 000 ha) NPV (million US$) Jobs/livelihoods (#) Other Benefits Foregone 30 NPV (million US$) Jobs/livelihoods (#) 30 Including natural soil fertilization, flushing of acid and pollutants, and pest control 70
77 Table 18: Distribution of the assessed economic benefits and costs of the LMB 20-Year Plan for Lao PDR (see Table 5) among segments of society in %. (a similar table can be prepared for other countries and other scenarios for the foreseeable future) 31 Criteria Government bodies? Poor rural areas (% of population) Distribution of hydropower benefits Distribution of irrigation benefits Distribution of flood management benefits Distribution of benefits of other beneficial uses Distribution of economic costs of declines in capture fish yield Middle class (% of population)? 31 This table will be reviewed and refined as the assessment proceeds 71
78 Table 19: Comparison of economic, social and environmental performance of selected scenarios by country 32 Country Baseline Definite Future LMB 20-Year Plan LMB 20-Year Plan LMB 20-Year Plan Mekong Delta without without Flood Mainstream Dams in Mainstream Management the Middle and Dams Lower LMB Cambodia ANR/ANB (million US$) NPV (million US$) Jobs (million #) Livelihoods (million #) Lao PDR ANR/ANB (million US$) NPV (million US$) Jobs (#) Livelihoods (million #) Thailand ANR/ANB (million US$) NPV (million US$) Jobs (million #) Livelihoods (million #) Vietnam ANR/ANB (million US$) 32 This table will be reviewed and refined as the assessment proceeds 72
79 Country Baseline Definite Future LMB 20-Year Plan LMB 20-Year Plan LMB 20-Year Plan Mekong Delta without without Flood Mainstream Dams in Mainstream Management the Middle and Dams Lower LMB NPV (million US$) Jobs (million #) Livelihoods (million #) Totals NPV (million US$)) Employment balance (# million) 73
80 Table 20: Comparison of economic, social and environmental performance of selected scenarios by sector 33 Sector Baseline Definite Future LMB 20-Year Plan LMB 20-Year Plan LMB 20-Year Plan Mekong Delta without without Flood Mainstream Dams in Mainstream Dams Management the Middle and Lower LMB Hydropower Capacity (MW) Production (GWh) NPV (million US$) Jobs (million #) Irrigation Wet season area ( 000 ha) Dry season area ( 000 ha) NPV (million US$) Jobs (million #) Fisheries Capture fishery Production (tons) NPV (million US$) Jobs/livelihoods (million #) Aguaculture 33 This table will be reviewed and refined as the assessment proceeds 74
81 Sector Baseline Definite Future LMB 20-Year Plan LMB 20-Year Plan LMB 20-Year Plan Mekong Delta without without Flood Mainstream Dams in Mainstream Dams Management the Middle and Lower LMB Production (tons) NPV (million US$) Jobs/livelihoods (million #) Wetlands Area ( 000 ha) NPV (million US$) Jobs/livelihoods (#) Flood Protection ANB (million US$) Navigation NPV (million US$) Jobs (#) Other Sectors NPV (million US$) 75

82 Table 21: Linkages of assessment criteria with the work packages 76
83 Scoping and Planning of the Assessment of Basin-wide Development s Table 22: Proposed work plan Scoping and planning of the assessment of basin-wide development scenarios Basin Development Plan Programme, Phase 2 Full time activity Intermittent activity Non-BDP activity Work Package Title Report Feb Mar Apr May Jun Jul Aug Sep Oct Nov Dec Jan Feb >>>> Key milestones 3 Joint Committee meetings 3 Council meeting Main BDP work packages A0 Technical review and steering 2 A1 Define and confirm scenario set ups A1 Hydrological assessments (run models, reporting) WP1 B1 Improvement of the available economic, environmental and social baseline information WP2 B.1.1 Fisheries baseline and impact functions WP B.1.2 Hydropower baseline and projections WP B.1.3 Irrigated agriculture baseline and projections WP B.1.4 Social baseline data and analysis of impact functions WP B.1.5 Economic baseline data and analysis of impact functions WP B.1.6 Environmental baseline data and impact functions WP B2 B3 B4 B5 B6 Assessment of mainstream dam options and impacts on fisheries Assessment of impacts of Definite Future in northern LMB Assessment of flood plain management options in Mekong delta Assessment of economic, social and environmental consequences of the long-term and high development scenarios (20 and 50 years) Triple bottom line assessment of BDP water resource development scenarios: overview of impacts and trade offs Other work packages C1 Consultation 2 Related activities EP Compilation and QA of climate change scenario data 3 Asssumed SEA Inception 3 to be 1 SEA Interim 1 ~ scoping 3 month SEA Initial draft SEA report 3 delayed SEA Final draft SEA report 3 SEA Final SEA report 3 Research activities 3 WP3 WP4 WP5 WP6 Main Report 77

84 Table 23: Identified data and information needs 78

85 79
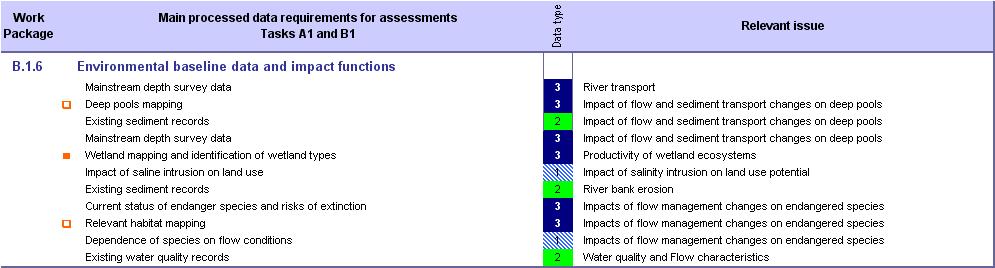
86 80


87 Figure1: Key elements of the Rolling IWRM-based Basin Development Plan IWRM-Based Planning Capacity Public Participation Basin-Wide Development s IWRM-Based Basin Strategy IWRM-Based BDP Project Portfolio Development Partners Knowledge Base and Assessment Tools Figure 2: The BDP Planning Cycle 81

88 Figure 3: BDP s integration with national processes 82
89 Climate Change s Scoping and Planning of the Assessment of Basin-wide Development s Figure 4: The approach to formulate scenarios and the assessment process Planning time horizon s Year 2000 (Baseline) Baseline (Year 2000) Year 2015 (Definite future) Definite Future s Year 2030 (Foreseeable future) s for the Foreseeable Future - National Perspectives - Alternative Perspectives Year 2060 or more (Long-term future) Long-Term s Assessment Criteria Decision making Unselected Guidance Selected Selected LMB 20-year Plan Development (s) 83

90 Figure 5: Twelve key monitoring stations along the mainstream and Tonle Sap 84