The South East Region Defined
|
|
|
- Elizabeth Melton
- 5 years ago
- Views:
Transcription
1
2 Raison d être The need to understand the geopolitical and geographical sphere within which IENE operates Identify and evaluate the major energy policy challenges of the region challenges of the region Identify key investment and business opportunities in the energy sector of SE Europe Quantify the required investment for energy infrastructure projects by 2020
3 The South East Region Defined
4 I. Study Goals and Objectives Present and analysethe economic and political background of the region Describe the regional integration process and EU expansion impact on regional energy markets Energy analysis on a country by country basis Energy analysis on a regional basis: Oil upstream Oil midstream and downstream Natural Gas (upstream and downstream) Power generation Electricity transmission and distribution Energy Efficiency Renewable Energy Sources The role of interconnectors in electricity, natural gas and oil Energy market liberalisation process Environmental Climate Change and energy security considerations Current and future investment potential of the region
5 II. Study Organisation Study and Analysis Capability In-house study and analysis capability seriously expanded to accommodate study requirements Project Study Group Five people in-house core team 15 external contributors (various chapters, country profiles and country investment information) Cooperation with Prof. Pantelis Kapros of NTUA on energy demand forecasts for SE Europe (Chapter 13)
6 III. Methodology Scope definition by Study Group Study guidelines agreed following initial research and consultations within the Institute Selection and briefing of contributors* Information gathering from: Published sources Visits to various countries Meetings with selected companies and individuals active in the region Series of IENE regional seminars (Tirana: Jan. 2009, Sofia: April 2009, Sofia: May 2010, Plovdiv: Feb. 2011) Participation in regional Forums and Conferences (Energy Community, IEA, BBSPA) Series of IENE s S.E. Europe Energy Dialogue Meetings ( ) Analysis and synthesis by Study Group *Study Contributors have come from: Greece, Albania, Croatia, Bosnia -Herzegovina, FYROM, Montenegro, Serbia, Bulgaria, and Turkey.
7 Study Contents SOUTH EAST EUROPE ENERGY OUTLOOK Preface Acknowledgements Authors Executive Summary 1. Introduction 2. The Political Context 3. Regional Economic Outlook 4. Energy Security Considerations 5. The Regional Energy Overview: Common Challenges in Divergent National Contexts 6. Energy Country Profiles 7. Major Hydrocarbon Export and Transit Infrastructure Projects 8. The Oil and Gas Sector in S.E. Europe 9. Electricity Sector Analysis
8
9 SE Europe Basic Economic & Energy Parameters (2008) Population million GDP USD billion Installed Electricity Capacity MW Oil Consumption bbl/day Oil Production bbl/day Gas Consumption BCMs Gas Production BCMs
10

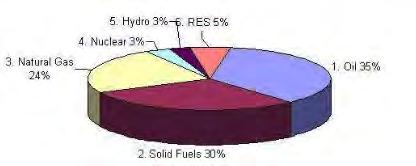
11 Total Primary Energy Consumption shares in SE Europe (2000) Total Primary Energy Consumption shares in SE Europe(2008)
12


13 South-East Europe Net Oil Import Dependency (2008)


14 Refining Capacity in S.E. Europe (2009)


15 South-East Europe Natural Gas Import Dependency (2008)
16 Installed Electricity Capacity (2009)

17 Capacity mix in S.E. Europe (2010)

18 Capacity mix in S.E. Europe for 2020
19 Key Energy Challenges Over dependence on petroleum and coal consumption High level of hydrocarbon import dependence Low level of import diversification, especially for natural gas Small RES penetration in overall energy mix Unsatisfactory level of energy efficiency, including high CO2 emission levels Limited oil and gas pipeline interconnections
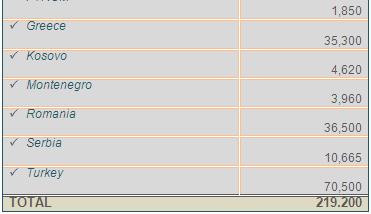
20 Country Energy Profiles Albania Bosnia and Herzegovina Bulgaria Croatia Cyprus FYROM Greece Kosovo Montenegro Romania Serbia Turkey
21 The EU Angle: Energy Infrastructure Strategy for 2020 European Council Decision of 4 Feb 2011: Completing the internal market by 2014 cooperation of ACER, ENTSOs, Commission Infrastructure is key for achieving targets by 2020 Ending isolation of energy islands by 2015 Financing for infrastructure: mainly marketbased complemented by limited public funds, notably for security of supply/solidarity Streamlining and improving authorization procedures
22 The EU Angle: Impact of EU decisions on the region EU decisions and Directives will have an impact on SE Europe Energy developments by : 2014,2015, 2020 and will affect: energy strategy, energy mix energy infrastructure energy demand
23 The EU Angle: The Importance of Gas. Gas has a role to play in the energy future of Europe. Value of gas with regards to CO2 emissions, flexibility, in storage and generation. EU gas marketisan attractiveregional marketthatopens up to international gas trade. Industry is the driver for investments. Gas industry is responsible for the creation of a real flexible gas market in the EU. EU acknowledges the key role of physical infrastructure and the access to diversified supplies
24 Linking the EU to new gas sources Energy Security for the EU and its neighbours Development of transit countries to stableeconomies and rule of law Aegean Adriatic Baltic Black (2A2B)Plan (North South Interconnections) Development of Southern Eastern Europe s gas market: Interconnections, Regulatory Work, Energy Community Gas Ring and establishment of gas hubs Good investmentopportunities through solid regulatory framework Contribute to Caspian andmiddle-eastcountries development Contribute to the development and implementation of an EU external energy policy

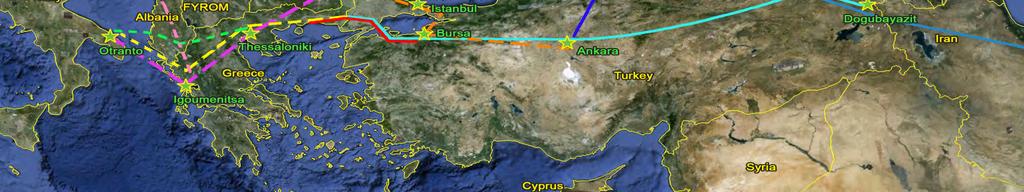
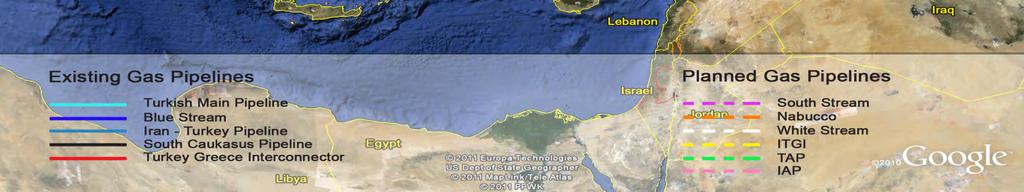
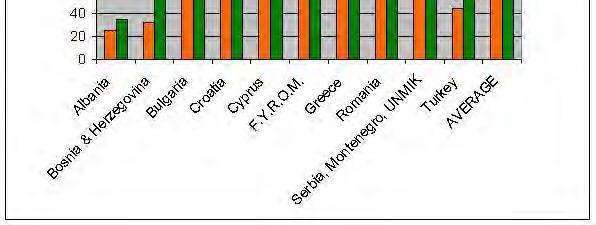
25 South Corridor Inter-Regional Pipeline Projects
26 The South Corridor Gas Pipeline Projects Project Shareholders Distance Cost Capacity Secured Completion Investment Date BOTAS, BUGARGAZ, Nabucco TRANSGAZ, MOL, OMV, RWE, km each with a share of 16.67% ITGI / IGI DEPA (50%), 807km of which 590 km Poseidon Edison (50%) Onshore, & 217km for IGI 520km from Thessaloniki EGL (42,5%), to Otranto but may have TAP Statoil (42,5%) & include a new line from E.ON (15%) Evros to Thessaloniki a distance of app. 340 km GAZPROM (50%), ENI (50%), of km of which 7,9 bn to expand to 14 bn after Iraqi expansion 31 bcm/y 200 million ,3-1,5 bn. due to expand to cover cost of 12 bcm/y 100 million upgrading Turkish NGTS 1,5 bn. according to EGL estimates but due to expand to cover cost of bcm/y upgrading Turkish & Greek NGTS which 10% may offshore 900km 15,5 bn. of which South Stream 63 bcm/y go to EDF and up connecting 5,5 bn. for offshore to 15% to BASF Anapa to Baumgarten /Wintershall

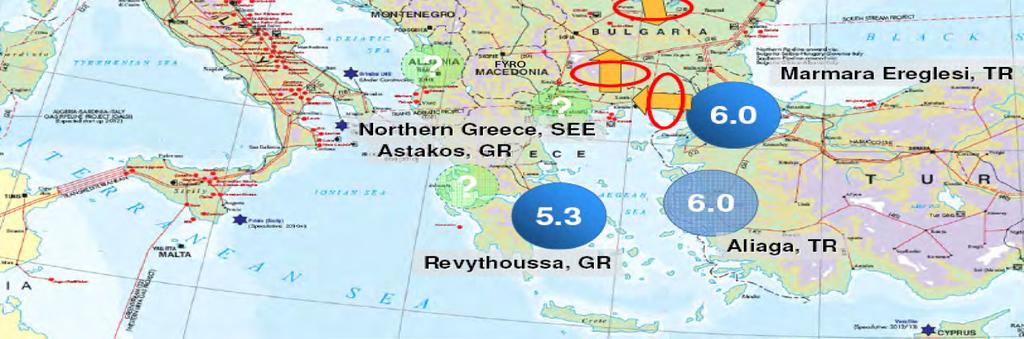
27 South East Europe Gas Interconnectors and L.N.G. Projects

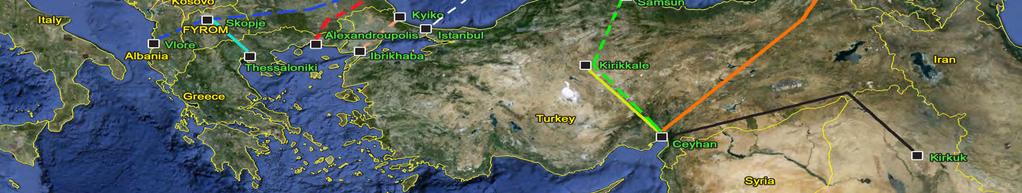
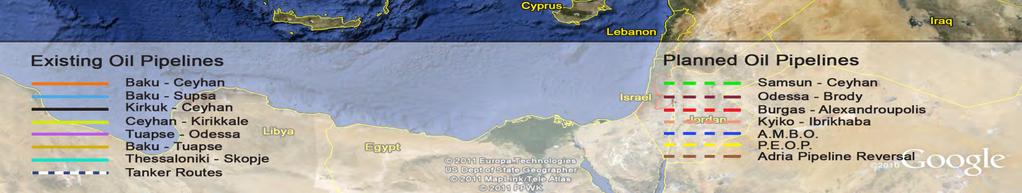
28 Oil Pipeline Projects

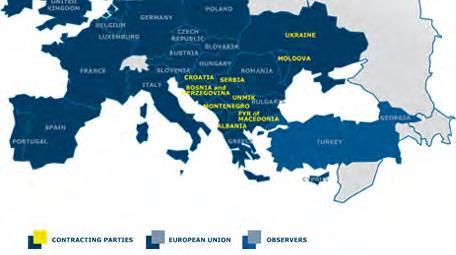
29 Energy Community Map
30 Electricity Interconnections Udine (IT) SI Cirkovce Cirkovc e Okroglo Krsko o Divaca Meline Tumbri HR Existing Konjsko o Committed Pince Heviz Zerjavinec B. Luka Ernestinovo Mostar Pecs Ugljevik Trebinje e HU BA 400 kv ME INTERCONNECTIONS Recently in operation or under construction New - Option Italy DC Link to Italy Sandorfalva Sombor Subotica Novi Sad S. Mitrovica Ribarevine e Podgorica Podgorica Tirana Tiran a Elbasan n AL Becescaba SR Arad Kosovo B Djerdap Florina Kardia Arachthos s Nis Sacalaz Nadab Portile de Fier Skopje 5 Stip Dubrovo Bitola MK GR Thessaloniki Rosiori Kozlo duj Tintareni Sofia West C. Mogila a Blagoevgrad N.Santa RO BG Isaccea Isacce a Varna Varna Dobruja Maritza 3 Hamidabat Babaeski TR Source: UCTE 10 Year Transmission Development Plan (2008)
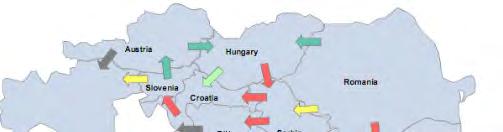
31 Net Electricity Flows


32 Renewable Energy Sources in SE Europe
33 RES in S.E. Europe RES in Gross Final Energy Consumption Target % % diff 2030 % diff 2020 Albania ? Bosnia ? Bulgaria % Croatia ? Greece % FYROM ? Romania % Serbia & Montenegro ? Balkans excl. Turkey Turkey ? All SEE EU %
34 Status of Renewable Energy Sources in S.E. Europe Solar Thermal Solar PV Wind Mini Hydro Biomass Geothermal Well developed markets in Greece, Cyprus and Turkey Approximately < 250 MW total PV installed, with Greece being the most developed market, followed by Bulgaria Key players: Greece, Turkey, Bulgaria, Romania Installed Capacity < MW Well developed in Western Balkans. Considerable Potential in Greece and Turkey Embryonic market for power generation but extensively used for house heating Large untapped potential in Greece, Turkey, Bulgaria, Romania, Serbia and Croatia

35 Macroeconomic Projections for S.E. Europe

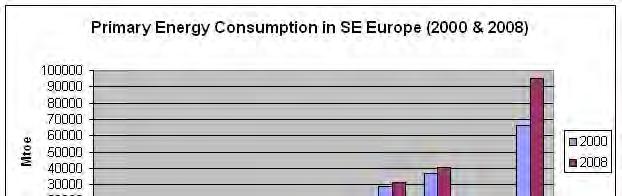
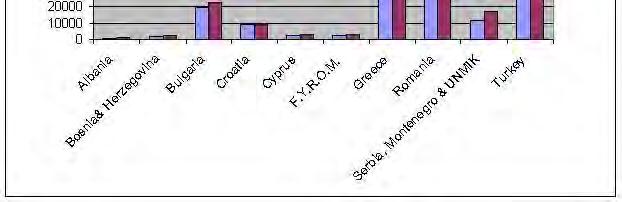
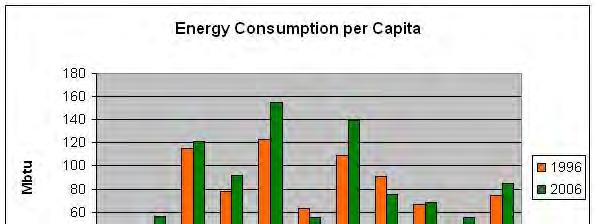
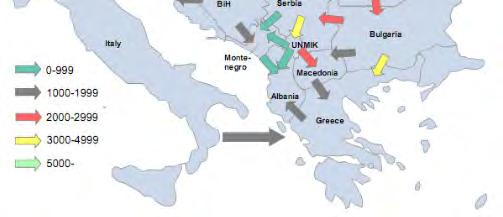
36 Primary Energy Consumption


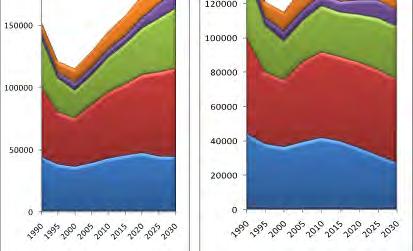
37 Electricity Generation in SE Europe ( )
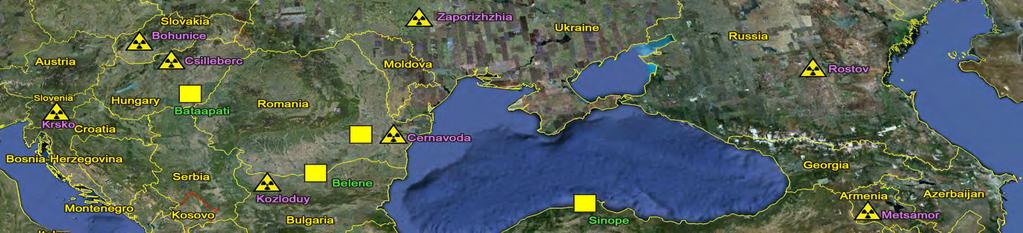
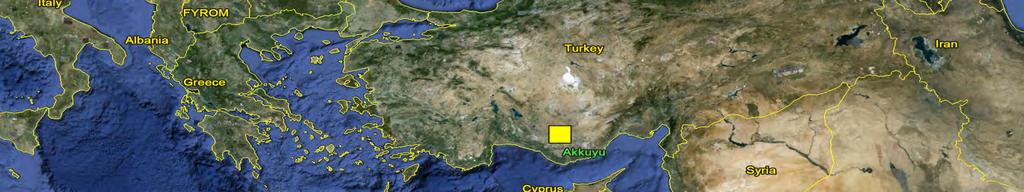
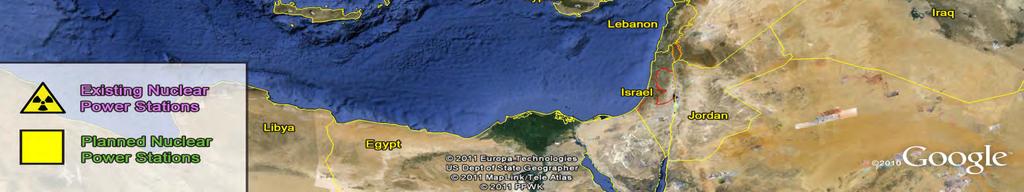
38 Operational and planned nuclear power plants in SE Europe
39 Significant Investment and Business Opportunities in SE Europe: Oil and Gas (upstream) Oil (midstream, downstream) Natural Gas (transmission, distribution, storage) Power Generation (Thermal Plants, CCP, Nuclear, Large Hydro) Electricity Transmission and Distribution RES (SWH, Photovoltaic, Wind,Mini-Hydro, Biomass, Geothermal) Total estimated investment regional potential ~ Euro billion (±10%)
40
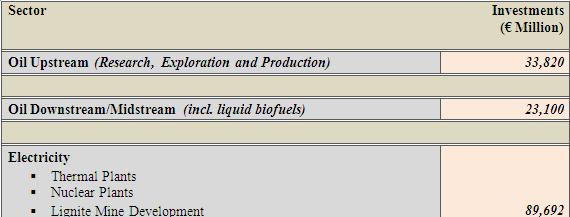
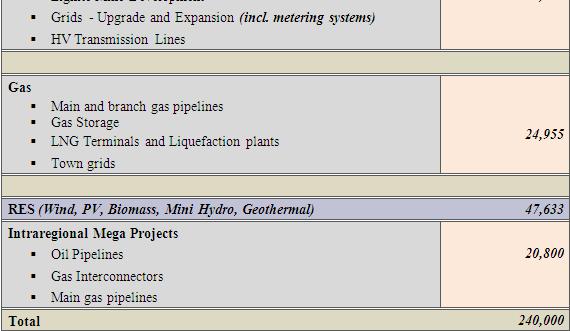
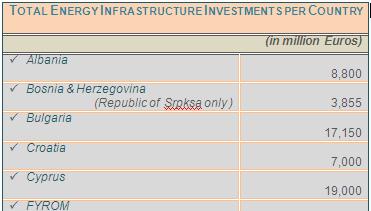
41 Total Energy Infrastructure Investment Per Sector
42 SE Europe Energy Outlook Key Messages Rising energy demand but at a much slower pace than previously forecasted Continuing strategic relevance of coal Urgent need to replace antiquated and low efficiency thermal electricity plants Inadequate progress in electricity and gas market liberalization Very high net hydrocarbon import dependence and unsatisfactory import diversification Need to replace and upgrade old and outdated refinery complexes Underdevelopment of R.E.S Low infrastructure inter- connectivity in oil & natural gas Positive investment climate with East Balkans and Turkey far ahead of Western Balkans in terms of actual investments and potential.
43 Study Sponsors & Supporters Event Sponsor: Study Sponsors: Study Supporters:
44 Thank you for your attention and your for patience!