INTEGRATION OF DEMAND SIDE MANAGEMENT WITH VARIABLE OUTPUT DG
|
|
|
- Vivien Veronica Gilbert
- 5 years ago
- Views:
Transcription
1 INTEGRATION OF DEMAND SIDE MANAGEMENT WITH VARIABLE OUTPUT DG 10th IAEE EUROPEAN CONFERENCE Vienna,7 9 September 2009 Seppo Kärkkäinen, Elektraflex Jussi Ikäheimo, VTT
2 2 Background of the presentation The presentation is mainly based on three projects: IEA DSM Agreement, Task XVII - Integration of Demand Side Management, Distributed Generation, Renewable Energy Sources and Energy Storages, Phase I finished, Phase II in near to start ( EU-DEEP, finished at the end of June 2009 ( ADDRESS, started in 2008, (
3 3 Content of the presentation Background and introduction to Task XVII Outputs Aggration business Concluding remarks Continuation of the Task
4 Objectives of the Task XVII of IEA DSM 4 The main objective of the Task is to study how to achieve the optimal integration of flexible demand with Distributed Generation, energy storages and Smart Grids, and thus increase the value of Demand Response, Demand Side Management and Distributed Generation and decrease problems caused by variable output generation (mainly based on RES) both in the physical electricity systems and at the electricity market The Task deals with distributed energy resources both at local (distribution network) level and at transmission system level where large wind farms are connected. The first phase of the Task was a scope study carried in cooperation with seven countries: Austria, Finland, Italy, Korea, Netherlands, Spain and USA
5 Problems caused by variable output generation 5 In electrical networks In some places, an increase in the network stresses are observed and needs for upgrades to provide greater capacity and flexibility to integrate the variable generation. It also increases the need for flexible, dispatchable, fast-ramping generation for balancing variations in load, generation and contingencies such as the loss of transmission or generation assets. At market: national and local balances between supply and demand are more complicated to manage with high levels of variable-output generation, which can increase total financial electricity costs.
6 Possible solutions 6 One solution to decrease the problems caused by the variable output of some DG is to add energy storages into the systems (centralised or distributed energy storages DS). Another way is to use flexibility in electricity consumption (demand response DR). In this sense distributed generation (DG), distributed energy storages (DS) and demand response (DR) can be seen as an integrated distributed energy resource (DER). Combining the different characteristics of these resources is essential in increasing the value of variable output generfationm in the energy market.
7 Smart-grid vision 7 The vision for the integration of DER is a smart-grid platform that would link a web of diverse generation sources, including a variety of fossil fuels and renewable and distributed sources, across the grid to a large set of consumers with possibilities for improved energy efficiency, local generation, controllable loads or storage devices. It is expected that the costs of a system with a better DER integration would be reduced compared to the present situation, because of higher energy efficiency and the inclusion of more renewables, but also of a lesser use of expensive peaking power and a better use of the transmission and distribution assets.

8 Challences of SmartGrid concepts 8
9 Overview of the DER situation 9 Next tables give a short overview of the DER situation in participating countries in 2008 including DG and RES-E Energy storages and Demand response
10 Installed capacity (in MW) for DG and renewables 10 Country Wind (MW) Solar (MW) CHP (MW) µchp (MW) Small hydro (MW) Others (MW) Estimated Total DG (MW) Finland 122 marginal 294 N/A 270 (<10 M W) < Italy (<25 M W) N/A * 9700 Netherlands N/A marginal Spain (<25 MW) ** USA *** minimal minimal 2000 Austria **** 1559 (<20 M W) Korea (<5 MW ) Notes * : In Italy, others are biogas (347 MW) and heat & enthalpy recovery (325 MW) **: In Spain, others are biomass, biogas and municipal solid waste fired units ***: In USA, total capacity almost MW, most over 20 MW units ****: In Austria, total µchp generation 6165 MWh, 1172 MW of small hydro capacity <10MW
11 Energy storages in participating countries 11 Pumped hydro Heat storage (large scale) Austria 6.5 GW / 11.2 TWh Yes Finland No About 17 GWh and 900 MW h (non-coincident) Yes Heat storage (consumer's level) Italy 7.6 GW/5 TWh N/A rare (2007) Korea 3.9 GW 699Gcal/h 649 MW (ice storage) Netherlands No Yes Not really Spain 2.7 GW No No
12 Existing DR options in the participating countries 12 Type of DR Country Note Time of use tariffs Real-time pricing Curtailment and direct load control programs * Finland Italy Spain Austria Netherlands USA Korea Finland Italy Spain Netherlands USA Italy USA Austria Retail and network ToU, usually for customers over 10 to 15MWh per year Night&Day tariffs for residential customers Compulsory above 50kW, otherwise optional exist exist exist Industrial and commercial consumers Some suppliers are offering this form of pricing for small customers if customer has an hourly meter [4] For large and medium consumers For large consumers For large consumers Exists and is viewed to increase Interruptible load deals with VHV grid large customers (by 7% of country peak load) Most of the DR programs are of this type exist * : Does not include emergency curtailment programs that exist in all the participating countries
13 13 Incentives and subsidies RES-E usually has incentives DR has also incentive based programs
14 Renewable energy incentives 14 Investment support Tax reduction Feed-in tariffs Fixed premium Country Finland Korea Finland Korea Italy Spain Austria Korea Italy Netherlands Spain Note 30% (40% for wind power) 30% ~ 80% (depend on the types) Certain generation forms do not pay electricity tax 10 % of investment in renewable energy can be deducted from corporate income tax CIP6 scheme with frozen eligibility; all-inclusive scheme for devices less than 1MW Optional if under 50MW PV solar Optional if under 50MW Green certificates Italy Quotas up to 6.8% (2012) of fossil generation & imports Quota Austria For balancing areas
15 Incentive based DR 15 These programs give customers load reduction incentives that are separate from, or additional to, their retail electricity rate, which may be fixed (based on average costs) or time-varying. The load reductions are needed and requested either when the grid operator thinks reliability conditions are compromised or when prices are too high (reliability or economy based DR). Most demand response programs specify a method for establishing customers baseline energy consumption level. Hence, observers can measure and verify the magnitude of their load response. Some demand response programs penalize customers that enrol but fail to respond or fulfil their contractual commitments when events are declared.
16 Typical incentive based programs 16 Direct load control: a program by which the program operator remotely shuts down or cycles a customer s electrical equipment (e.g. air conditioner, water heater, space heating) on short notice. Interruptible/curtailable (I/C) service: curtailment options integrated into retail tariffs that provide a rate discount or bill credit for agreeing to reduce load during system contingencies. Demand Bidding/Buyback Programs: customers offer bids to curtail based on wholesale electricity market prices or an equivalent. Emergency Demand Response Programs: programs that provide incentive payments to customers for load reductions during periods when reserve shortfalls arise. Capacity Market Programs: customers offer load curtailments as system capacity to replace conventional generation or delivery resources. Ancillary Services Market Programs: customers bid load curtailments in ISO markets as operating reserves.
17 DER business opportunities: market based DER 17 Typical examples for DG/RES are market price based feed-in tariffs and green certificates and for energy efficiency white certificates. Correspondingly price-based demand response refers to changes in usage by customers in response to changes in the prices they pay: Time-of-use (ToU): a rate with different unit prices for usage during different blocks of time, usually defined for a 24 hour day. ToU rates reflect the average cost of generating and delivering power during those time periods. Real-time pricing (RTP): a rate in which the price for electricity typically fluctuates hourly reflecting changes in the wholesale price of electricity. Customers are typically notified of RTP prices on a day-ahead or hourahead basis. Critical Peak Pricing (CPP): CPP rates are a hybrid of the ToU and RTP design. The basic rate structure is TOU. However, provision is made for replacing the normal peak price with a much higher CPP event price under specified trigger conditions (e.g., when system reliability is compromised or supply prices are very high).
18 DER business opportunities: market access via aggregators 18 One obstacle in the promotion of Demand Side Integration is that small and medium size customers usually don t have direct access to different types of market either due to the market rules or due to the high transaction costs in market entry. To decrease this kind of barriers a new type of service company, an aggregator, who acts as intermediator between distributed energy resources and energy markets, can emerge Three main types of aggregators can be defined: Demand aggregators collecting demand response (DR) from different types of flexible customers and offering the aggregated DR to different market actors Generation aggregators collecting and using a group of dispersed generators in aggregation and offering that into market. This kind of aggregated generation is often called Virtual power Plant (VPP). Combination of these. Internationally, aggregators are most common in the USA market. Also in Australia and Europe some aggregators exist

19 Example on aggregator business: Company EnerNOC 19 Supplier or network operator call request, payment capacity payment flexibility Enernoc end-users calls, payments measurement data analysis of DR potential and installations
20 Aggregator business models of the EU-DEEP project 20 In the EU-DEEP research project DR as well as DG and storages are employed at small and medium-sized customers. Three business models have been selected for development in view of valuing the benefits of DER in the system and of optimising this value: DER is installed locally where they have the most relevance, but are operated globally to optimise their value. Business model Aggregator Customers DER technology 1 electricity supplier medium commercial flexible demand, wind and industrial 2 electricity and small microchp gas supplier residential 3 energy service company (ESCO) medium commercial CHP and flexible demand
21 Business model 1: electricity retailer in the UK (GDF Suez) as an aggregtor 21 Transmission System Operator Electricity Retailer Aggregating load & production profiles Electricity Purchase Contracts Electricity Sales and demand response contracts Portfolio of DER UNITS based on Renewable Energy Resources - FINAL CONSUMERS in Commercial & Industrial sectors
22 22 Profits in the UK market The Aggregator manages this flexibility in order to generate profits, which are shared between him and the customers afterwards. In the UK, revenues from flexibility can be created in 4 different ways, by: offering frequency control services to the TSO (Provision of Frequency Control Services PFCS) reducing T&D charges (Triad Management TM), enabled in the UK by a specific Use-of-System charges called Triad, selling power on the wholesale electricity market during high price periods (Obtainment of the Best Price in the Market OBPM) improving the imbalance position during high penalty moments (Reduction of Imbalance Costs RIC).

23 Profitability of the business model 1 23

24 Business model 2 24 Heat loss µ-chp generators Balancing mechanism TSO flexibility Heat capacity ~ Power consumption Gas burner ~ Gas & electricity supplier Balancing power Power exchange
25 Aggregation of small customers 25 One of the main conclusion from the EU-DEEP project was that aggregation of the small customers is still challenging and is not usually profitable to the aggregator. In the new European ADDRESS project the concept of the aggregator is developed for the participation of domestic and small commercial consumers for the provision of demand side integration services to the different market participants. The next figure shows the basic concept of the ADDRESS architecture.
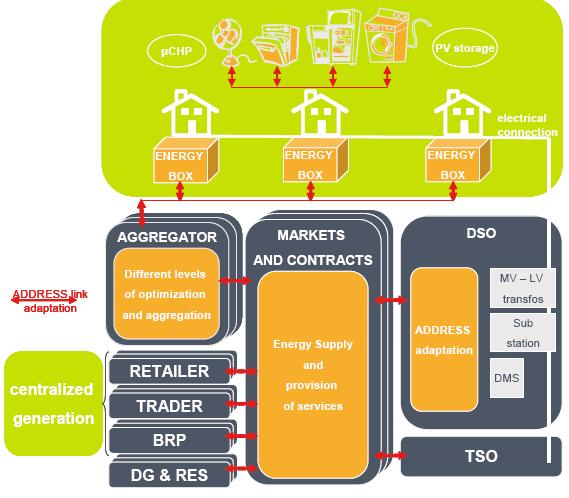
26 ADDRESS architecture 26
27 Concluding remarks from the IEA Task (1) 27 As a conclusion of the analysis it can be said that the increased penetration of DG as well as the technology and market developments result in new roles of the different stakeholders meaning new business environment and possibilities; on the other hand new tools are also needed in this new business area, metering and ICT technologies are developing rapidly, the above development will result in new products, services and pricing policies which can activate the more deep participation of final consumers in the market Successful integration means that different technologies in supply and demand side as well as in ICT are developed to the level where their integration is feasible both technically and economically and that regulation, policy and market give the successful framework for the integration.
28 Concluding remarks (2) 28 The summary on the situation of integration was developed on the basis of analysis and expert group opinions. The status of each item was assessed among the following: Early: Young: Existing: Mature: R&D Pilots / Field tests Available, at least one vendor or early adopters involved Widespread commercial
29 Status of integration (1) 29 Electricity supply Fossil fuel based technologies fuel cells micro chp conventional chp Renewables Wind pv small hydro waves, tidal biomass Renewable production forecasting Electrical energy storage energy management bridging power power quality Economic dispatch, SCUC software Resource planning techniques, tools Real-time grid operation tools Young Existing Mature Mature Existing/Mature Mature Young/Mature Young/Mature Young/Existing Young/Mature Existing/Mature Early/Existing Mature Mature Mature
30 Status of integration (2) 30 Electricity demand Communication, control and monitoring Many DSM techniques Automated DR devices Pricing granularity (smart rates) Small customers Large customers Consumer response and production Communication networks High-speed digital monitoring Generation Transmission (EU) Transmission (USA) Distribution Smart meters deployment Cyber-security Interoperability Functional Automation/Monitoring for large assets for DER Intelligence/Smart behaviour User/primary process feedback Intelligent agents and distributed controllers Communication semantic and content Mature Young Early Existing Early Mature Mature Mature Young Early Young/Existing Young/Existing Existing Mature Young Young Young/Existing Young Young/Existing
31 Status of integration (3) 31 Integration analytics Regulation, policy and business Modelling electricity system impacts Understanding relative costs and benefits Controlling and coordinating parts Good, real data How to capture benefits Incentives and subsidies How to pay for everything Taxation Aggregator business Young/Existing Existing Young Early / Young Young/Existing
32 IEA Work continuation: assessmengt the effects of the penetration of emerging DER technologies to different stakeholders and to the whole electricity system VTT TECHNICAL RESEARCH CENTRE OF FINLAND 32 The emerging DER technologies to be discussed include plug-in electric and hybrid electric vehicles (PEV/PHEV) different types of heatpumps for heating and cooling photovoltaic at customer premises micro-chp at customer premises energy storages (thermal/electricity) in the connection of previous technologies Other technologies seen feasible in years period, especially by The main Subtasks in the Task extension are Assessment of technologies and their penetration in participating countries Stakeholders involved in the penetration and effects on the stakeholders Assessment of the quantitative effects on the power systems and stakeholders Conclusions and recommendations

33 IEA work continuation 33 If you are interested in this work, please contact