FORECASTING PV MARKET ADOPTION AND DEMAND IMPACTS
|
|
|
- Franklin Bradley
- 5 years ago
- Views:
Transcription

1 14TH ANNUAL ENERGY FORECASTING MEETING / EFG SCOTTSDALE, ARIZONA MAY 18-20, 2016 FORECASTING PV MARKET ADOPTION AND DEMAND IMPACTS MIKE RUSSO


2 INSTALLED SOLAR CAPACITY New Jersey Installed capacity of 1,000 MW Solar Capacity Load Factor of 14.7% Population of 9 million Texas Installed capacity of 180 MW Annual load factor of 17.9% Population 27 million * December 2015; Source: EIA, NREL.» What explains this difference?

3 RESIDENTIAL AVERAGE PRICE * December 2015; Source: EIA» Not surprisingly, the states with the highest electricity rates tend to be the states with the greatest solar adoption.

4 SOLAR REPORT CARD» Site grades all 50 states based on state level incentives, tax credits, electricity prices and market conditions. Dark Green A, Light Green B, Yellow C, Orange D, Red - F * Pro-solar advocacy group; Solar Power,


5 SOLAR SYSTEM COST TRENDS Source: NREL U.S. Dept. of Energy, Photovoltaic System Pricing Trends, Aug 2015.
6 PROJECTED SYSTEM COSTS 10% Annual Decline Sources: NREL, Solar Energy Industries Association (SEIA)

7 VARIATION IN SOLAR RADIATION

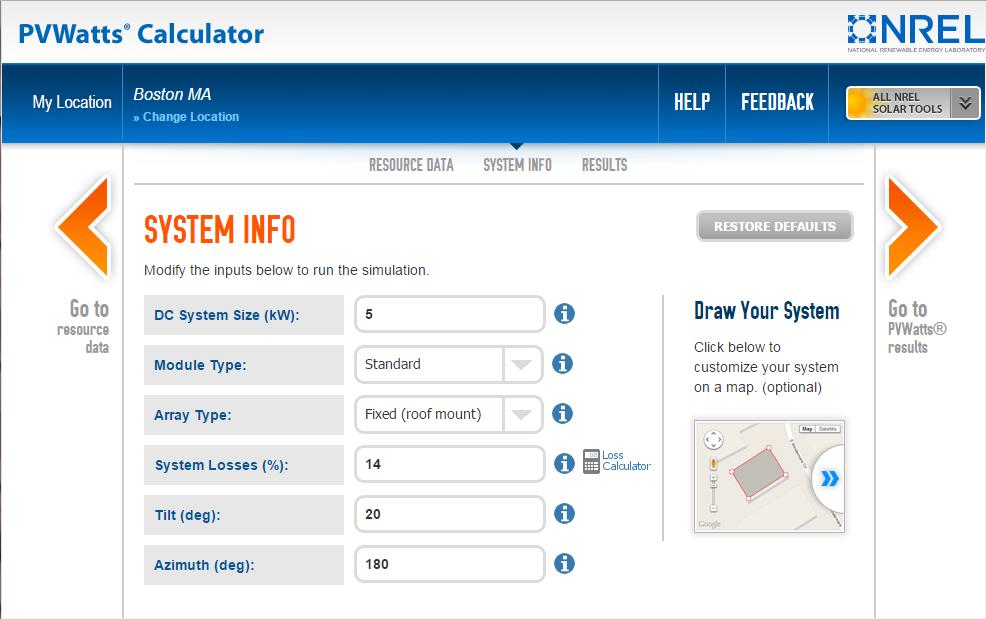
8 NREL: PV WATTS SOLAR CALCULATOR

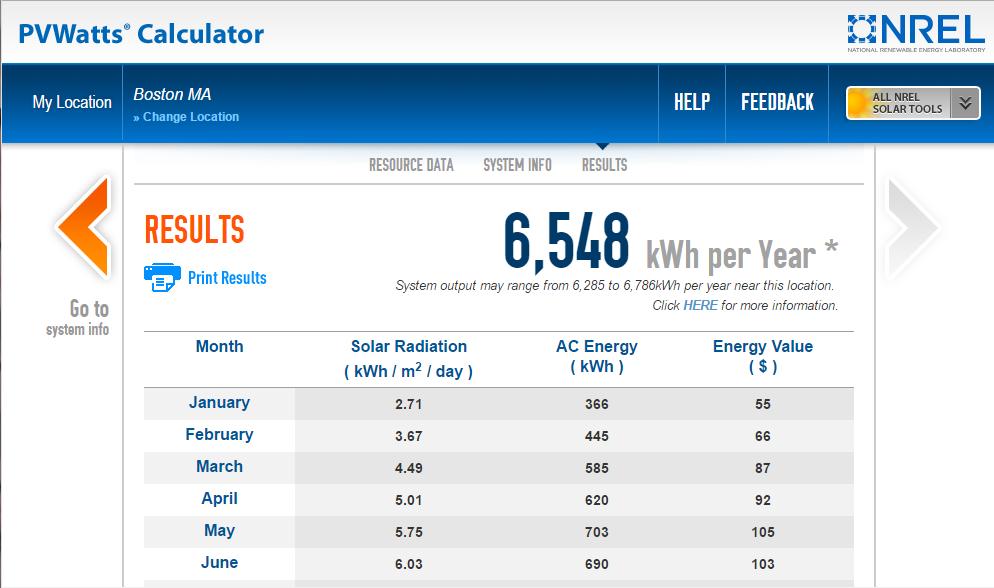
9 SOLAR LOAD SHAPE» 5 kw roof mounted system in Boston, MA» 6,548 kwh generated annually


10 VARIATION IN SYSTEM GENERATION» Identical 5kW roof mounted system» Annual generation: Albuquerque, NM: 8,509 Seattle, WA: 5,509
11 RESIDENTIAL ROOFTOP SOLAR SATURATION CA AZ CO VT NV
12 ADOPTION DRIVEN BY CUSTOMER ECONOMICS Current Saturation Levels vs. Return on Investment
13 FACTORS THAT IMPACT CUSTOMER ECONOMICS 1. System Cost 2. Cost Incentives Federal and state tax credit, state incentives ($ per kw) 3. Retail electric rates and rate structure 4. Generation Potential physical unit location 5. Generation Incentives - treatment of excess generation (output not directly used by the customer) Net energy metering Solar output incentives ($ per kwh)
14 STATE COMPARISON OF SYSTEM ECONOMICS System Characteristics Cost Nevada Hawaii Mass Vermont Florida New Mexico California New Jersey Arizona Size (kw) Cost per watt $4 $4 $4 $4 $4 $4 $4 $4 $4 Total cost $20,000 $20,000 $20,000 $20,000 $20,000 $20,000 $20,000 $20,000 $20,000 State Tax Incentive $0 $5,000 $1,000 $0 $0 $2,000 $0 $0 $1,000 Utility Incentive $1,470 $0 $0 $1,250 $0 $0 $4,250 $0 $4,000 Total cost before Fed incentive $18,530 $15,000 $19,000 $18,750 $20,000 $18,000 $15,750 $20,000 $15,000 Fed tax credit 30% 30% 30% 30% 30% 30% 30% 30% 30% Fed credit $5,559 $4,500 $5,700 $5,625 $6,000 $5,400 $4,725 $6,000 $4,500 Total out of pocket cost $12,971 $10,500 $13,300 $13,125 $14,000 $12,600 $11,025 $14,000 $10,500 Savings System Load Factor annual generation (kwh) 8,791 7,941 6,601 6,339 7,406 8,905 7,909 6,406 8,542 retail rate (per kwh) $0.115 $0.300 $0.179 $0.170 $0.119 $0.133 $0.220 $0.167 $0.126 Annual bill savings $1,011 $2,385 $1,180 $1,078 $884 $1,186 $1,740 $1,067 $1,080 Performance Savings $0 $0 $0 $0.03 $0 $0 $0 $0 $0 Annual Perforance Savings $0 $0 $0 $190 $0 $312 $0 $1,000 $0 Total savings $1,011 $2,385 $1,180 $1,268 $884 $1,498 $1,740 $2,067 $1,080 Economics Simple Payback Return on investment 7.8% 22.7% 8.9% 9.7% 6.3% 11.9% 15.8% 14.8% 10.3% Res Saturation 0.9% 13.0% 0.9% 1.3% 0.1% 0.8% 2.9% 1.0% 2.3% * Estimated in October 2015 things change quickly (Nevada and Vermont have both dropped incentives)
15 GMP RESIDENTIAL PAYBACK CURVE Given historical and projected system size, costs, electric rates, generation potential, and incentives we construct a simple payback curve that spans time.
16 MODELING SOLAR ADOPTION» Relate monthly saturation (solar customers / total customers) to simple payback Payback incorporates declining solar system costs, federal and state tax and other incentives, projected electricity costs, and payment for excess generation. Cubic model specification used to impose S-shaped curve. Variable Coefficient P-Value CONST % ResPayback % ResPayback Sq % ResPayback Cb % AR(1) % MA(1) % Model Statistics Adjusted R-Squared Mean Abs. % Err. (MAPE) 1.47%
17 WHY THE CUBIC SPECIFICATION Linear with respect to payback Variable Coefficient StdErr T-Stat P-Value CONST % Payback % Model Statistics Adjusted R-Squared Mean Abs. % Err. (MAPE) 28.53%
18 WHY THE CUBIC SPECIFICATION Add a squared term Variable Coefficient StdErr T-Stat P-Value CONST % Payback % Payback Sq % Model Statistics Adjusted R-Squared Mean Abs. % Err. (MAPE) 13.21%
19 WHY THE CUBIC SPECIFICATION Add a squared and cubed term Variable Coefficient StdErr T-Stat P-Value CONST % Payback % Payback Sq % Payback Cb % Model Statistics Adjusted R-Squared Mean Abs. % Err. (MAPE) 3.78%
20 SOLAR CUSTOMER FORECAST
21 PAYBACK SCENARIOS Cost and rate scenarios result In alternative saturation paths.

22 POTENTIAL PROBLEM WITH SHARE MODEL» Significant change in incentives or rate treatment cause kinks in the payback curve which in turn results in kinks in the saturation curve. Expiration of utility incentive Implies drop in saturation
23 SOLUTION: COMBINE A SHARE MODEL WITH A MONTHLY ADOPTION MODEL» Model monthly adoption as a function of payback» Use the adoption model to forecast monthly installations through the kink.
24 INSTALLED CAPACITY FORECAST (MW) Capacity Fcst (MW) = Solar Customers x Average System Size (MW)
25 CAPACITY FORECAST TO ENERGY FORECAST Month LdFct Jan 9.1% Feb 12.5% Mar 15.8% Apr 17.4% May 19.3% Jun 19.4% Jul 19.0% Aug 18.0% Sep 14.9% Oct 11.4% Nov 7.3% Dec 6.4%

26 IMPACT ON SYSTEM PEAK» MetrixLT is used to determine the solar impact on system peak Subtract solar load hourly load forecast from system load forecast

27 TIMING MATTERS Show all of system before solar profile 720 MW at 2: MW at 2: MW at 5:00» By 2022, solar load growth shifts peak demand from 2:00 pm to 5:00 pm» Peak savings = 34 MW (720 MW at 2:00 pm 686 MW at 5:00 pm)
28 SUMMARY» Not surprisingly economics drives solar adoption» Simple payback as proxy for customer economics seems to work relatively well in explaining solar saturation when incorporated into a cubic model specification» The model provides a rich framework for evaluating alternative solar adoption paths» In terms of peak demand impact, system shape matters
29 QUESTIONS?

30 THANK YOU BOSTON Michael Russo Ext