Hydrologic, Hydraulic, and Ecological Modeling Issues and Implementation for the Blind River Fresh Water Diversion Project
|
|
|
- Sandra Boone
- 5 years ago
- Views:
Transcription


1 Hydrologic, Hydraulic, and Ecological Modeling Issues and Implementation for the Blind River Fresh Water Diversion Project Restore America s Estuary Conference November 16, 2010 Michael Morgan, P.E. CFM Kirk Westphal, P.E. Ashok Bathulla, P.E. CFM

2 Purpose of Hydrologic and Hydraulic Modeling Understand the project area hydrology Quantify the movement of water through the swamp and the network of drainage canals Evaluate alternatives to improve the hydroperiod Confirm that proposed improvements will not have adverse flooding impacts

3 Study Area Hydrology


4 Connect Analyses to Field Conditions

5 Existing Land Use Land Use Type Percent Area (%) Forest Land 7.69 Water body 0.28 Wetland Cropland/Agriculture Commercial/Industrial 4.31 Residential 3.04 Others 0.73

6 Approach Considerations Existing hydrologic and hydraulic performance Location and magnitude of diversion flows Frequency of dry and wet periods Hydraulic residence time Distribution of water and nutrients Potential for offsite flooding Analyses Long term, multiyear analysis to capture above average and below average precipitation conditions Average hydrologic conditions Average year Extreme storms Tools Engineering Calculations Hydrologic and Hydraulic Modeling HEC-HMS HEC-RAS Hydrodynamic Modeling EFDC
7 Engineering Calculations Schematic


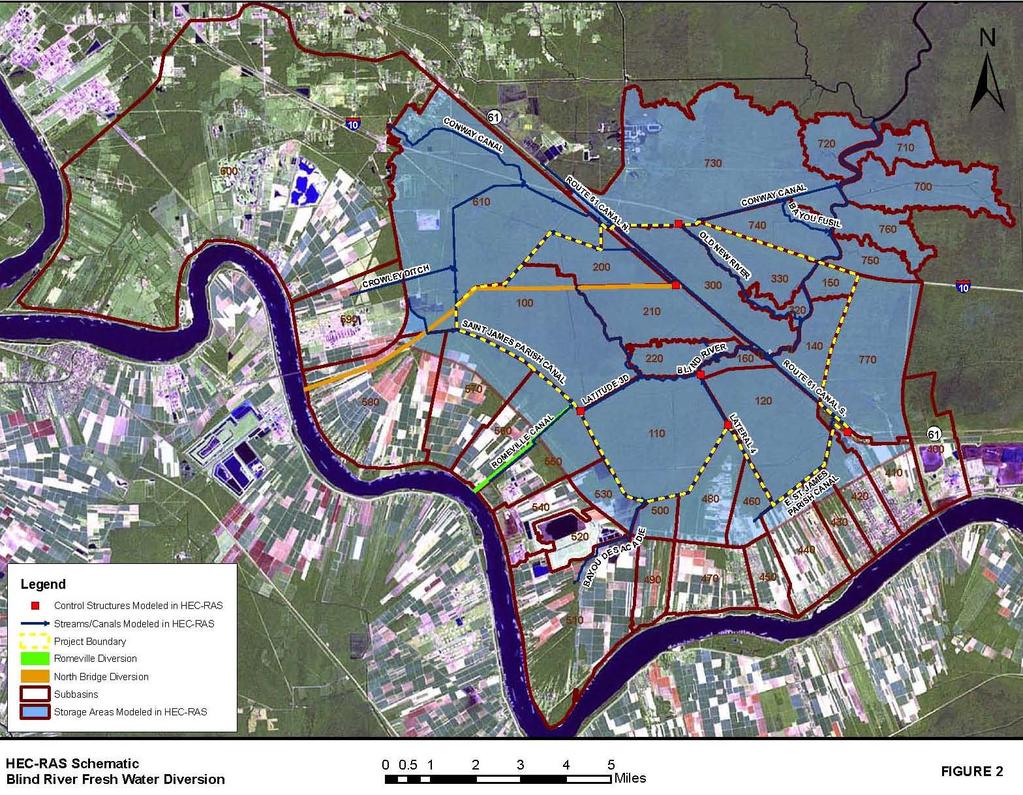
8 HEC-RAS Schematic
9 Existing Flow Patterns
10 Lake Maurepas Stages Review of Lake Maurepas stages indicates that downstream conditions influence flows and stages in the study area River: BLIND RIVER Reach: BLIND RIVER 1 RS: Legend Stage Stage (ft) Feb Apr Jun 2003 Aug Oct Dec Date
 2000 0-2000 Flow -4000 12 17 22 27 04 09 14 19 24 29 03 Feb2003 Mar2003 Apr2003 Time HEC-RAS simulates positive and negative flow in the Blind River, which is")
11 Blind River Flow Upstream of I River: BLIND RIVER Reach: BLIND RIVER 3 RS: Legend Flow (cfs) Flow Feb2003 Mar2003 Apr2003 Time HEC-RAS simulates positive and negative flow in the Blind River, which is consistent with field observations following periods of rainfall and high water levels at Lake Maurepas

12 Advantages of Improved Drainage with Berm Cuts Stage (ft) Improved Drainage Storage Area: 73 Existing Conditions Aug2003 Sep2003 Oct2003 Time
13 Diversion Flow Options Test system response with diversion flows of varying magnitude Reduce backflow from Lake Maurepas Deliver nutrients and sediment Reduce frequency of high water levels Flow (cfs) River: BLIND RIVER Reach: BLIND RIVER 3 RS: Legend Baseline Flow - CSwGapsTst2 500 Flow cfs - BRCSw500div Diversion Flow CSwGaps2aDiv2 cfs Diversion Feb2003 Mar2003 Apr2003 Time
14 Screening Diversion Magnitude Annual Average Diverted Flow (ac-ft/yr) 2,000,000 1,800,000 1,600,000 1,400,000 1,200,000 1,000, , , , ,000 0 Existing with Berm Cuts Total Annual Total Diversion Diversions Flow Total Diversion Capacity (cfs) Diversion to North Bridge Canal Diversion to Romeville Canal Diversion to North Bridge and Romeville Canals Depth Exceedance Frequency 100% 90% 80% 70% 60% 50% 40% 30% 20% 10% 0% Existing with Berm Cuts Water Depth Exceedence (Area 100) Diversion to Northbridge Canal & Romeville Canal HU Total Diversion Capacity (cfs) Dryout Frequency: 0% 0.5 ft 1.0 ft 1.5 ft 2.0 ft Existing with Berm Cuts Diversion Average to North Annual Bridge Freshwater Canal & Romeville Inflow Canal Existing with Berm Cuts Diversion to Average North Bridge Water Canal Depth & Romeville Canal Annual Avergae Inflow (ac-ft/yr) Total Diversion Capacity (cfs) 100 HU1 200 HU2 210/220 HU3 110 HU4 120/160 HU HU6 140/150 HU7 Long-Term Average Water Depth (ft) Total Diversion Capacity (cfs) 100 HU1 200 HU2 210/220 HU3 110 HU4 120/160 HU HU6 140/150 HU7 Frequency Above Lake Maurepas 100% 80% 60% 40% 20% 0% Existing with Berm Cuts Diversion Frequency to North Above Bridge Lake Canal & Maurepas Romeville Canal Total Diversion Capacity (cfs) 100 HU1 200 HU2 210/220 HU3 110 HU4 120/160 HU HU6 140/150 HU7 Total TSS to Swamp
 Existing with Berm Cuts Diversion to Romeville Canal 100 HU1 200 HU2 210/220 HU3 110 HU4 120/160 HU5 300-330 HU6 140/150 HU7 100% Multiple diversion")
15 Comparing Diversion Locations Diversion to North Bridge Canal 100% Diversion location and magnitude appeared to distribute benefits differently Frequency Above Lake Maurepas 80% 60% 40% 20% 0% Total Diversion Capacity (cfs) Existing with Berm Cuts Diversion to Romeville Canal 100 HU1 200 HU2 210/220 HU3 110 HU4 120/160 HU HU6 140/150 HU7 100% Multiple diversion locations and rates considered in final array of alternatives Frequency Above Lake Maurepas 80% 60% 40% 20% 0% Total Diversion Capacity (cfs) Existing with Berm Cuts Diversion to North Bridge Canal & Romeville Canal 100 HU1 200 HU2 210/220 HU3 110 HU4 120/160 HU HU6 140/150 HU7 100% Frequency Above Lake Maurepas 80% 60% 40% 20% 0% Total Diversion Capacity (cfs) 100 HU1 200 HU2 210/220 HU3 110 HU4 120/160 HU HU6 140/150 HU7
16 Flow Patterns With Project
17 Metrics for Evaluating Model Results Annual increase in freshwater flows and volumes Frequency of wet and dry conditions (120 days) Hydraulic residence time Frequency of backflow reduction Flux of nutrients, TSS, and salinity Water Depth (ft) TSS Loading (mm/yr) Long-Term Average Water Depth (ft) Existing with Berm Cuts Diversion to North Bridge Canal & Romeville Canal Average Water Depth Metric Analysis Summary for Average Annual TSS Loading (mm/yr) No Sea Level Rise Total Diversion Capacity (cfs) Metric Analysis Summary for Average Annual Water Depth, (ft) 0.0 No Sea Level Rise 4.0 Alternative 1 Alternative 2 Alternative 3 Alternative 4 Alternative 5 Alternative 6 Scenario Alt 1 = Romeville Diversion (1,500 cfs) Alt 2 = Romeville Diversion (3,000 cfs) Alt 3 = South of Hwy 70 Bridge Diversion (1,500 cfs) 3.0 Alt 4 = South of Hwy 70 Bridge Diversion(3,000 cfs) Alt 5 = Total Diversion (1,500 cfs); Romeville Diversion (750 cfs)/south of Hwy 70 Bridge Diversion (750 cfs) Alt 6 = Total Diversion (3,000 cfs); Romeville Diversion (1,500 cfs)/south of Hwy 70 Bridge Diversion (1,500 cfs) Existing Alternative 1 Alternative 2 Alternative 3 Alternative 4 Alternative 5 Alternative 6 Conditions; No Berm Cuts; Total Scenario Diversion = 0 cfs Alt 1 = Romeville Diversion (1,500 cfs) Sub-basins Alt 2 = Romeville Diversion (3,000 cfs) Alt 3 = South of Hwy 70 Bridge Diversion (1,500 cfs) 210, Alt 4 = South of Hwy 70 Bridge Diversion(3,000 cfs) 120, , 320, 330 Alt 5 = Total Diversion (1,500 cfs); Romeville Diversion (750 cfs)/south of Hwy 70 Bridge Diversion (750 cfs) Alt 6 = Total Diversion (3,000 cfs); Romeville Diversion (1,500 cfs)/south of Hwy 70 Bridge Diversion (1,500 cfs) 140, 150 HU1 100 HU2 200 HU3 210/220 HU4 HU5 110 HU6 120/160 HU /150
18 Addressing Hydrologic, Hydraulic and Ecological Issues for Restoration Projects Strive to develop a comprehensive understanding of contributing processes Allow project specific issues to drive selection of the analysis approach and tools Connect hydrologic and hydraulic analysis with available information from multiple perspectives