SCG Consulting Business Plan
|
|
|
- Arron Heath
- 5 years ago
- Views:
Transcription


1 SCG Consulting Business Plan Octobre 2012 Marchés s charbonniers mondiaux : croissance et défisd Sylvie Cornot Gandolphe 14 janvier 2013
2 1. La demande de charbon: une croissance forte, mais beaucoup d incertitudes 2. L offre est abondante 3. Le commerce est en plein développement 4. Volatilité des prix du charbon
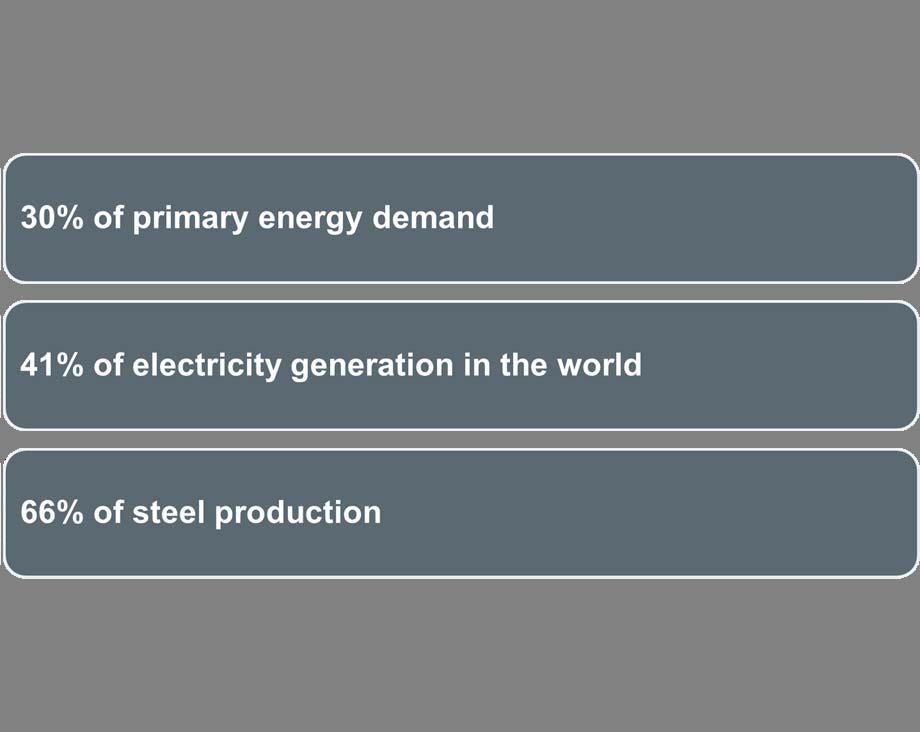
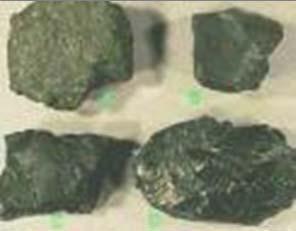
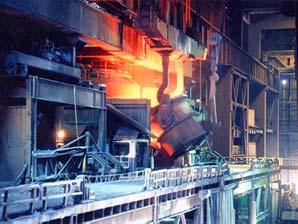
3 HARD COAL: subdivided into Steam coal (electricity/industry) Coking coal (iron and steel industry) Energy content > 4500 kcal/kg, water content < 35% Worldwide traded commodity BROWN COAL or LIGNITE Energy content < 4500 kcal/kg, water content > 35% Hence only regional transport/utilization on local markets

4
5 Share Source: International Institute for Applied Systems Analysis (IIASA)

 2011 data after oil")
6 Source: IEA/BP At global level, coal is the second primary energy source (30%), and before natural gas (24%) 2011 data after oil (33%)


7 Global coal consumption growth Other energy sources growth Source: BP
 consumed in 2011")

8 3700 Mtoe (about 8 Gt) consumed in 2011 Dominated by China, US and India Source: IEA, BP
9

10 Source: IEA


11 Source: IEA World Energy Outlook 2012 At global level, an increase by around 21% between 2010 and Almost all the growth before 2020 Three countries, China, India and Indonesia, account for nearly 90% of the growth. A continued shift in coal demand from OECD to non OECD countries
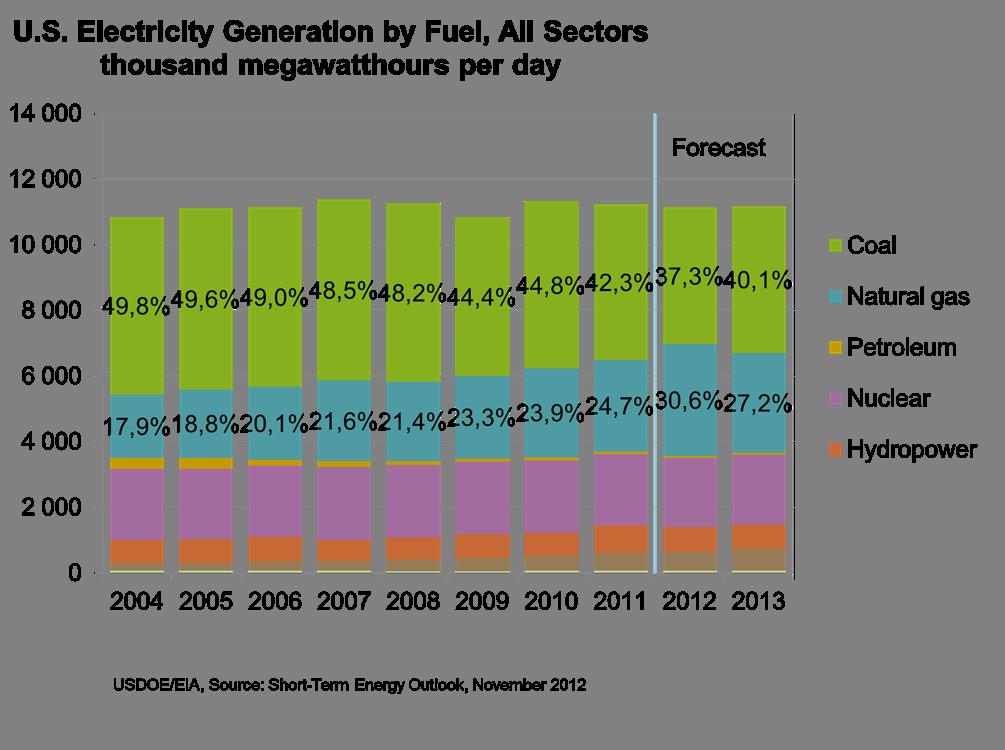
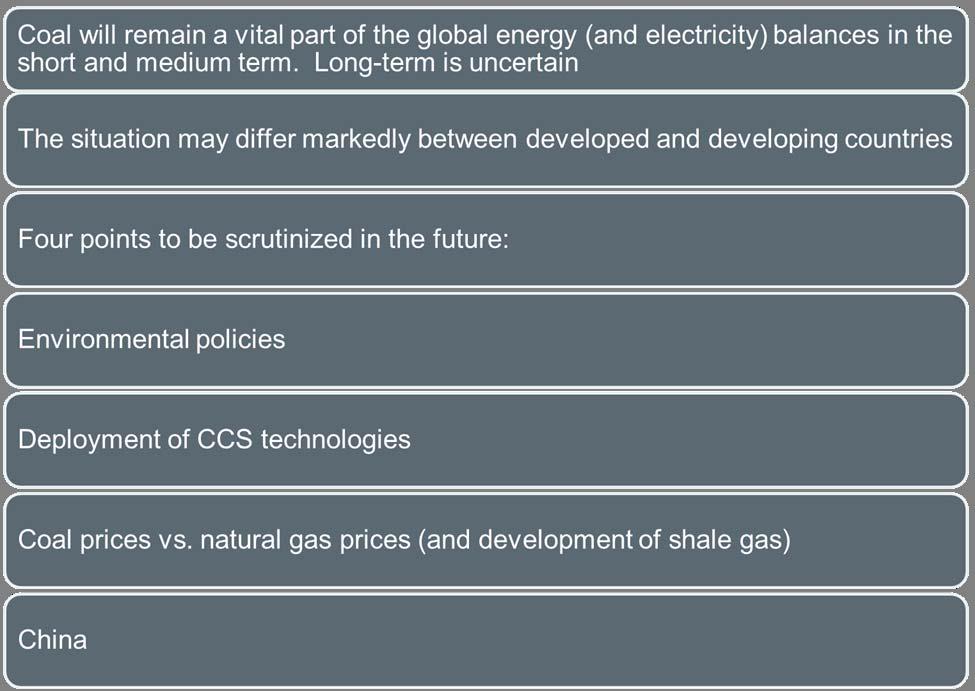
12 Future electricity demand and electricity mix (nuclear?, renewables, shale gas/lng) Competition between coal and gas in electricity generation, linked to international gas prices vs. coal prices and CO 2 prices Availability of coal & cost/infrastructure issues Climate change policies, plus CO 2 pricing via taxes or emission trading schemes (20, 50, 100 /t?) Development and deployment of clean coal technologies (efficient electric power plants and Carbon Capture and Storage CCS)
13 Critical influence of government policies on future coal demand New Policies Scenario: + 21% compared with 2010 Current Policies Scenario: + 59% 450 Scenario: 33%
14
15 Worldwide Distribution of Coal Reserves (Btce) Europe CIS 106 PR China 7 Northamerica Lignite Hard coal 1 Central- and South America 9 Africa 24 India Other Asia 8 Gtce Gt R/P Total: 712 Btce Hard coal Lignite Of which Hard coal: Btce TOTAL 720.7Lignite: Btce Australia New Zealand Source: Federal Institute for Geosciences and Natural Resources (BGR), Hanover, 2008 Abundant and well distributed


16 Global coal production totaled about 7.7 Gt in 2011 High increase in steam coal production over the past decade: +82% Source: IEA Coal Information, 2012

 Source:")
17 Top 10: 6.9 Gt (90% of global hard coal and China and US: 58% lignite production) Source: IEA, Coal Information 2012


18 Source: IEA World Energy Outlook 2008, Reference Scenario Coal production reaches about 4200 Mtoe by 2035 (about 8.5 Gt) Most of the growth occurs in non OECD countries (China, India and 2020 Decline in OECD.( 0.6% over the period ) Indonesia), before Source: IEA World Energy Outlook 2012, New Policies Scenario
19
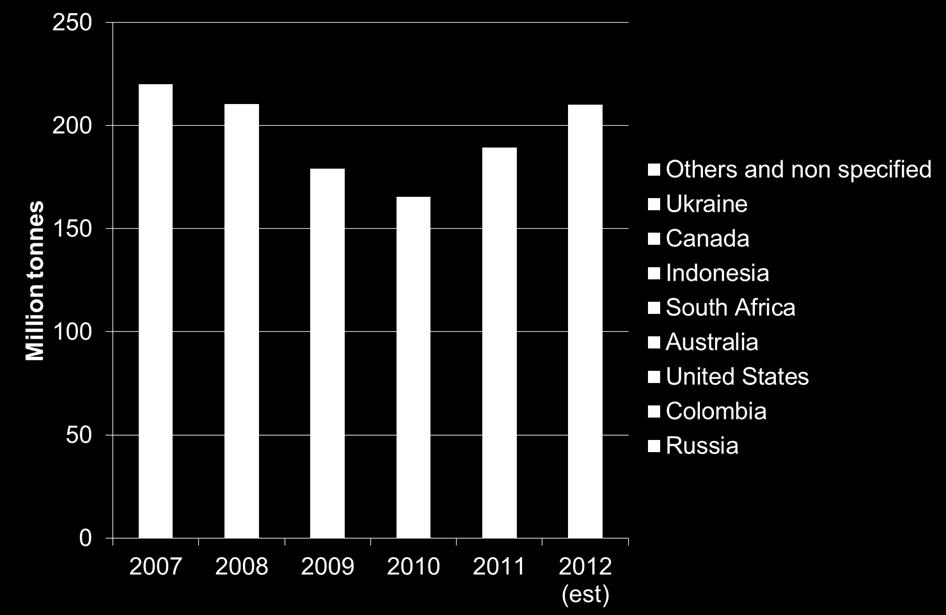
, 15% of global hard coal production Rapid increase in seaborne steam coal trade (850 Mt in")
20 Source: IEA, VDKI, estimates 1.2 Gt traded in 2012 (of which 1.1 Gt by sea), 15% of global hard coal production Rapid increase in seaborne steam coal trade (850 Mt in 2012) Seaborne coking coal trade: 254 Mt in 2012
21 Seaborne Steam coal exports: 791 Mt Coking coal exports: 238 Mt Source: IEA 21


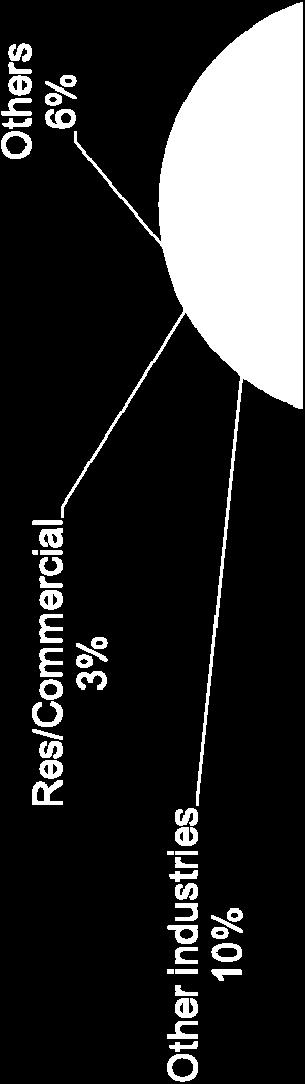
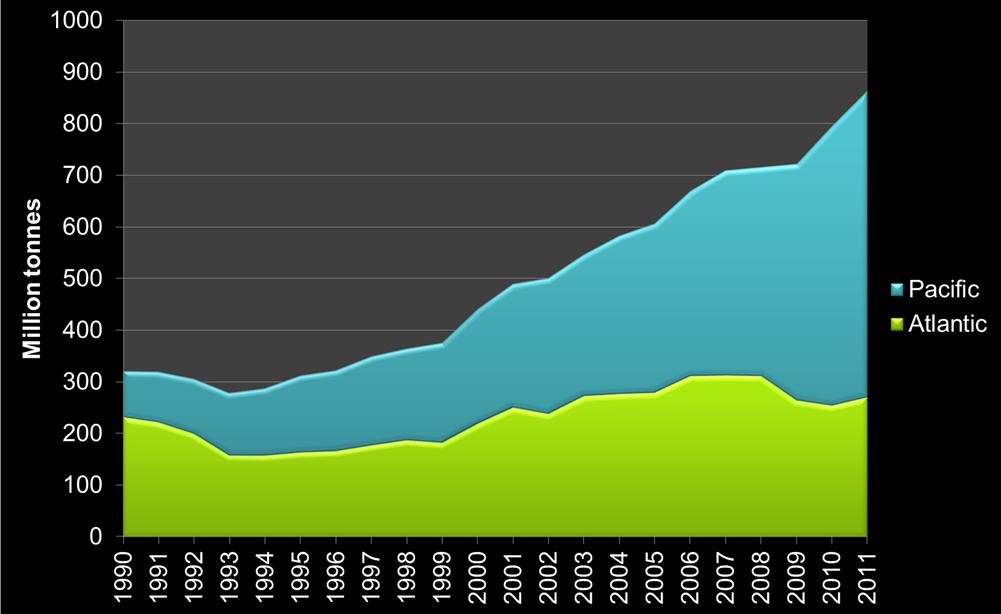
22 Source: VDKI Steam coal, 2 basins: Pacific and Atlantic Coking coal: a global market
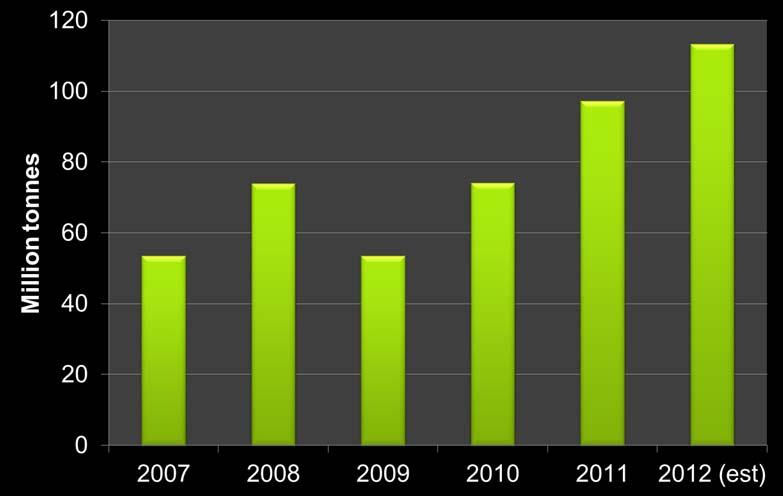
23 A huge change in 2007/2008: High increase in coal demand by the Pacific basin: Japan and Korea, but also China, and rising Indian imports The Pacific basin was no more balanced More imports from traditional Atlantic suppliers (South Africa) A very tight market 2008/2009: Shift in South African coal export patterns (India vs. Europe) 2009: China became a net importer to a large extent and almost withdrew from the export market to 2012: Fast increase of China s imports 2011/2012: Large rise in US exports to traditional (Europe) and new customers (China, India) A supply glut!

24 A major player. A leading role in the prices past three years on global coal market and international coal
25
26
27
28

29 Ports proposed in Washington and Oregon States could add 150 Mtpa of export capacity

30 European coal imports
31
32
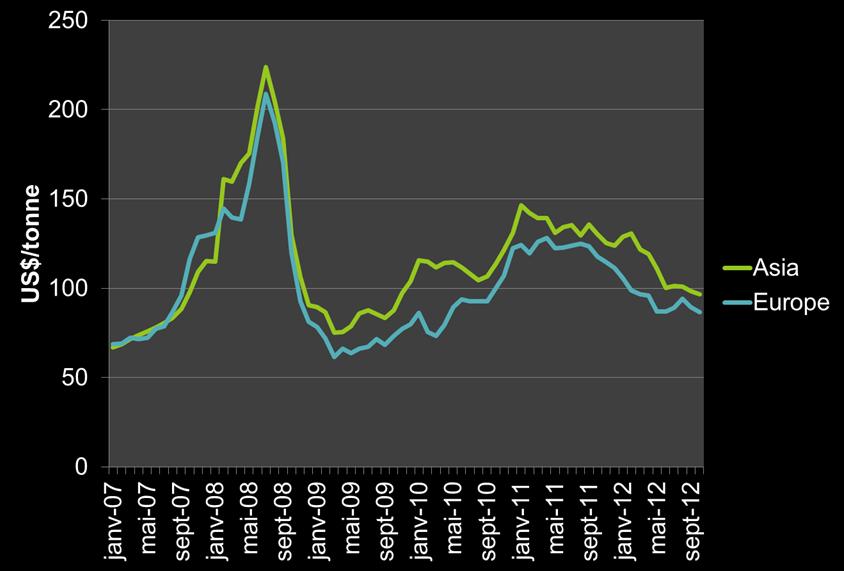
33 Underlying Market S/D balance sets the trend on LT Coal Supply & Demand Cost curve and rising production cost Ocean Freight Rates Coal Price? Port Congestion Financial market Other energy prices and CO2 Consolidatio n Speculation and other energy prices impact on short term
34

35 Comparison of fossil fuel prices in Europe Coal is very competitive vs. natural gas.

36