The Corning Primary Aquifer -One of 18. NYSDEC Primary Aquifers in New York
|
|
|
- Jacob Fowler
- 5 years ago
- Views:
Transcription

1 The Corning Primary Aquifer -One of 18 NYSDEC Primary Aquifers in New York

2 NYSDEC Primary and Principal Aquifers PRIMARY AQUIFERS (18) Highly productive aquifers presently being utilized by major municipal water-supply systems (ex. cities). PRINCIPAL AQUIFERS Highly productive aquifers known to be highly productive or whose geology suggests abundant potential water supply but presently are not extensively used.
3 SOLE SOURCE AQUIFERS (USEPA) Requires USEPA to review proposed projects that will receive federal financial assistance. This designation is mostly symbolic--to draw attention to the aquifer
4 Corning Primary Aquifer, Steuben County
 in northern")
5 SOME AQUIFER DEFINITIONS Bedrock (shale) Aquifer typeconfined, unconfined Recharge and discharge areas Direction of groundwater flow Groundwater/surface water interaction Water use Well yields Water quality Artesian- name derived from former province (Artois) in northern France

6 GROUNDWATER AND SURFACE WATER A SINGLE RESOURCE Traditionally, management of water resources has focused on surface water or groundwater as if they were separate entities. As development of land and water resources increases, it is apparent that development of either of these resources affects the quantity and quality of the other.
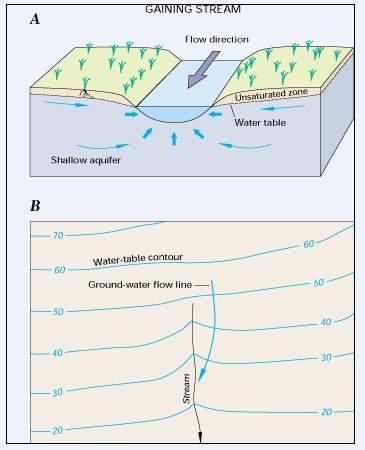
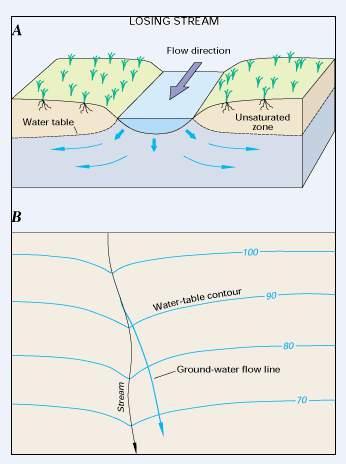
7 GROUNDWATER/ SURFACE-WATER INTERACTIONS Streams interact with groundwater in three basic ways: 1.Streams (typically the main stem) gain water from inflow of groundwater through the streambed (gaining stream) 2.Tributaries typically lose water to groundwater by outflow through the streambed (losing stream) 3.Or they do both, gaining in some reaches and losing in other reaches
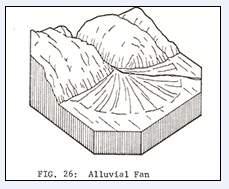
8 Sources of Recharge-Tributaries typically lose water on their fans

9 Hydrograph-separation analyses determine the portions of streamflow that is derived from groundwater seepage into the channel and that which is storm runoff

10 In the Northeast, most streamflow is derived from groundwatergw typically contributes from 55 to 70 percent of annual streamflow
. Recharge is equal to discharge at the stream.")
11 Under natural conditions (non pumping), groundwater discharges into the main stem stream in a valley (Cohocton, Tioga, and Chemung Rivers). Recharge is equal to discharge at the stream.
 groundwater that would otherwise have discharged to the stream If the pumping rate is large")

12 Streamflow reductions (or depletions) caused by pumping As the cone of depression expands outward from the well, the well begins to capture (intercept) groundwater that would otherwise have discharged to the stream If the pumping rate is large enough and/or the pumping well is close to the stream, it will cause water to flow from the stream to the aquifer, a process called induced infiltration of streamflow. Streamflow depletion is equal to the sum of captured groundwater discharge and induced infiltration

13 Streamflow Response to Groundwater Pumping

14 Springs are Very Vulnerable to Effects of Large Groundwater Withdrawals Springs typically are present where the water table intersects land surface. The constant source of water at springs leads to the abundant growth of plants and, in many times, to unique habitats. A small GW level decline can dry up a spring.

15 Wetlands are Also Sensitive to Effects of Large Groundwater Withdrawals Wetlands are, in many cases, groundwater features. Wetlands can receive groundwater inflow, recharge groundwater, or do both
16 Effects of Groundwater PumpingNeed to Consider Cumulative Effects of Multiple Pumping Wells Considered individually, one well may have a small effect on streamflow and groundwater levels, but when evaluated together on the scale of an entire aquifer, multiple wells can have substantial impact on streamflow and GW levels. To determine the cumulative effects of pumping, it is necessary to take a basinwide perspective.

17 Effects of Cumulative Pumping
18 Sustainability of Groundwater Resources Resource sustainability has proved to be an elusive concept to define in a precise manner and with universal applicability. The definition of sustainable long-term yield has evolved (expanded) through the years. More recently, groundwater sustainability is defined as development and use of groundwater in a manner that can be maintained for an indefinite time without causing unacceptable environmental, economic, or social consequences. The definition of unacceptable consequences is largely subjective and may involve a large number of criteria.
19 Another term, but less popular, is Safe Yield a term that is narrower in scope than Sustainability The term safe yield commonly is used in efforts to quantify sustainable groundwater development. The development of a groundwater system is considered to be "safe" if the rate of groundwater withdrawal does not exceed the rate of natural recharge (ecological or sociological aspects are not considered). It is a myth because it is an oversimplification of the information that is needed to understand the effects of developing a groundwater system.
20 What Hydrologic Factors Affect Groundwater Sustainability? Focus on 1.Interactions between groundwater and surface water 2.Groundwater storage (water levels) 3.Groundwater quality 4.Ecological Requirements of Streamflow & Groundwater-Dependent Ecosystems
21 Effects of Groundwater Withdrawals Pumping groundwater always causes 1.a decline in groundwater levels 2.a diversion to the pumping well of groundwater that was moving slowly to its natural area of discharge, which in the Corning aquifer, is the Chemung, Cohocton, and Tioga Rivers Pumping groundwater may also cause 1.direct loss of streamflow out of the stream itself 2.loss of wetlands, springs, and riparian ecosystems 3.changes in groundwater quality
22 The foundation of any good groundwater analysis is the availability of high-quality data depths and thicknesses of hydrogeologic units from well logs, location of recharge areas, water-level measurements, construction of predevelopment water-level maps, water-level maps at various times during development, amount of groundwater consumed for each type of use and spatial distribution of return flows or export in this case 7. groundwater WQ sampling to document pre- and postdevelopment water quality, 8. measurements of streamflow and stream quality during low flows to indicate possible contributions of discharging groundwater to surface-water quality.
 when the rate of groundwater")
23 When are Ecosystems and the Aquifer Most Vulnerable? The ecosystem and aquifer are most vulnerable during droughts (low-flow conditions in streams) when the rate of groundwater withdrawal has a large influence on the amount of streamflow and on the ecosystem

24 EFFECTS OF GROUNDWATER WITHDRAWALS ON STORAGE IN THE AQUIFER A change in the water level of any well is a measure of a change in storage in the groundwater reservoir, which is analogous to changes in water level in surface-water reservoirs. Water availability and well efficiency is strongly associated with saturated thickness of the aquifer
25 Declines in GW levels as a result of intense pumping can result in several unwanted effects Decreases in aquifer storage Some wells may become dry Pumping costs will increase because the vertical distance that groundwater must be lifted to the land surface increases The likelihood that the contaminated groundwater will be intercepted by a pumping well are increased Pumping of groundwater may result in land subsidence (probably not a concern in Corning)

26 Groundwater Computer Models-- The Best Tool Available for GW Management During the past several decades, computer simulation models for analyzing flow and chemical transport in groundwater and surface-water systems have played an increasing role in the evaluation of groundwater development and management.
27 Numerical Groundwater models, such as MODFLOW, represent the features of a groundwater system Models compute water levels, flows (both groundwater and surface water), and water budgets. Computer simulation are a principal means for evaluating the response of aquifer systems to groundwater withdrawals and other human activities. Groundwater models commonly are used to make forecasts in the future (what-if scenarios).
28 The 1988 Corning Model Good News and Bad News Good News A groundwater flow model (MODFLOW) was constructed in 1988 by P. Ballaron of the Susquehanna River Basin Commission (SRBC) The simulation of natural conditions (non pumping) is still valid Presently, the 1988 model is still an adequate tool to provide general information on how the aquifer system works at a regional scale, but not adequate for a more detailed scale Bad News The model is outdated because of advances in computer systems and in software The original files were lost In 2002, Stearns Wheler/Leggette, Brashears & Graham rebuilt a replicate model as best they could However, the reconstructed model used the same quasi-3d approach (now outdated) and kept other less than optimum construction details such as using a very coarse model grid spacing of 500 x 500 ft (a spacing that is too coarse for this aquifer by today s standards)

29 Limited memory and Slow!!!! Mac
30 Stearns & Wheler/Leggette, Brashears, & Graham (2002) also concluded that the model needs to be updated If the SRBC model is to be used in the future to evaluate management alternatives (such as well spacing, to assess the effect of pumping on river stage and streamflow, or to delineate recharge areas of production wells, the model will need to be updated and additional hydrogeologic data will need to be collected. From Chemung River Valley Water Study, 2002
.")
31 What is Needed to Update the Model Rebuild the model using the latest versions of MODFLOW and MODPATH programs, preferably using pre- and post-processing software to leverage ease of editing and enhancement of displaying results such as integration with GIS (view multiple map layers). Recent Model Developments More Complete Hydrologic Models More Realistic


32 APPLY PARTICLE-TRACKING (MODPATH) Backward Tracking Delineates Contributing Areas to Wells Water table generated from output of MODFLOW GW flowpaths to pumping well generated from MODPATH
 Forward tracking shows paths of chemicals from spill sites-an")
33 PARTICLE TRACKING (CONT.) Forward tracking shows paths of chemicals from spill sites-an essential tool for contamination studies
 3.")
34 Need to inventory what is within the contributing area to wells 1. Sources of potential contamination 2. Sources of recharge (losing streams) 3. Discharge points (wells) and discharge areas (wetlands and main stem stream)


35 How A Groundwater System Works Simple Depiction Predevelopment Developed conditions
36 However, GW Systems are Very Complex There are many factors that control the direction and rates of flow in a GW system Each aquifer area is unique because the distribution of sources of recharge and the areas and points of discharge are different for each study area. A GW flow model is the only tool that can take into account all the important factors that make a GW system work.
 conditions GW flows from north valley wall")
37 How Does the Corning Aquifer Work? Elevation of Water Table under natural (non-pumping) conditions GW flows from north valley wall and discharges into the Chemung River at the south valley wall

38 Under pumping conditions, a large cone of depression formed in water table, resulting in a reversed gradient 60% of the combined municipal and industrial pumpage is derived from induced infiltration from streams (Ballaron, 1988; and Stearns & Wheler/ Leggette, Brashears & Graham, 2002)
39 SUSTAINABILITY--LIMITED VERSION (just considering only the flow that is needed for wastewater assimilation) According to the NYSDEC (Samside, 2002), the estimated 99 percent exceedance probability low flow value or 7day, 10-year (7Q 10) low flow is 86 cfs, (56 mgd) which is the minimum allowable flow at the Corning stream gage necessary for wastewater assimilation. When a drought condition was simulated at 95 percent exceedance probability flow for the Chemung River, flow is 132 cfs Potential induced water availability is 46 cfs (132 86cfs)
40 Two Estimates of Sustainable Yield Based on Regional Perspective Only (Old Definition of Sustainability) 1. The maximum yield of the aquifer during "drought conditions is estimated to range between 23.9 and 24.7 Mgal/d (Stearns Wheler/Leggette, Brashears & Graham, 2002) 2. The maximum sustainable yield of the aquifer in the Coming area is about 19.5 Mgal/d (USGS, MacNish and Randall, 1982)
41 Latest DEC permitted withdrawals for Corning Aquifer area City of Corning 11.0 Mgal/d Painted Post 4.0 Mgal/d Town of Erwin 2.5 Mgal/d (not in model) Village of South Corning 1.0 Mgal/d Town of Corning 1.1 Mgal/d Total of 19.6 Mgal/d for Corning Aquifer Does that include Industrial pumping?????
42 History of Water Use Total withdrawal from the aquifer was 10.2 Mgal/d, 6.3 Mgal/d was from infiltration induced from the river. Painted Post withdrawal about 1.8 Mgal/d (Balleron, 1988) Total withdrawal from the aquifer was 7.0 Mgal/d. Painted Post withdrawal down to 0.44 Mgal/d. (Stearns & Wheler/Leggette, Brashears & Graham, Inc., 2002) From a standpoint of just pumping yield, Painted Post well #4 could probably provide the additional 1 Mgal/d
43 DATA NEEDS Cumulative Consumptive Use-Water Export Presently, the estimates of low-streamflow conditions and of sustainable yields are based on conditions whereby most pumped water is returned to the stream via the sewage treatment plants. The estimates do not take into account the effects of consumptive use, such as exporting water, which would result in a permanent loss of water in the system, including streamflow. Need to consider cumulative affects of multiple pumping centers that export water or have consumptive uses. For example, what would be the effect on streamflow should Bath, Erwin, Painted Post, Corning, Big Flats, and Elmira all export water at 1 Mgal/d each. That would result in a permanent reduction in streamflow in the Chemung R. of 6 Mgal/d (10 cfs).
44 DATA NEEDS CONT.-MODEL UPDATES The Model has a number of weaknesses In addition to the many good suggestions by Leggette, Brashears & Graham to improve the model, below are additional needs 1. The model construction may need to be re-evaluated because some input parameters, such as the distribution of recharge, which does not agree with most USGS models in the Northeast. Most USGS models have more recharge that is derived from uplands sources than is derived from precipitation over the aquifer. The SRBC model has 60% of the recharge from prec. and 40% from uplands, whereas most USGS models have the reverse, 60% from upland sources and 40% from precipitation. 2. The SRBC model was not calibrated to streamflows in the rivers. It is very important to conduct streamflow measurements to be used to calibrate GW flow models. 3. ADD Particle-tracking capability 4. Expand model to west in include Hodgman Cr. and T. of Erwin well field
45 Data Needs Cont. Need to also look at the local settings in the surrounding areas of pumping wells Using Modpath, delineate contributing areas to major pumping wells Within these contributing areas, inventory contamination sites, streams, wetlands, springs, rare ecosystems, etc. Evaluate whether pumping will have an adverse impact to the above items, if present
46 Data Needs Cont. Need to look at local setting in the surrounding area of Painted Post pumping well #4 Since pumping well #4 is in the smaller Cohocton River Drainage Basin (DA=600 mi2), need to determine drought and low-flow values or 7-day, 10-year (7Q 10) for the Cohocton River. Then apply the sustainable/safe yield exercise using those flows. And yes, you need to consider the pumping effects on the larger Chemung River (DA=2,000 mi2), too, but in this case, you need to look at the Cohocton River, also.

47 Well No. 4 is in the smaller Cohocton Basin Well #4

48 Water-Quality Testing Since Painted Post well #4 is near a contamination site and pumping may result in water-level declines that result in a groundwater gradient from the site to the well, need to collect periodic water-quality samples to determine whether contaminants are being drawn off the contaminated property to the well. Sampling must be continued long enough to take into account the time-of-travel of GW to move from the contaminated site to the well (possibly several months?).
49 This is the last slide