Technical Summary. January 2014
|
|
|
- Janice O’Brien’
- 5 years ago
- Views:
Transcription
1 Pit Name: Roaring Lake Pit Provincial Pit Numbers: 1330 & 4065 Technical Summary January 2014 Location: Roaring Lake Pit is located on Highway 16, approximately 44 km west of Prince George, BC. Access to the pit is off Norman Lake Road (Figure 1). Legal Land Description: The site is currently a Section 16 Map Reserve (LF# & ) held by the British Columbia Ministry of Transportation and Infrastructure (BC MOTI). The legal description of the Map Reserve is Crown Land covering unsurveyed portions of District Lots 8507, 3351, 8497, and a portion of the North ½ of District Lot 8504, Cariboo District South. The layout of the Map Reserve boundary is shown in the Pit Plan (Figure 2) Investigation: BC MOTI conducted an auger drilling program in February 1996 and a test pitting program in May 1996 at the Roaring Lake Pit. A total of thirtyseven test holes were drilled to depths ranging from m and a total of forty-six test pits were excavated to depths ranging from m. During the drilling and test pitting, subsurface soil and groundwater conditions were logged and one hundred and twenty-seven representative samples of the granular materials were collected for laboratory testing and future reference. Laboratory testing was carried out on sixty-two of these samples at the MOTI s old laboratory to assess the gradation and durability characteristics. The tests completed were wet sieve analysis, degrade, sand equivalent, MgSO4, relative density, absorption and fracture counts (method A and B) Investigation: BC MOTI conducted a test pitting program in February of A total of 18 test pits were excavated to depths ranging from m. During the test pitting, subsurface soil and groundwater conditions were logged and eithteen representative samples of the granular materials were collected for laboratory testing and future reference. Laboratory testing was carried out on fourteen of these samples at the AMEC s laboratory to assess the gradation and durability characteristics. The tests completed were wet sieve analysis, micro deval, sand equivalent, relative density, and absorption. Based on the results of the 1996 and 2004 investigation, seven granular areas - Areas A through G have been defined (Figure 3). The detailed results of the subsurface testing are provided in the Test Pit and Test Hole Summaries. Locations of the test holes and test pits are shown in the Pit Plan (Figure 2). Material Gradation: Table 1 shows the gradation as a percentage by weight of the fines (silts and clays), sand and gravel components as well as the Unified Soil 1
2 Classification (USC [included after test pit summary]) for the samples tested from Areas A to E. Table 1: Pit Run Gradation Test Pit (Sample #) Depth (m) Fines (%)* Sand (%)* Gravel (%)* USC AREA A GW-GM GW-GM GW-GM Average AREA B SW GP Average AREA C GW-GM GP-GM GP-GM GP-GM GP GW GP-GM Average AREA D GP GP GP-GM GW GW GW GW SW GW GW SP GP Average AREA E GW GW GP GW GW GW 2
3 Average AREA F GW SP SP GW GW GP * Values are rounded to the nearest whole number so may not add exactly to 100% Table 2 shows the estimated percent by weight of small and large boulders as well as the percentages of fines, sand and gravel corrected to approximately 100%. The gravel is also divided into fine and coarse portions. Table 2: Corrected Pit Run Gradation with Oversize Estimates Test Pit (Sample #) % Fines* <0.075mm % Sand* mm Fine mm % Gravel* 3 Coarse mm % Small Boulders* mm % Large Boulders* >300mm AREA A GW-GM GW-GM GW-GM Average AREA B SW GP Average AREA C GW-GM 96-26(1) GP-GM 96-26(2) GP-GM GP-GM 96-28(1) GP 96-28(2) GW GP-GM Average AREA D GP GP GP-GM GW GW GW-GM GW SW USC
4 GW GW-GM SP GP Average * Values are rounded to the nearest whole number so may not add exactly to 100% Table 2: Corrected Pit Run Gradation with Oversize Estimates (Cont.) Test Pit (Sample #) % Fines* <0.075mm % Sand* mm Fine mm % Gravel* Coarse mm % Small Boulders* mm % Large Boulders* >300mm AREA E GW GW GP GW GW GW Average * Values are rounded to the nearest whole number so may not add exactly to 100% USC Material Durability: Table 3 shows the results of the durability tests as well as the specifications as required in the Standard Specifications for Highway Construction. Table 3: Durability Test Results Test Pit Sand Equivalent Degradation/ Absorption Relative Density Micro Deval Coarse Fine Coarse Fine (2014 only) AREA A AREA C AREA E AREA F BC MoT Specifications Sand Equivalent 40 for base coarse and fine asphalt mix aggregate 20 for surfacing, sub base and bridge end fill aggregates 4
5 Degradation (Old MOTI specifications) Micro Deval Absorption Relative Density 35 for base coarse, sub base and asphalt mix aggregates 40 for graded aggregate seal class A 30% for sub base and bridge end fill aggregates 25% for surfacing & base course aggregates 18% for Coarse asphalt mix aggregates 20 for Graded aggregate seals <2.0% for coarse paving aggregates 1.0% for coarse and 1.5% for fine graded aggregate seals ~2.65 for all aggregate products Note that the Degradation test was replaced by the Micro Deval test in 2005, hence the micro deval test results for this 1996 investigation is not available. The sand equivalent and degradation results for Area A samples meet the requirements for all aggregate products. Area C sand equivalent result meets the requirements for sub base and bridge end fill, but is marginally below for base course and asphalt mix aggregates. The degradation result meets the requirements for all aggregate products. Area E sand equivalent result meets the requirements for all aggregate products. The degrade result meets the requirements for base course and asphalt mix aggregates, but is marginally below the minimum required value of 40 for graded aggregate seal coats. Durability tests were not done on any of the samples from Areas B and D. Material Suitability: Based on the 1996 investigation results, the material in Areas A through E are judged to be suitable for the following purposes: Table 4: Suitability Area A Area B Pit Run HFSA BEF SGSB Crush Area C HFSA Asphalt Mix Aggregates Area D Area E Area F SGSB BEF SGSB BEF SGSB 25mm Well Graded Base Asphalt Mix Aggregates 25mm WGB Asphalt Mix Aggregates 5
6 Area G SGSB Areas A, B and D will require durability testing to assess the suitability for aggregate products like crushed base courses, asphalt mixes, and graded aggregate seals. Volume Estimates: Table 5 shows the volume estimates that can be expected for top soil, overburden and gravel from Areas A to E. This is based on the measured depths encountered during the subsurface investigation. The potential volumes of granular material were calculated by averaging the total thickness of granular material encountered in test pits and test holes and multiplying by the estimated surface area. Many of the test pits and test holes bottomed in gravel and therefore the gravel volumes could be higher than what is calculated here. Table 5: Volume Estimates Area Approximate Surface Area (m 2 ) Average Top Soil Thickness (m) Top Soil Volume (m 3 ) Average Overburden (m) Overburden Volume (m 3 ) Average Granular Thickness (m) Potential Granular Volume (m 3 ) Area A 15, , ,740 Area B 19, , ,940 Area C 50, , ,377 Area D 36, , ,338 Area E 14, , ,311 Area F 12, , ,400 Area G 23, , ,800 Total 171, , ,906 6
7 Note that the above volume estimates are based on the 1996 Test Pit data only. Test hole data was not used in the volume calculations due to difficulties in obtaining representative samples of clean granular materials and accurately classifying them. However, the test hole data indicates that there is potential for aggregate volumes at depth in the tested areas. Pit Development Notes All development must be carried out in accordance with the Health, Safety, and Reclamation Code for Mines in British Columbia, BC Ministry of Energy and Mines (2008, or later edition), the Standard Specifications for Highway Construction, BC Ministry of Transportation and Infrastructure (2011, or later edition) and the Aggregate Operators Best Management Practices Handbook for BC. The water table was not encountered in any of the development areas. Access to the granular areas will be from the Norman Lake Road. Areas A, B and C will require establishment of new access roads. There are existing trails to Areas D and E that can be upgraded, otherwise these areas will also require establishment of new access roads. The majority of the trees are young to medium age and are not considered merchantable, however, there are some scattered trees that appear to be merchantable and these trees may require logging. It is recommended that timber cruising be carried out before any development to assess if logging would be required. All Areas will require clearing, grubbing and stripping before any development can commence. The stripped top soil and overburden must be stockpiled in the designated areas outlined in the Development Plan (Figure 3). All trees, vegetation, and overburden are to be removed within 2m of the top of the pit faces. Top soil, overburden, and aggregate cannot be stripped within five meters of the reserve boundary. All granular areas will require pit faces to be established at locations shown in the development plan. Once pit faces are established, development in Areas A, B, C and D can move north, northeast and east. Development in Area E can move east. Additional areas for staging and stockpiling will require clearing and grubbing. No dumping of debris or petroleum products will be permitted and the site must be left in a clean and safe condition. At the completion of the pit development operations, but prior to the depletion of the pit, the sides of the pit faces, waste piles, and overburden stockpiles must be 7
8 trimmed to a 1.5H:1V slope. Active pit faces must be reshaped with native granular materials. Upon depletion of the pit, all disturbed areas are to be reclaimed. The minimum reclamation procedure should include re-sloping of the pit faces and waste piles to a 2H:1V slope, contouring the area for appropriate drainage, spreading of overburden followed by top soil, and seeding. Should any of the above conditions conflict with the Health, Safety, and Reclamation Code for Mines in British Columbia, then the Code will prevail. Closure The findings of this report and the soil conditions noted above are inferred from the extrapolation of limited surface and subsurface data collected during the site investigation. It should be noted that different and possibly poorer soil conditions may exist between the test pit locations and volume estimates may vary from those reported in this report. Prepared by: Andrew Barrett Geotechnical Assistant Northern Region For/Reviewed by: Satish Prasad, P.Geo. Regional Aggregate Resource Manager Northern Region 8
9 Location Plan


10 Norman Lake Road Intersection of Hwy 16 & Hwy 97 ~44km SITE LOCATION Location Plan: NTS Mapsheet 93G14 Edition 2 (1974) Scale 1: m : Google Earth Image: Scale 1:50000 Site Location Prince George Hwy 16 n d rma No e Roa k a L BRITISH COLUMBIA Ministry of Transportation and Infrastructure Northern Region Geotechnical and Materials Branch Roaring Lake Pit LOCATION PLAN (2014) ROARING LAKE PIT FORT GEORGE DISTRICT PROJECTION: DRAWN BY: CHECKED BY: SCALE: DATE: DATUM: roaring lk loc plan2014.dwg This drawing was originally produced in colour. 22 JANUARY 14 NAD83 S.Prasad FILE No. AS SHOWN UTM Zone 10 AB PROJECT No. REG. - NR DRAWING No. FIGURE 1 This drawing was originally produced in colour.
11 Pit Plan
12
13 Development Plan
14
15 Test Pit and Test Hole Summary And Unified Soil Classification
16
17
18
19
20
21
22
23
24
25
26
27
28
29
30
31
32
33
34
35 TEST PIT NUMBER SAMPLE NUMBER FINES SAND GRAVEL mm (%) mm (%) MAX SIZE (mm) SOIL CLASSIFICATION FINES SAND GRAVEL FINES SAND GRAVEL SAND EQUIVALENT DEGRADE MgSO4 %coarse/ %fine FRACTURE A/B B.R.D coarse/fines ABSORPTION %coarse/%fines DEPTH (m) LAYER THICKNESS (m) SOIL CLASSIFICATION >300mm (%) WATERTABLE (m) MICRO DEVAL Page 1 of 2 PROJECT DISTRICT Roaring Lake Pit Fort George FIELD VISUAL IDENTIFICATION OVERSIZE TEST PIT SUMMARY PIT RUN TEST METHOD Tracked Excavator DATE 12 Feb 2014 LABORATORY TEST RESULTS CRUSH DURABILITY From To GP SM GP B SP SP TS GP GW / / SP GP GW / / TS GP GW TS B GP-GM GW / / TS GP GW SP SP / / GM CL TS GP GP SP TS X GP-GM GW / /2.1
36 TEST PIT NUMBER SAMPLE NUMBER FINES SAND GRAVEL mm (%) mm (%) MAX SIZE (mm) SOIL CLASSIFICATION FINES SAND GRAVEL FINES SAND GRAVEL SAND EQUIVALENT DEGRADE MgSO4 %coarse/ %fine FRACTURE A/B B.R.D coarse/fines ABSORPTION %coarse/%fines DEPTH (m) LAYER THICKNESS (m) SOIL CLASSIFICATION >300mm (%) WATERTABLE (m) MICRO DEVAL Page 2 of 2 PROJECT DISTRICT Roaring Lake Pit Fort George FIELD VISUAL IDENTIFICATION OVERSIZE TEST PIT SUMMARY PIT RUN TEST METHOD Tracked Excavator DATE 12 Feb 2014 LABORATORY TEST RESULTS CRUSH DURABILITY From To TS GM GW TS GP GW-GM / / TS B GP-GM GW-GM SP TS GP GW / / TS GP TS GP-GM GW TS GP GP
37
38 Photos
")

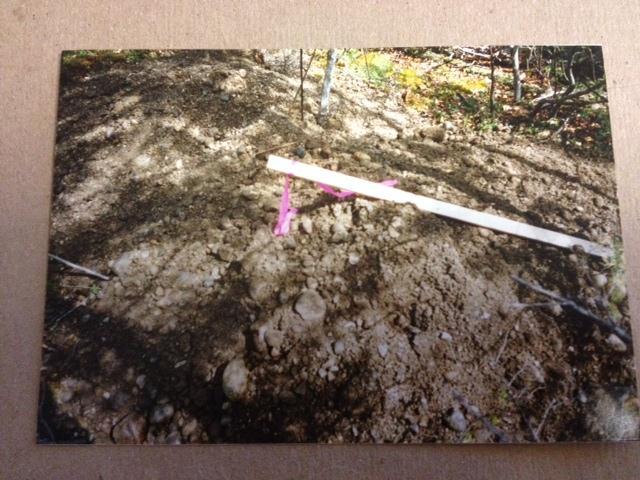
39 TP96-27 (Area C) TP96-28 (Area C)
")
40 TP96-34 (Area E) TP96-35 (Area E)
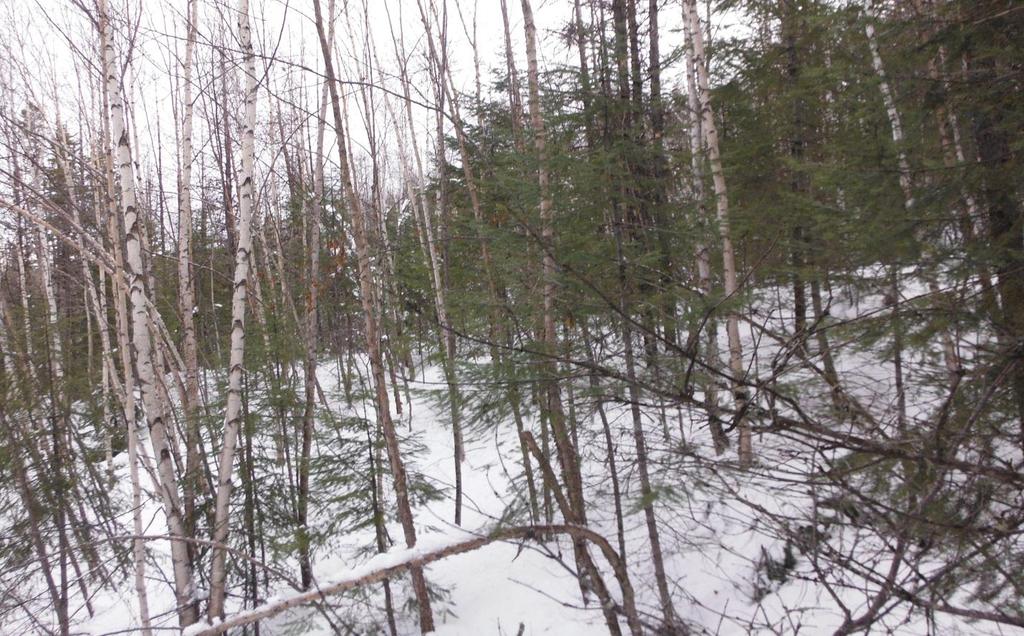
41 Area A Vegetation Area B Vegetation
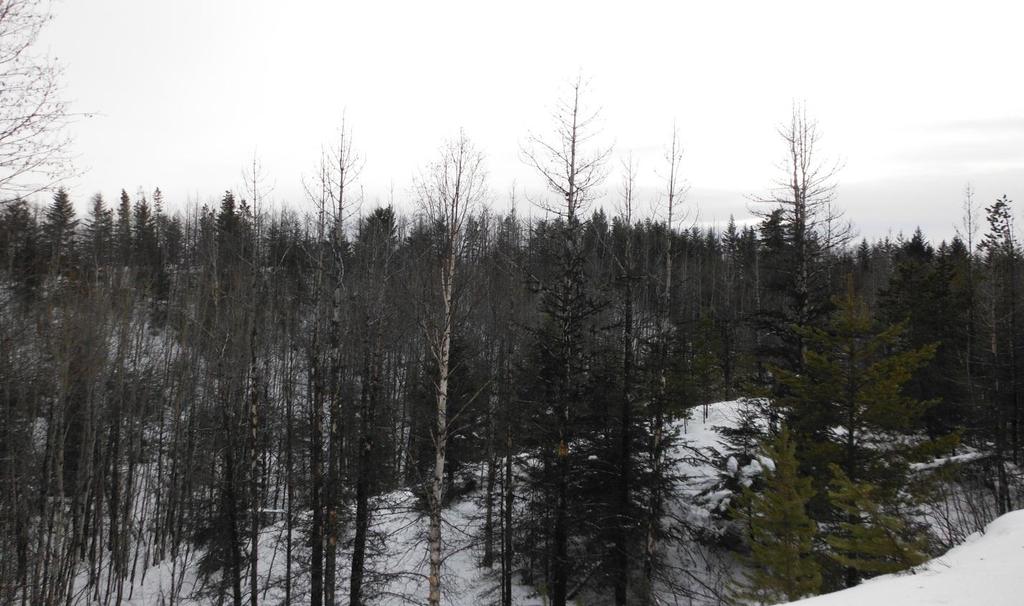
42 Area C Vegetation Area D Vegetation

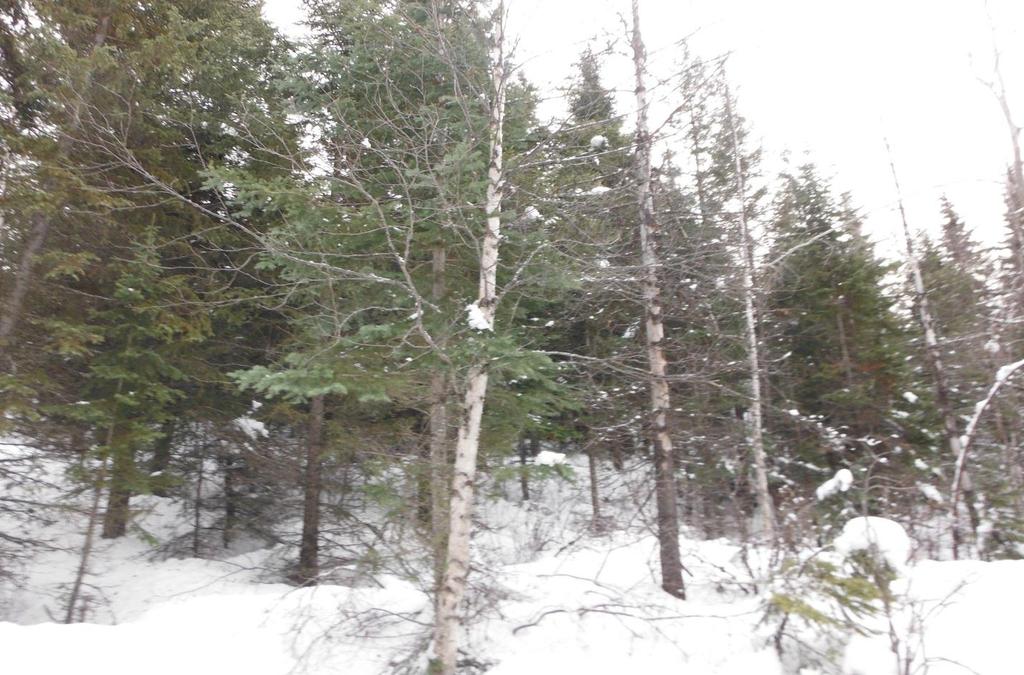
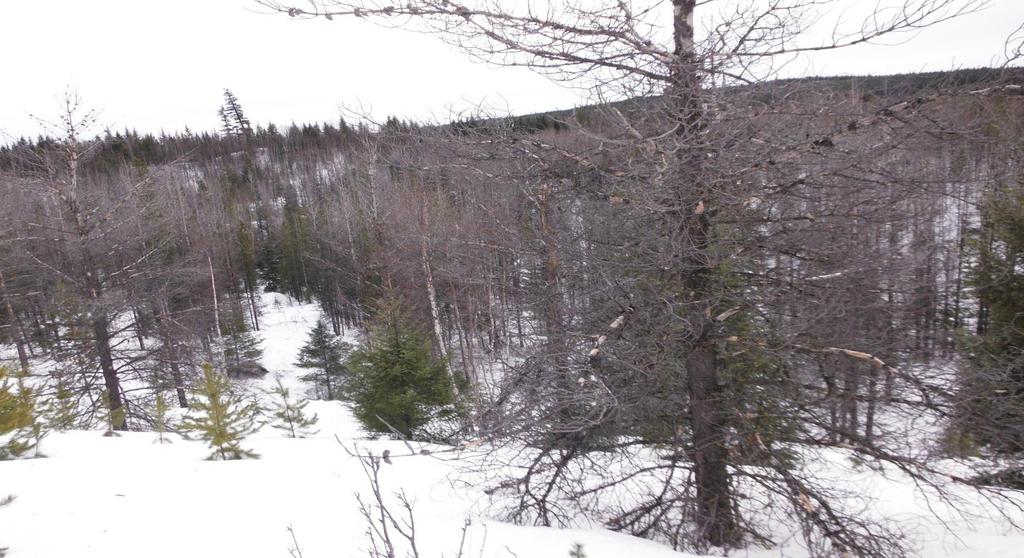
43 Vegetation (Just outside of Area E)