The International Propeller Club Port of Genoa
|
|
|
- Prudence Berry
- 5 years ago
- Views:
Transcription
 E SVILUPPO DELLE INFRASTRUTTURE GNL Genova - 12.09.")
1 The International Propeller Club Port of Genoa Towards a 100% renewable energy future: WÄRTSILÄ in the LNG MARKET Marco Golinelli, Director Energy Solutions Wärtsilä Italia Spa STRATEGIA ENERGETICA NAZIONALE (SEN) E SVILUPPO DELLE INFRASTRUTTURE GNL Genova
2 THIS IS WÄRTSILÄ CLEAN ENVIRONMENT A future without emissions or pollution MARKET SHAPING & INNOVATION A union of new technology and business models ENERGY INTELLIGENCE An optimised way of producing and using energy WÄRTSILÄ S PURPOSE is to enable sustainable societies with smart technology.
3 Smart Marine & Smart Energy Vision Wärtsilä s aim is to lead the industry s transformation towards a Smart Marine Ecosystem by new ways of collaboration and smart technology. By applying smart technology and performance optimisation services, Wärtsilä aims to deliver greater efficiencies, minimise climate impact and a higher safety to the shipping industry. The energy landscape is in transition towards more flexible and sustaintable energy systems. We envision a 100% renewable energy future. Wärtsilä is leading the transition as the Energy System Integrator we understand, design, build and serve optimal power systems for future generations. We provide all the essential technologies, lifecycle services and optimised solutions for future energy systems. 3 Wärtsilä PUBLIC 13 September 2018 Corporate presentation 2018
4 ENERGY SOLUTIONS MARKET TRENDS & DRIVERS ECONOMIC GROWTH, ELECTRIFICATION AND IMPROVING STANDARD OF LIVING RAPIDLY INCREASING RENEWABLES DECLINING INFLEXIBLE BASE LOAD GENERATION EMERGING DISRUPTIVE STORAGE TECHNOLOGY THE ROLE OF GAS IS INCREASING Wärtsilä PUBLIC
5 MARINE SOLUTIONS MARKET TRENDS & DRIVERS URBANISATION, GLOBALISATION AND POPULATION GROWTH SUPPORT SEABORNE TRADE DEVELOPMENT AND DRIVE CHANGING TRADE PATTERNS TECHNOLOGICAL DEVELOPMENTS AND NEW BREAKTHROUGHS (DIGITALISATION, DISRUPTIVE TECHNOLOGIES, BATTERIES ETC.) CREATE A NEED FOR NEW BUSINESS MODELS INCREASING CONSUMPTION AND GROWING MIDDLE CLASS POPULATION SUPPORT DEMAND FOR CRUISE SECTOR PARTICULARLY IN ASIA STRICTER ENVIRONMENTAL REGULATIONS ARE DRIVING INTEREST IN GAS AS A MARINE FUEL AND IN EMISSIONS ABATEMENT TECHNOLOGIES

6 NATURAL GAS IS CONQUERING NEW MARKETS Global interest in LNG is driven by Energy security considerations and lower energy costs Requirements for emission reduction in power generation, industry and shipping Rapid growth of intermittent renewable power generation and escalating demand fluctuation. LNG/gas is a perfect balancing fuel. 6 Wärtsilä PUBLIC 13 September 2018 Corporate presentation 2018
7 IEA S VIEW ON GAS three major transformations in the next five years: China becomes the world s leading importer of natural gas. Economic growth and strong policy support to curb air pollution The industrial sector takes the lead from power generation as the main driver of global growth in demand for natural gas. Fuel for industrial processes and feedstock for chemicals and fertilisers in the Emerging markets USA is the source of much of the growth in natural gas production and most of the additional LNG exports. 45% of the growth in global production and 3/4 of LNG export growth. 7 Wärtsilä PUBLIC 13 September 2018 Corporate presentation 2018
8 Emission reduction potential with LNG -25% Emission values [%] 100 Negative effects CO 2 Global warming NO x Smog, acid rain and eutrophication SO x Acid rain Particulates Respiratory problems Figures are indicative. The exact air pollutant emission reduction potential depends on a range of factors. CO 2 NO x SO x -90% Particulates -100% -100% Gas engine HFO engine Wärtsilä PUBLIC 13/09/2018 LNG infrastructure solutions
9 IEA S VIEW ON GAS More from IEA LNG appears as the main driver of inter-regional natural gas trade growth, sustained by strong export capacity expansion. The wave of LNG export projects adds some 140 bcm of liquefaction capacity between 2018 and 2023, increasing global capacity by almost 30%. The emergence of the United States as a global exporter challenges the traditional features of LNG trade. With flexible destination and gas-indexed pricing (compared with the standard fixed-delivery, oil-indexed supply agreements) Australia and the United States appear as new global players likely to challenge Qatar in Asian markets. A lack of projects post-2020 could lead to a market tightening. Nearly all the new liquefaction capacity should be operating by 2020 while it can take time, especially for new customers, to construct receiving infrastructure, impacting the utilization rate of liquefaction. Price competitiveness and market reforms will be critical to sustaining natural gas demand growth in emerging markets. 9 Wärtsilä PUBLIC 13 September 2018 Corporate presentation 2018
10 LNG Trends - BP Energy Outlook 2035 LNG supply Bcf/d 80 Shares of global gas consumption Bcf/d 40% 60 30% 40 20% 20 10% % Other Africa Australia US Russia Qatar Total trade Pipeline LNG BP Energy outlook Wärtsilä PUBLIC 13/09/2018 LNG infrastructure solutions
11 IEA S VIEW ON GAS More from IEA LNG appears as the main driver of inter-regional natural gas trade growth, sustained by strong export capacity expansion. The wave of LNG export projects adds some 140 bcm of liquefaction capacity between 2018 and 2023, increasing global capacity by almost 30%. The emergence of the United States as a global exporter challenges the traditional features of LNG trade. With flexible destination and gas-indexed pricing (compared with the standard fixed-delivery, oil-indexed supply agreements) Australia and the United States appear as new global players likely to challenge Qatar in Asian markets. A lack of projects post-2020 could lead to a market tightening. Nearly all the new liquefaction capacity should be operating by 2020 while it can take time, especially for new customers, to construct receiving infrastructure, impacting the utilization rate of liquefaction. Price competitiveness and market reforms will be critical to sustaining natural gas demand growth in emerging markets. 11 Wärtsilä PUBLIC 13 September 2018 Corporate presentation 2018


12 LNG PLANTS UTILISATION RATE Source : IEA Gas Report Wärtsilä PUBLIC 13 September 2018 Corporate presentation 2018
13 IEA S VIEW ON GAS More from IEA LNG appears as the main driver of inter-regional natural gas trade growth, sustained by strong export capacity expansion. The wave of LNG export projects adds some 140 bcm of liquefaction capacity between 2018 and 2023, increasing global capacity by almost 30%. The emergence of the United States as a global exporter challenges the traditional features of LNG trade. With flexible destination and gas-indexed pricing (compared with the standard fixed-delivery, oil-indexed supply agreements) Australia and the United States appear as new global players likely to challenge Qatar in Asian markets. A lack of projects post-2020 could lead to a market tightening. Nearly all the new liquefaction capacity should be operating by 2020 while it can take time, especially for new customers, to construct receiving infrastructure, impacting the utilization rate of liquefaction. Price competitiveness and market reforms will be critical to sustaining natural gas demand growth in emerging markets. 13 Wärtsilä PUBLIC 13 September 2018 Corporate presentation 2018
14 LNG MARKET TRENDS Wärtsilä PUBLIC 9/13/2018 PNG LNG logistics


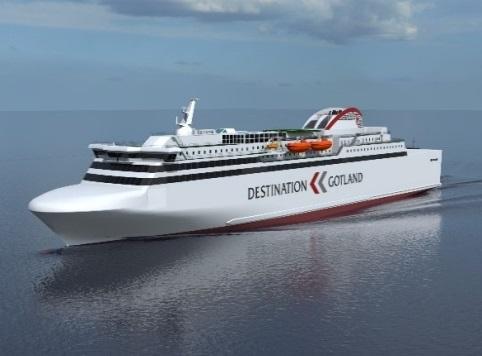
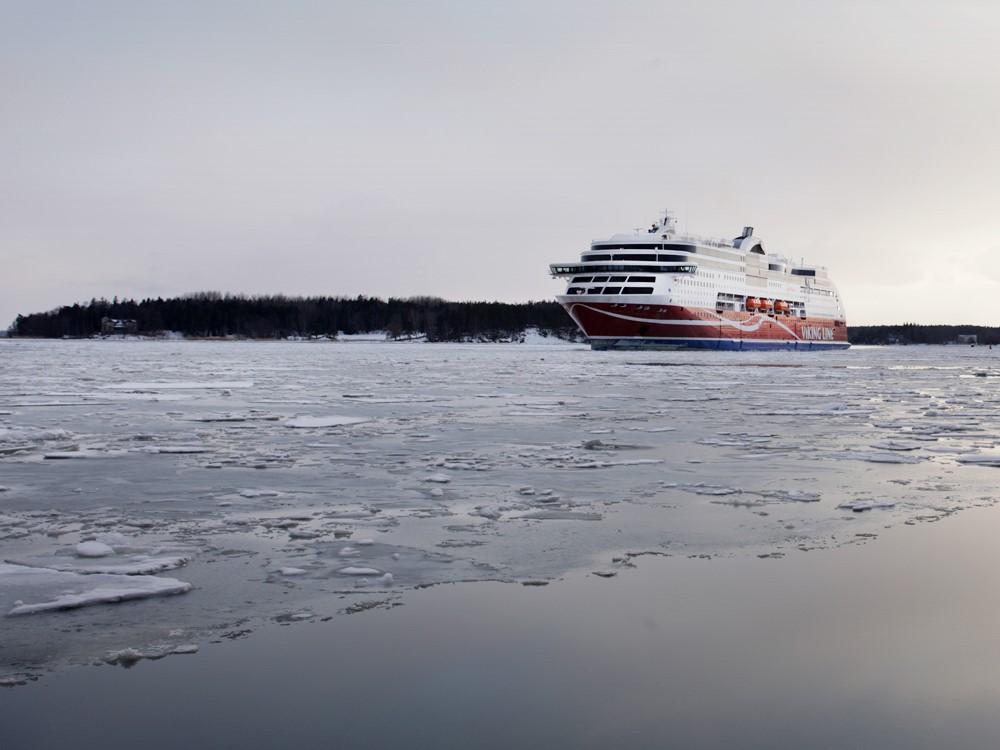
15 AREA OF OPERATION OF LNG FUELLED VESSELS *Excluding LNG carriers and inland waterway vessels Source : DNVGL 15 Wärtsilä PUBLIC [Presentation name / Author]
16 LNG FUELED SHIPS - FLEET BY VESSEL TYPE* *Excluding LNG carriers and inland waterway vessels Source : DNVGL 16 Wärtsilä PUBLIC [Presentation name / Author]

17 AREAS COVERED BY LNG POWERED VESSELS The heat map is based on the LNG fuelled fleet s AIS positions from Source : DNVGL 17 Wärtsilä PUBLIC [Presentation name / Author]
18 LNG SUPPLY LOCATIONS 67 LNG SUPPLY LOCATIONS FOR SHIPS WORLDWIDE TODAY, AND MANY MORE DECIDED AND PLANNED* *There may be several bunkering facilities/modes for one location. The count includes local storages, bunker ship loading facilities and truck loading facilities. Locations where LNG fuelled ships can be bunkered by truck or by ship is not counted. Source : DNVGL 18 Wärtsilä PUBLIC [Presentation name / Author]

19 SEN 2017 & LNG STRATEGIA ENERGETICA NAZIONALE MORE GAS SUSTAINABLE MOBILITY CAPACITY MARKET RENEWABLES PRICE GAP REDUCTION ENERGY SECURITY More infrastructures SMALL SCALE LNG STORAGE LNG and CNG fuel stations 19 Wärtsilä PUBLIC 13 September 2018 Corporate presentation 2018
20 Wärtsilä support the development of LNG infrastructure As a forerunner in gas and multi-fuel engines, fuel systems, technology and services, Wärtsilä participates in the global shift to gas also with LNG infrastructure projects. We provide our full range of project and lifecycle support to LNG liquefaction plants & terminals. We have the capability to develop the entire LNG value chain in partnership with our customers. Also, we provide similar services for LEG (ethane) and LPG (propane) infrastructure. 20 Wärtsilä PUBLIC 13 September 2018 Corporate presentation 2018
21 BEFORE: CONVENTIONAL LNG VALUE CHAIN 21 Wärtsilä PUBLIC 13/09/2018 LNG infrastructure solutions

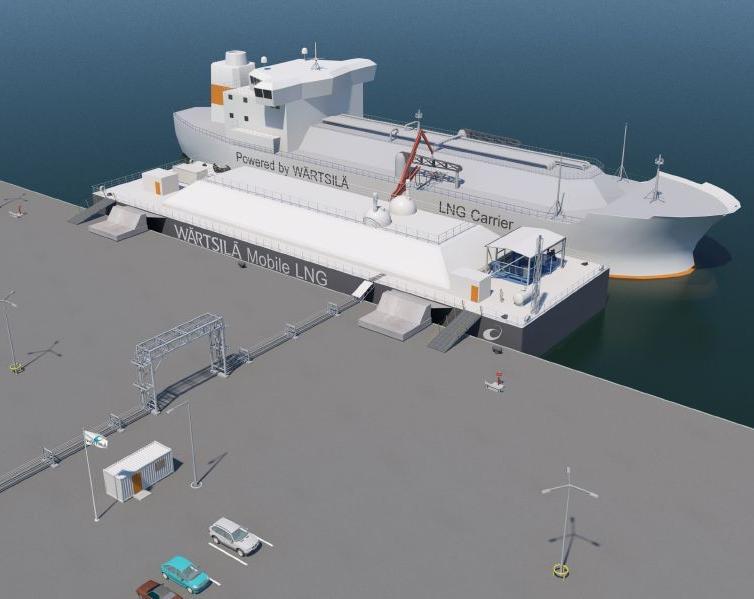
22 AFTER: CONVENTIONAL + SMALL-SCALE VALUE CHAIN 22 Wärtsilä PUBLIC 13/09/2018 LNG infrastructure solutions
")
 Storage tanks Jetty & marine facilities Export systems Mini")

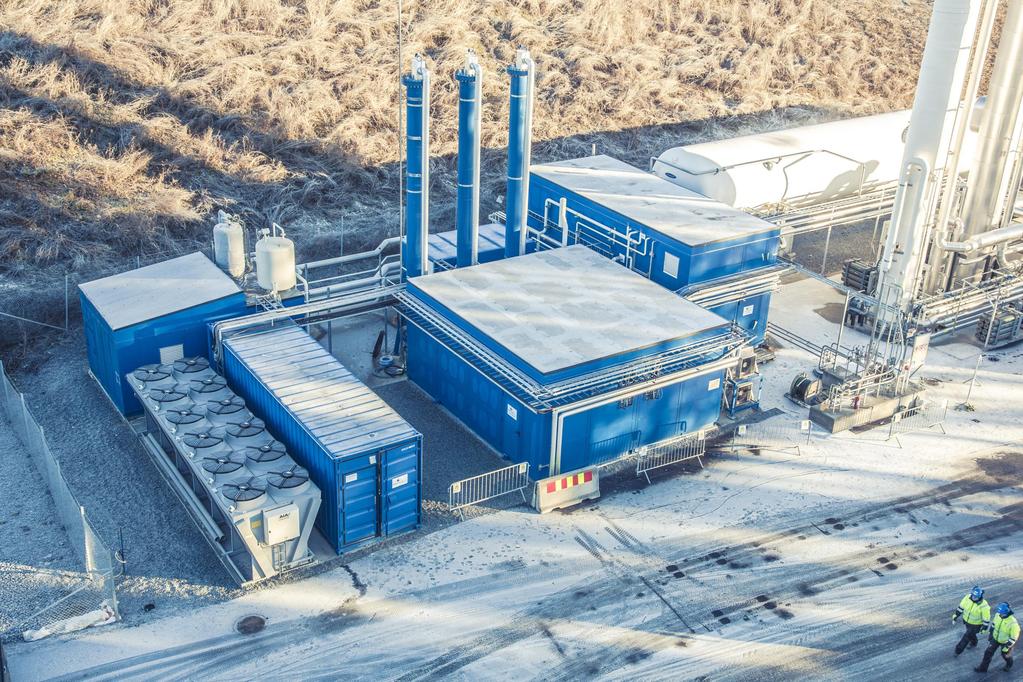
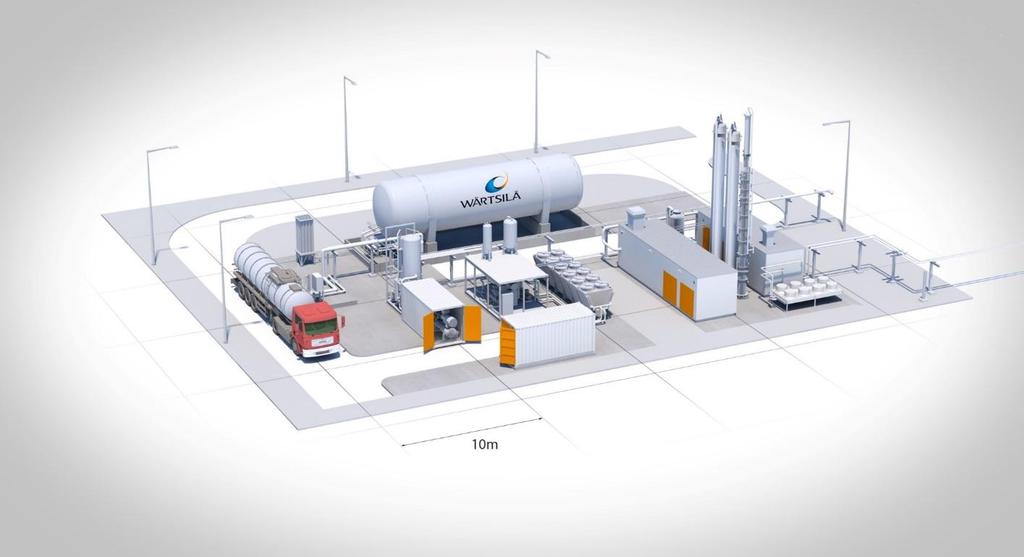
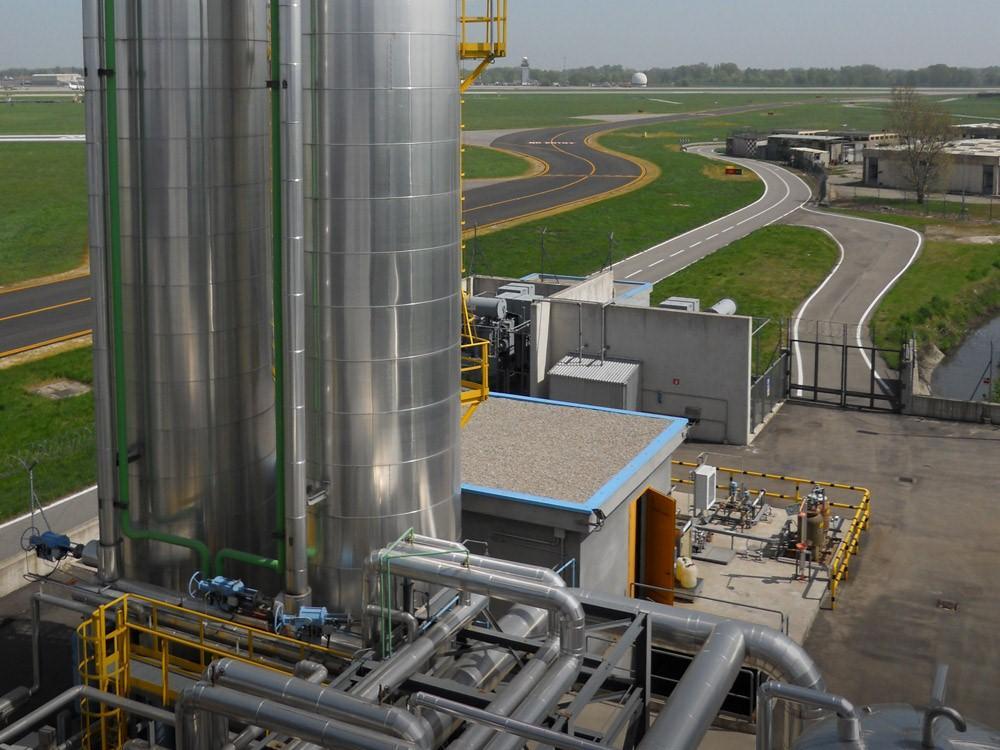
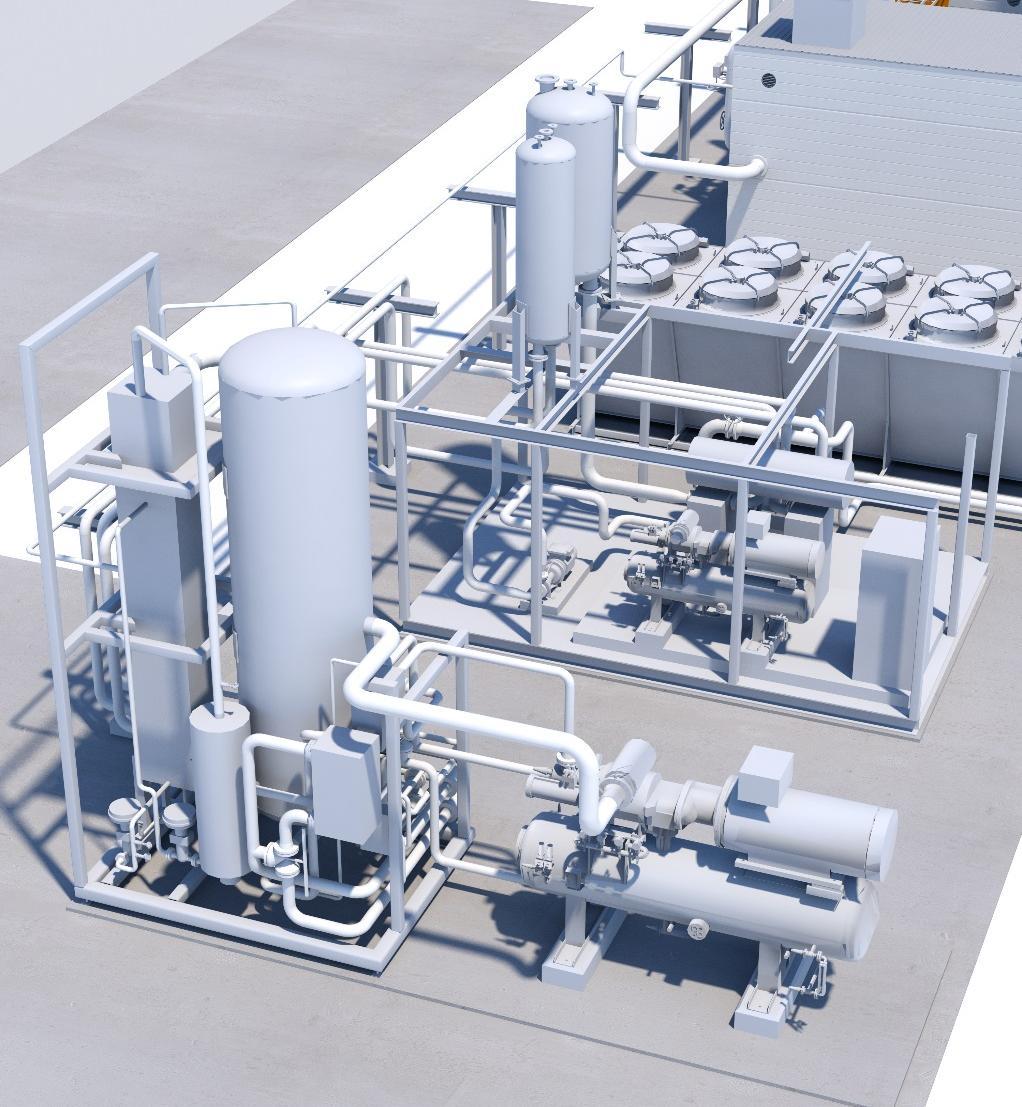
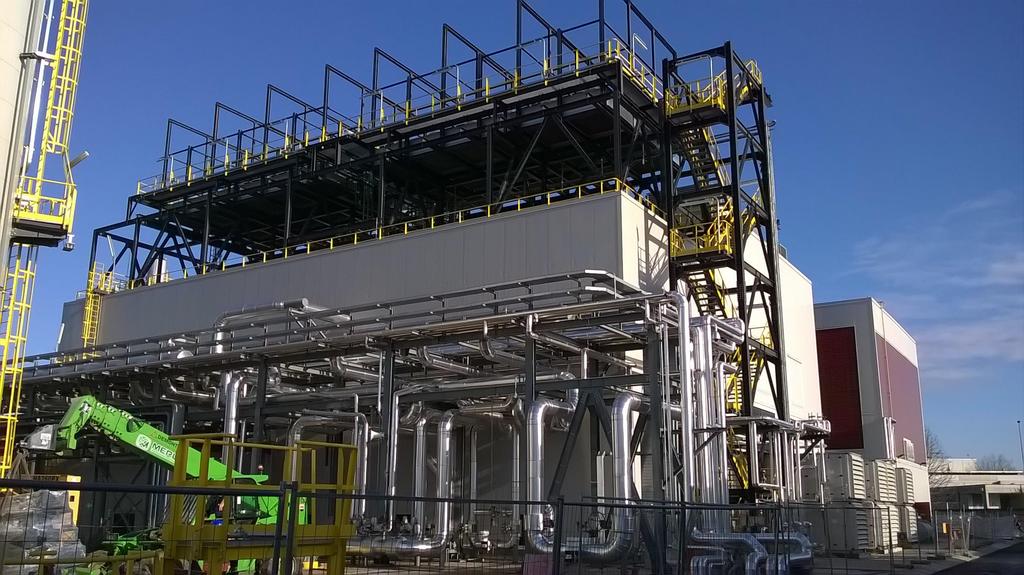
23 LIQUEFACTION PLANTS Mini and small-scale liquefaction plants INPUT PLANT OUTPUT Gas sources Pipeline gas Biogas Landfill gas Associated gas Coal seam gas Tight gas Shale gas ,000 TPA ( ,000 GPD) Gas pre-treatment Liquefaction Mixed Refrigerant: ,000 TPA ( ,000 GPD) Reversed Brayton: 20, ,000 TPA (34, ,000 GPD) Storage tanks Jetty & marine facilities Export systems Mini liquefaction plants Small-scale liquefaction plants Peak shaving plants LNG transport Carriers Tanker trucks Containers Rail cars Peak shaving gas send-out Ship bunkering 23 Wärtsilä PUBLIC 13/09/2018 LNG infrastructure solutions


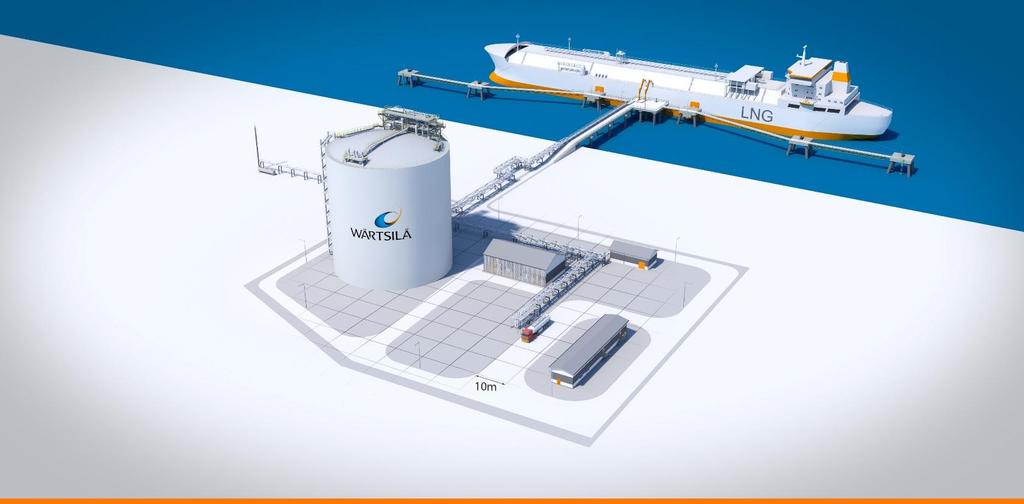
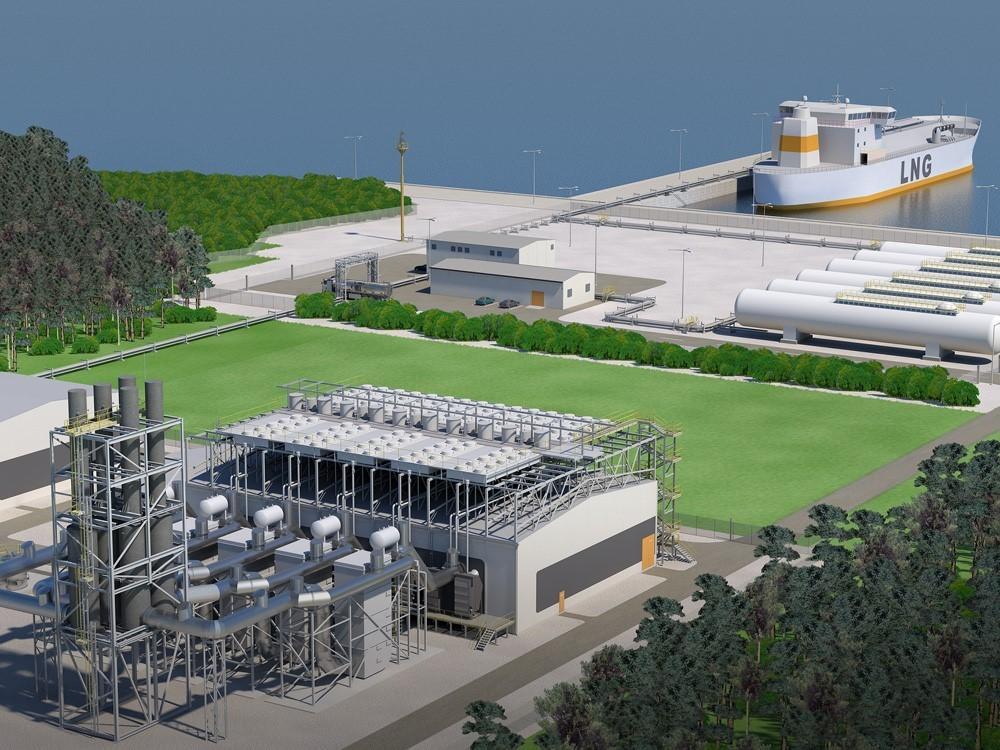
24 TERMINALS Small- and medium-scale terminals INPUT TERMINAL OUTPUT LNG transport Carriers Tanker trucks Containers Rail cars Tank capacity ,000 m 3 (26, million gallons) Jetty & marine facilities Unloading systems Storage tanks Boil-off gas handling Regasification Up to 1000 TPH (1000 MMSCFD) Export systems Satellite terminals for gas power plants Small satellite terminals Storage & regasification barges Medium-scale terminals LNG transport Carriers Tanker trucks Containers Rail cars Gas send-out Ship bunkering 24 Wärtsilä PUBLIC 13/09/2018 LNG infrastructure solutions


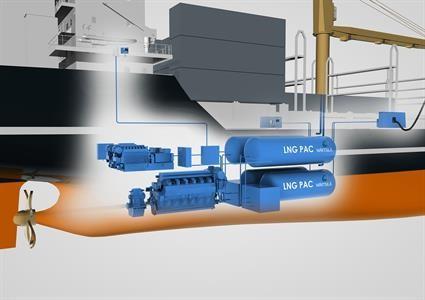
25 LIFECYCLE OFFSHORE ONSHORE LNG PORTFOLIO Wärtsilä LNG solutions Small LNG liquefaction plants Mini LNG liquefaction plants Medium-scale LNG terminals Small satellite LNG terminals LNG storage & regasification barge LNG regasification BOG reliquefaction Cargo handling system Gas and LNG carriers Fuel gas handling system Ship and cargo tank design Lifecycle services Start up support Product and technical support Spares Tank control systems 25 Wärtsilä PUBLIC 13/09/2018 LNG infrastructure solutions


26 Wärtsilä PUBLIC
27