Innovation in carbon-ammonia adsorption heat pump technology: a case study
|
|
|
- Lee Glenn
- 5 years ago
- Views:
Transcription
1 Innovation in carbon-ammonia adsorption heat pump technology: a case study Angeles Rivero Pacho 3 rd December 2015
2 Introduction The Carbon Plan and the Strategic Framework stated that meeting the 80% CO 2 reduction targets will need emissions from buildings to fall near zero by This will need promoting a more efficient use of gas heating in the short to medium term, with gas use reduced to close to zero by One way of helping to reduce the emissions of CO 2 is to develop a more efficient heat pump or refrigeration technology for domestic use. The aim of this project was to develop a commercially viable heat driven carbon-ammonia heat pump system with a high efficiency (heating COP) and specific heating power (output power per kilo of adsorbent) using a shell and tube heat exchanger, an appropriate choice of adsorbent material and a four-bed cycle.
3 Introduction The objectives of the project were: To carry out the computational modelling of a four-bed heat pump cycle. To carry out a heat transfer study of the active carbon available for the heat pump in order to identify the best sorbent sample. To design, manufacture and test the modelled heat pump cycle in order to validate the computational modelling.
4 Background

5 Adsorption cycle operation Stage (a): system is at low pressure and ambient temperature. Adsorbent contains high concentration of adsorbed refrigerant whilst the right hand vessel contains refrigerant gas. Left vessel is heated. Adsorbed refrigerant gets driven out and the pressure of the system increases. Stage (b): pressure of the system high enough so that the refrigerant gas condenses in the right vessel rejecting heat. Left generator cooled back to initial low temperature readsorbing the refrigerant in the adsorbent material. Pressure of the system drops, the liquid refrigerant boils and produces the cooling effect, absorbing heat. Stage (c): system back to initial state, cycle completed. Discontinuous heating/cooling
6 Adsorption cycle - Generator Adsorption cycle - described in four stages: Stage 1 2 Isosteric pressurisation Stage 2 3 Isobaric desorption Stage 3 4 Isosteric depressurisation Stage 4 1 Isobaric adsorption


7 Continuous basic cycle - COP COP of the basic cycle LOW Heat regeneration techniques: Multiple bed cycles heat recovery between the generators
8 Specifications of the product and system design

 30-40% reduction in gas consumption Air")
9 Domestic heat pump UK market Box-for-box exchange for conventional gas boiler Retrofit market (90% of annual sales) 7kW (3 bedroom semi-detached house at 18 C) 30-40% reduction in gas consumption Air source
10 System design Heated water to house Final Exhaust Heat Exchanger Warm Exhaust Gases Air-to-Pressurised Water Heat Exchanger Hot Gases Cool Exhaust Gases Bed 3 Adsorbent Bed 1 Heated Bed 4 Adsorbent Bed 2 Cooled Ammonia Condenser Gas Burner Ambient Air to Evaporator Evaporator Inlet Air Return water from house Cooled Air from Evaporator
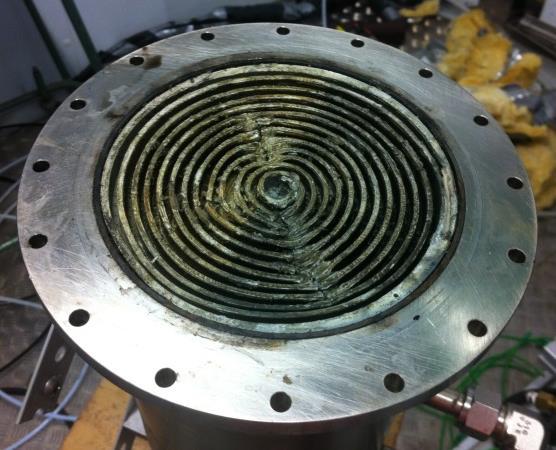
11 Generator design


12 150 mm Condenser / evaporator Relief valve Pressure transducer 400 mm Generator shell o-ring grooves Generator core


13 1.2 mm 3 mm Nickel brazing 1777 tubes 0.8 mm Rapid prototype spiral distributor Front Back
14 Sorption material specifications and thermal properties enhancement
 Min.")


15 Carbon grains and powder 100% grains X% grains + X% powder 100% powder Size Max. sieve opening (μm) Min. sieve opening (μm) Bulk density (kg/m 3 ) 12 x 30 USS 1700 μm 600 μm 560 kg/m 3 20 x 40 USS 850 μm 425 μm 527 kg/m 3 30 x 70 USS 600 μm 212 μm 553 kg/m 3 50 x 100 USS 300 μm 150 μm 513 kg/m 3 Powder 180 μm 0 μm 544 kg/m 3 Parameter Carbon type Solid carbon thermal conductivity Limiting concentration Value Chemviron 208C 0.85 W/(mK) kg/kg
16 Carbon thermal properties measurements 1. Steady state flat plates Q Q 2. Transient hot tube


17 Steady state flat plates measurements 2-inch diameter plates Calibration lines for round and square samples needed Compression Measurement Compression Measurement Thermal conductivity in parallel and perpendicular direction of compression


18 Tube temperature (C) Transient hot tube measurements 4 wire technique Simulation program needed for analysis Time (s)
19 Thermal conductivity (W/(mK)) Results: thermal conductivity % Grains - Anter 100% Grains - Hot tube Mixtures - Anter Mixtures - Hot tube 100% Powder - Anter 100% Powder - Hot tube Density (kg/m 3 )
20 Contact air layer thickness (mm) Results: wall contact resistance % grains 0.01 Mixtures % powder Density (kg/m 3 )
21 Contact layer thickness (mm) Thermal properties vs generator geometry d=0.25 mm d=0.5 mm d=0.9 mm 12x30 100% 30x70 100% 20x40 100% 30x70 50% 50x % 12x % x % 20x % Intrinsic thermal conductivity (W/(mK)) For a generator U-value of 600 W/(m 2 K) d
 Pore size / Aperture size Thickness / Wire diameter Glass filter 1.2 µm 0.26 mm Fine gauze 0.026 mm 0.")
22 Carbon choice and filling process Parameter Value Mixture type ⅔ 20x40 grains & ⅓ powder Carbon mass 3 kg Sorption material volume 4.7 l Packed density 640 kg/m 3 Packed thermal conductivity 0.3 W/(mK) Pore size / Aperture size Thickness / Wire diameter Glass filter 1.2 µm 0.26 mm Fine gauze mm mm Coarse gauze mm mm
23 Model programming


24 Generator Two-dimensional finite difference grid h sc h ws Condenser Evaporator Cooler Receiver Check valve Matlab
25 Simulation results

26 Carbon temperature over a cycle (one bed) t = 260 s mw = kg/s K C = 0.3 W/(mK) T HOT = 170 C T cond = 40 C T ev = 0 C
27 Pressure (bar) Ammonia pressures over a cycle Generator 1 Generator 2 Generator 3 Genertor 4 Evaporators Condenser Time (s) t = 260 s mw = kg/s K C = 0.3 W/(mK) T HOT = 170 C T cond = 40 C T ev = 0 C

28 Adsorbed ammonia over one cycle (one bed) t = 260 s mw = kg/s K C = 0.3 W/(mK) T HOT = 170 C T cond = 40 C T ev = 0 C
29 COPh Performance envelope T HOT = 170 C T cond = 40 C T ev = 0 C K C = 0.3 W/(mK) mw = kg/s mw = 0.03 kg/s mw = kg/s mw = kg/s mw = 0.06 kg/s mw = kg/s mw = 0.1 kg/s Envelope SHP (kw/kg)
30 COPh SHP (kw/kg) Performance map T HOT = 170 C T cond = 40 C T ev = 0 C K C = 0.3 W/(mK) COPh mw = kg/s COPh mw = 0.03 kg/s COPh mw = kg/s COPh mw = kg/s COPh mw = 0.06 kg/s COPh mw = kg/s COPh mw = 0.1 kg/s SHP mw = kg/s SHP mw = 0.03 kg/s 1.20 SHP mw = kg/s SHP mw = kg/s SHP mw = 0.06 kg/s SHP mw = kg/s SHP mw = 0.1 kg/s Cycle time (s)
31 COPh Effect of driving temperature on COPh and SHP T cond = 40 C T ev = 0 C K C = 0.3 W/(mK) Envelope 140 C Envelope 170 C Envelope 200 C 140 C 170 C 200 C SHP (kw/kg)
32 COPh Effect of condensing and evaporating temperatures on COPh and SHP T HOT = 170 C K C = 0.3 W/(mK) SHP (kw/kg) Evaporator 10 C - Condenser 50 C Evaporator 5 C - Condenser 50 C Evaporator 0 C - Condenser 50 C Evaporator -5 C - Condenser 50 C Evaporator 10 C - Condenser 40 C Evaporator 5 C - Condenser 40 C Evaporator 0 C - Condenser 40 C Evaporator -5 C - Condenser 40 C Evaporator 10 C - Condenser 30 C Evaporator 5 C - Condenser 30 C Evaporator 0 C - Condenser 30 C Evaporator -5 C - Condenser 30 C
33 COPh Relationship between COPh and output water temperature for a 7 kw machine and different evaporating temperatures (comparison with a condensing boiler efficiency) Evaporator 10 Evaporator 5 Evaporator 0 Evaporator -5 Condensing boiler T HOT = 170 C Temperature outlet water (C)
34 COPh Effect of adsorbent thermal conductivity W/(mK) 0.3 W/(mK) Envelope 0.1 W/(mK) Envelope 0.3 W/(mK) SHP (kw/kg)
35 Water temperature (C) Comparison of modified cycle simulations Ideal In Delays In Delays Speed Pump In Smooth delays Speed Pump In With convection effect In Time (s) Ideal Out Delays Out Delays Speed Pump Out Smooth delays Speed Pump Out With convection effect Out
36 Pressure (bar) Comparison of modified cycle simulations Time (s) Ideal Delays Delays Speed Pump Smooth delays Speed Pump With convection effect
37 Comparison of modified cycle simulations Type of cycle COPh Power output (kw) Ideal Delays Delays and speed pump effect Smooth delays and speed pump effect Smooth delays, speed pump and convective effect
38 COPh COPh Comparison of modified cycle simulations s 400 s 480 s 480 s 560 s 560 s 320 s s 120 s 140 s 140 s 180 s 160 s 100 s 160 s 180 s 200 s 220 s 240 s 200 s 220 s 240 s s SHP (kw/kg) Ideal Smooth delays, speed pump and convective effect Water mass flow rate = kg/s s SHP (kw/kg) Ideal Smooth delays, speed pump and convective effect Water mass flow rate = 0.1 kg/s
39 Construction of prototype system, instrumentation and control
40 Water pipework system Cooler Condenser
41 Ammonia pipework system Condenser Evaporators

42 Complete built system Gas burner?

43 Complete built system


44 Check valves Poppet type Ball type

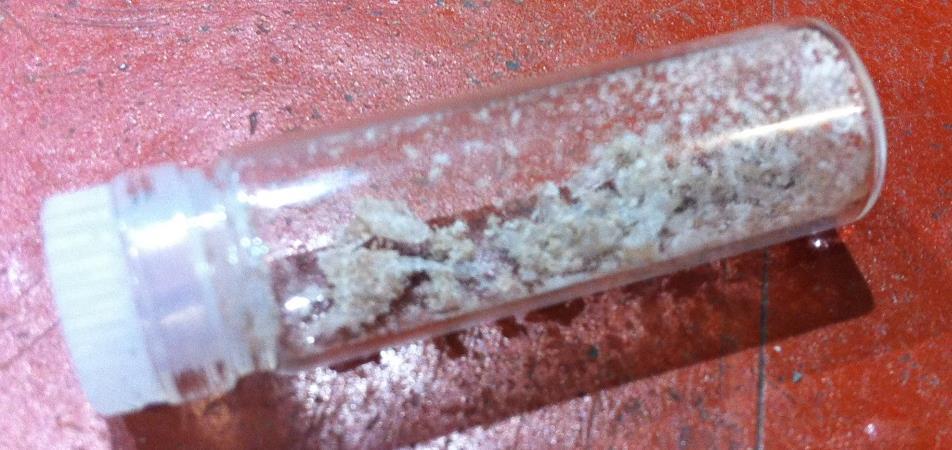
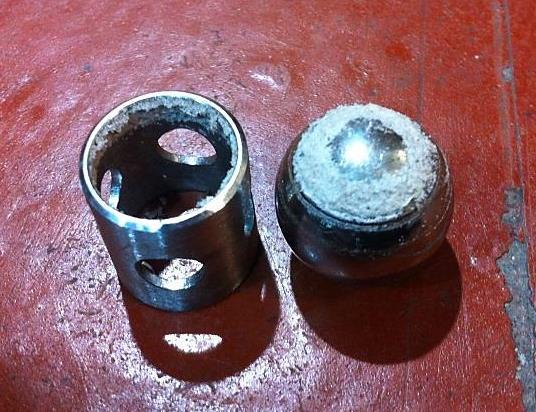
45 Check valve challenge: salts formation


46 Check valves Pneumatic valves If p bed > p cond or p bed < p ev - Bed opened for 6 s Bed closed for 2 s Re-evaluation of pressures


47 Water valves 4 - poles 4 - way switches PEEK and brown alumina
48 Experimental results and analysis, steady state performance tests

49 Insulation and heat loss test T chamber = 10 C T w,inlet = 95 C Heat loss = 520 W
50 Temperature (C) Pressure (bar) Experimental results Time (s) Bed A In Bed B In Bed C In Bed D In Hot Flow Cooler Out Bed A Out Bed B Out Bed C Out Bed D Out Hot Return T HOT = 123 C T cond = 30 C T ev = 11.5 C COPh = 1.18 (1.31) - SHP = 4.51 kw (4.30 kw) COPh = SHP = 4.84 kw Bed A Bed C Condenser m w = kg/s t = 400 s Time (s) Bed B Bed D Evaporator
51 Pressure (bar) Temperature (C) Modelling simulation comparison Time (s) Time (s) COPh = 1.18 (1.31) - SHP = 4.51 kw (4.30 kw) COPh = SHP = 4.84 kw Bed A in - Simulation Bed A in - Experiment Bed A out - Simulation Bed A out - Experiment Hot flow - Simulation Hot flow - Experiment Hot return - Simulation Hot return - Experiment Cooler out - Simulation Cooler out - Experiment Bed A - Simulation Bed A - Experiment Condenser - Smulation Condenser - Experiment Evaporator - Simulation Evaporator - Experiment
52 Temperature (C) Pressure (bar) Experimental results Time (s) Bed A In Bed B In Bed C In Bed D In Hot Return Cooler Out Bed A Out Bed B Out Bed C Out Bed D Out Hot Flow T HOT = 148 C T cond = 42 C T ev = 10 C COPh = 1.13 (1.26) - SHP = 4.92 kw (5.19 kw) COPh = SHP = 5.73 kw Bed A Bed C Condenser m w = kg/s t = 480 s Time (s) Bed B Bed D Evaporator
53 Pressure (bar) Temperature (C) Modelling simulation comparison Time (s) Time (s) COPh = 1.13 (1.26) - SHP = 4.92 kw (5.19 kw) COPh = SHP = 5.73 kw Bed A in - Simulation Bed A in - Experiment Bed A out - Simulation Bed A out - Experiment Hot flow - Simulation Hot flow - Experiment Hot return - Simulation Hot return - Experiment Cooler out - Simulation Bed A - Simulation Bed A - Experiment Condenser - Simulation Condenser - Experiment Evaporator - Simulation Evaporator - Experiment
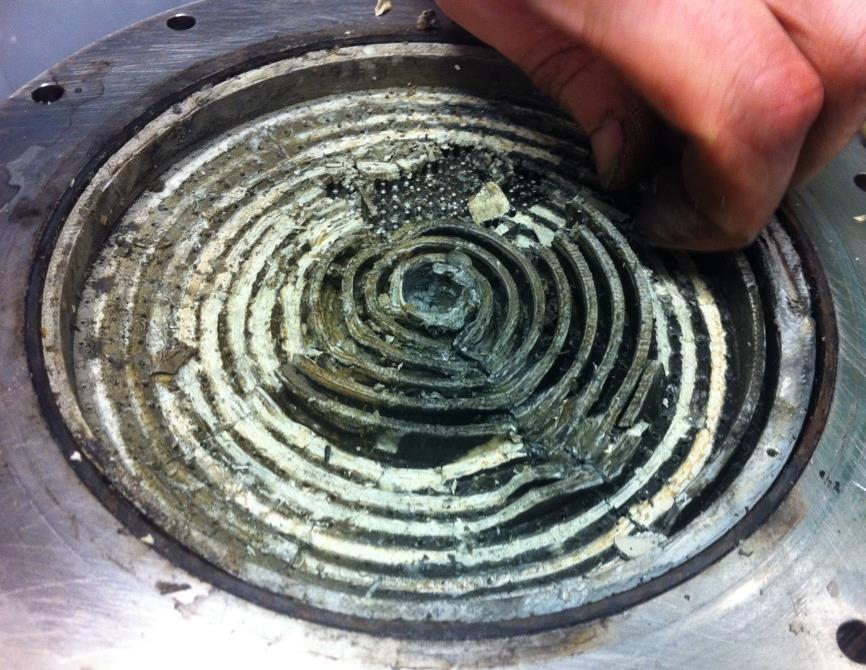
54 Challenges encountered Blocked generator tubes
55 Conclusions
56 All the project objectives initially presented were met: The design and manufacturing process of a low thermal mass and high density power sorption shell and tube heat exchanger was carried out. The performance of the four-bed heat pump cycle was analysed through computational modelling and compared with experiments for many different set of conditions in order to understand its behaviour and the effect these conditions have on the heating COP and heat output power. Measurements of the heat transfer properties of the active carbon were carried out. The thermal conductivity and wall contact resistance of carbon samples was tested by steady state flat plate and transient hot tube technique.
57 Binary mixtures of grains and powder were tested and it was found that they could achieve much higher densities, higher thermal conductivities and lower contact resistances at the same vibration or compression rates than grains on their own. The laboratory heat pump system was designed and constructed to test the adsorption generators and cycle. The testing of the machine showed results that were lower than the simulation predictions. After the testing, the beds were opened and it was discovered that the installed water distributors were completely distorted and deformed, blocking most of the tubes of the heat exchanger. This was the main reason for the low performance of the machine.
58 Future work
59 Future work The generators manufacturing technique should be developed in order to being able to mass produce them at a low cost. Improve marketability. The generators spiral water distributors should be remanufactured in a material that does not deteriorate at the heat pump driving water temperature (around 170 C). A proposed material to use would be aluminium due to its high thermal conductivity, high fusion temperature and easy machinability.
60 Future work Better positioning of the water valves and generators in order to reduce dead volumes of water that affect the system efficiency. Development of a carbon pre-treatment to remove the impurities that react with ammonia creating the ammonia salts presented that were cause of pipe blockages and check valves jamming. More research on heat transfer in carbon beds such as wall contact resistance reduction and thermal conductivity of carbon increase. This would lead to a reduction of the adsorption generators size and would make the system more compact and marketable.


61 Thank you for your attention! Questions and Answers time
62 We hope you enjoyed this webinar from the Institute of Refrigeration To access more webinars, technical guidance notes and information on technology innovation join the IOR the Institute for the RAC professional