Propagation of Uncertainty in Large Scale Eco-hydrological Modelling
|
|
|
- Natalie Joseph
- 5 years ago
- Views:
Transcription


1 Propagation of Uncertainty in Large Scale Eco-hydrological Modelling Fred Hattermann, Valentina Krysanova, Martin Wattenbach Potsdam Institut for Climate Impact Research
2 Outline Model validation including sensitivity and uncertainty analysis Scenario uncertainty in water supply under global change

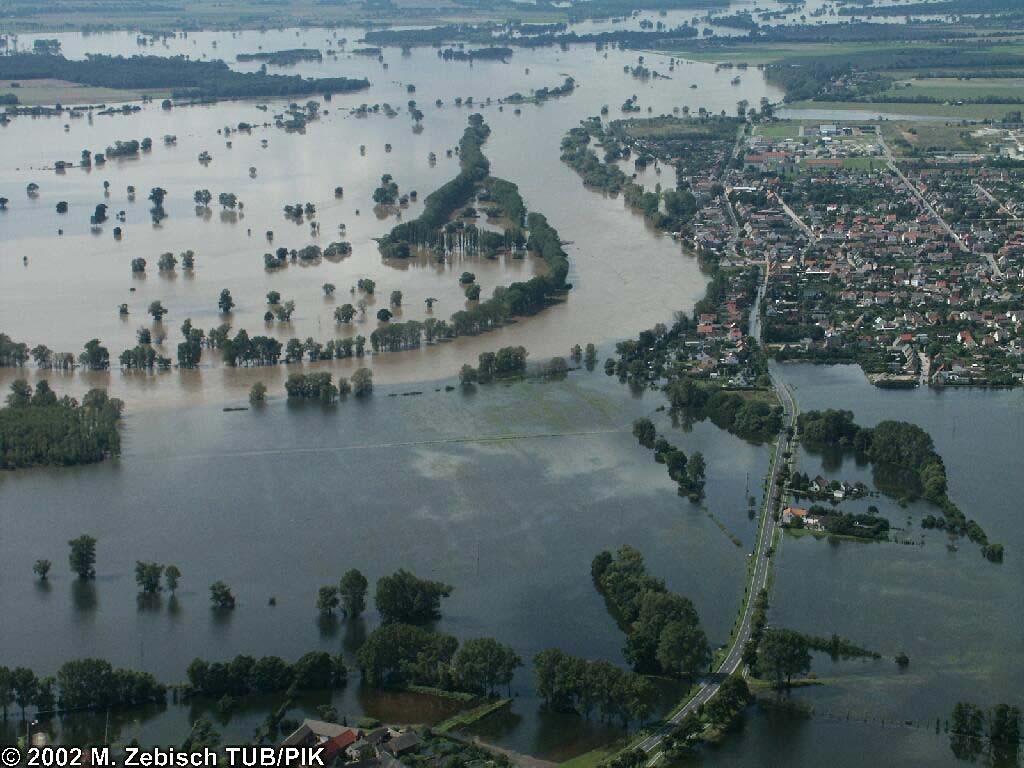
3 The River Basin (Elbe)

4 Soil and Water Integrated Model (SWIM, Krysanova et al. 1998)
5 Hydrological Validation Considering Sensitivity and Uncertainty Steps in the validation process: 1. Multi-scale, multi-site and multi-criteria hydrological validation 2. Definition of data and model parameter uncertainty 3. Analyses of the uncertainty in the model results Discharge deviation (difference river discharge observed Q obs simulated Q sim ): Nash & Sutcliffe efficiency. The Nash & Sutcliffe efficiency is defined from oo to 1. deviation = Q sim Q Q obs obs *100 ( Q Q ) obs sim ( Qobs Qobs ) efficiency = 1 2 2

6 Basins where s were performed (Hydrology, Nutrient Transport, Crop Yields)
7 Hydrological validation results in different types of landscapes in the Elbe river basin 1 Mountains 1 2 Loess area 2 3 Lowlands3 1: Selbnitz, area 1013 km 2,locatedin the southern mountains Efficiency: : Upper Mulde, area 2091 km 2,locatedin the loess regions Efficiency: : Stepenitz, area 1392 km 2,locatedin the northern pleistocene Efficiency: 0.72 observed simulated
8 Hydrological validation for the entire basin observed simulated 0 1/1/81 7/1/81 1/1/82 7/1/82 1/1/83 7/1/83 1/1/84 7/1/84 1/1/85 7/1/85 1/1/86 7/1/86 1/1/87 7/1/87 1/1/88 7/1/88 1/1/89 7/1/89 1/1/90 7/1/90 1/1/91 7/1/91 1/1/92 7/1/92 river discharge [m3/s] River discharge of the total Elbe basin (calibration period , validation period , efficiency 0.92).
9 Multi-criteria validation at multi sites water table [m] evapotranspration / recharge [mm] evapotranspiration recharge water table simulated water table observed precipitation Comparison of simulated against observed groundwater table dynamics precipitation [mm]
10 Sensitivity and Uncertainty Analyses: Sources of Uncertainty input data (of soil maps, soil parametrization, land use, climate data, digital elevation, biomass energy ratio, and others), model parameters (leaf area index, storage capacities, reaction factors), model structure (lumped - semi-distributed, river routing) socio-economic and policy developments and impacts (projections into the future)
11 Sources of Uncertainty uncertainty observations specific / complex model policy / management
12 Model Comparison Hooghoudt- Equation Boussinesq-Equation (Groundwater Modul) water table [m] gw recharge 1200 m distance from the river 400 m distance from the river groundwater recharge [mm] Comparison of groundwater table dynamics calculated by the simplified linear groundwater model (based on the Hooghoudt-Equation) and a numerical solution of the non-linear Boussinesq- Equation under well defined boundary conditions. 8 4 water table [m] Jan. 76 Jan. 77 Jan. 78 Jan. 79 Jan. 80 Jan distance to the river [m] hooghoudt asm Transient Steady state
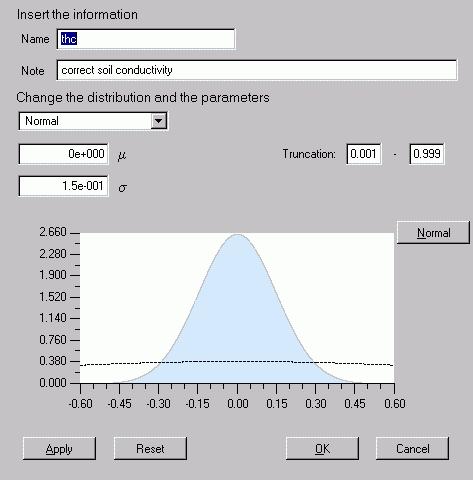
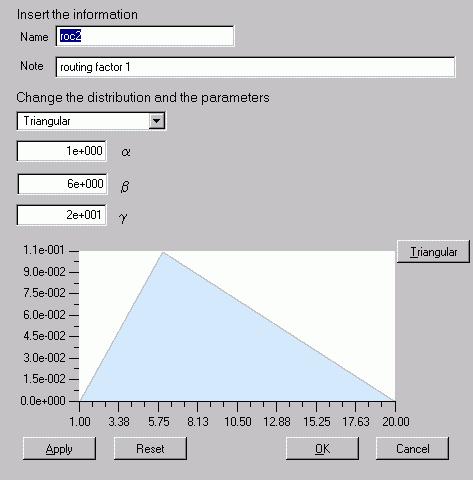
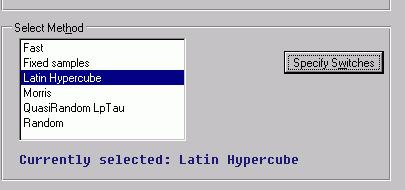
13 Sensitivity and Uncertainty Analyses A Monte Carlo Simulation was used to analyse the uncertainty or reliability of the model results and the sensitivity to changes in the input data and model parameters The analyses is based on 300 simulations with randomly sampled input parameters (deterministic model stochastic model). The uncertainty in data and parameters is expressed by probability distribution functions (correlations can be taken into account) The Latin Hypercube method was used in order to be sure that parameter combinations from the whole parameter space are represented in the limited number of simulations. The sensitivity was calculated using the Partial Correlation Coefficient (PCC), a measure of linear relationship between parameter value and model result.
14 Defining the Parameter Distributions expert knowledge observations data records

15 Examples: Sensitivity and Uncertainty Analyses Reliability of the simulated water balance Sensitivity of the model performance Ranking: to changes in Sensitivity river routing of the model results to selected parameters
.")
16 Results of the Uncertainty Analyses: Discharge Deviation mountains loess lowlands Elbe basin Left: Reliability of the water balance (difference discharge observed simulated).

17 Results of the Uncertainty Analyses: Efficiency mountains loess lowlands Elbe basin Left: Reliability of the efficiency (model performance).
18 Climate Change the Scenario Conditions Year 2050 IPCC A1: Globalisation/ Liberalisation Reference- Scenario business as usual IPCC B2: Regionalisation/ Ecological Development no trade barriers no support policies no preferences for regional food large climate impact Agenda 2000 policies limited trade support policies for regional and/or organic production strong preferences for regional food moderate climate impact
 has to be maintained. 3.")
19 Climate Change Preprocessing of GCM - Output Cluster analysis algorithm 1. Disaggregation of the GCM (Global Climate Model) - output using a cluster analysis algorithm. 2. The stability of the main statistical characteristics (variability, frequency distribution, annual cycle, persistence) has to be maintained realisations of the climate scenario with different temperature, precipitation etc. are generated. 4. Each scenario realisation is the input for one SWIM model run. mean annual Temperature [ C]


20 Changes in Water Fluxes under Scenario Conditions in the Elbe River Basin Mean Annual Values precipitation surface runoff evapotranspiration groundwater recharge red: / blue:

21 Change in Precipitation under Climate Scenario Conditions Mean annual precipitation Mean Variance annual Difference precipitation (% of in mean % precipitatin )
 mean annual recharge recharge 2051 2051-2055 - 55)")
22 Change in Groundwater Recharge under Climate Scenario Conditions Mean annual groundwater recharge Mean Variance Difference annual (in groundwater % of (%) mean annual recharge recharge )

 yields mean annual yields-2051")
23 Change in Crop Yields under Climate Scenario Conditions Mean annual crop yields Variance Mean Difference annual (in % crop of the (%) yields mean annual yields )
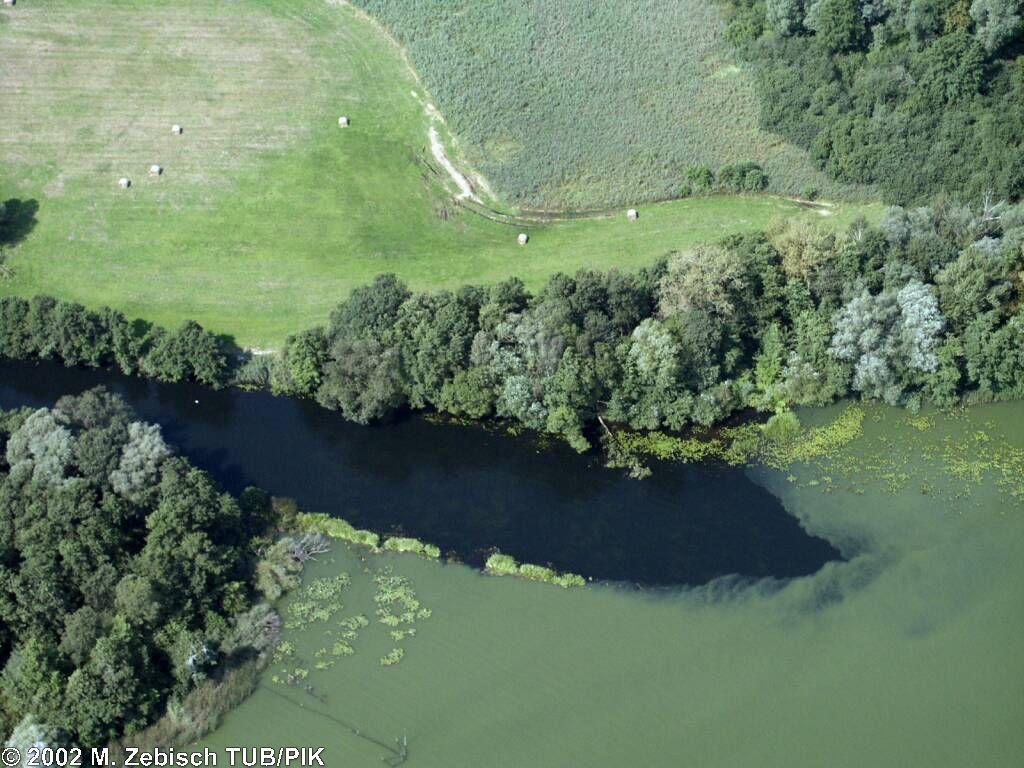
24 Example: Changes in Mean Monthly Groundwater Recharge groundwater recharge [mm] w1 v month month Restoration of the nature sanctuary Nieplitz lowlands
25 Summary and Conclusions By using the ecohydrological model SWIM in the German Elbe river basin it was shown that the model performance varies in different subregions of the basin such as mountains, loess regions and lowlands Hydrological responses, and accordingly the propagation of uncertainties are different in those subregions, due to the differences in essential hydrological characteristics The uncertainty of modelling results has been found higher in lowlands then in mountainous regions A multi-criteria validation and adjustment of model parameters can help to reduce uncertainty in the model results According to the global change scenarios the climate will become dryer in East Europe, but the uncertainty in the scenario results is high and thus even wetter conditions may occur in the future, although with a lower probability The uncertainty in the model results has to be considered in the scenario simulations, e.g. by Gaussian Error Propagation
26
27 Validation results: river discharge river gauge station topography efficiency daily efficiency monthly rel. diff. In discharge Saale Blankenstein mountains Mulde Wechselburg mountains / loess Löcknitz Gadow lowlands Elbe Neu-Darchau integrates all Top: Results for the validation period ( ) of three subbasins (one located in the mountains, one in the loess area and one in the lowlands) and the total Elbe basin.
 Precipitation Value of the reference period")

![0 [mm] [mm] 30 25 20 15 10 5 0 mean monthly surface run](/docs-images/88/115420221/images/28-2.jpg "off dry scenario medium scenario w et scenario reference")
28 Climate impacts on precipitation and vertical flows (mountains) Precipitation Value of the reference period Mean value of the 100 ralisations Surface flow Interflow Groundwater Recharge [mm] [mm] mean monthly surface run off dry scenario medium scenario w et scenario reference month
29 Climate impacts on precipitation and vertical flows (lowlands) Precipitation Value of the reference period Mean value of the 100 ralisations Surface flow Interflow Groundwater Recharge [mm] mean monthly groundwater recharge dry scenario medium scenario wet scenario reference month
30 Pre-processing: Defining the Parameter Space
31 Uncertainty expressed by the distribution of model results. Sensitivity to one single parameter

32 Uncertainty in Water Management
33 Uncertainty small scale N-parameter fields (conductivity, porosity) Reconstruction of the sub-surface by geostatistical simulation techniques based on drill hole information Certainty of the reconstruction
34 Uncertainty local to small scale Reliability of the position of the freshwater drainage area