NEW Water: Green Bay Metropolitan Sewerage District
|
|
|
- Britney Sullivan
- 5 years ago
- Views:
Transcription

1
 18 municipal customers 219,000 residents 285 square mile area Vision: Protecting our most valuable resource, water. 14 years continuous compliance at Green Bay facility.")
2 NEW Water: Green Bay Metropolitan Sewerage District Third largest wastewater treatment facility in Wisconsin Currently treat 38 million gallons a day Two facilities Green Bay Facility (30mgd) De Pere Facility (8mgd) 18 municipal customers 219,000 residents 285 square mile area Vision: Protecting our most valuable resource, water. 14 years continuous compliance at Green Bay facility. WPDES Permit, Issued July 1, 2014 Projected future TP and TSS limits NEW Water Effluent


3 Sources of Phosphorus in Lower Fox River (LFR) Basin Fox River contributes 1/3 nutrients to Lake Michigan (Data Source: Total Maximum Daily Load - TMDL Watershed Plan for Lower Fox River March 2012)


4 Silver Creek Pilot Project NEW Water - Watershed Size: 4,800 Acres - Land Use: 48%Agriculture - Stream Length: 15 Miles


5 Partnerships in the Silver Creek Pilot Project

6 Silver Creek Pilot Project From the Beginning 2014 Project Kickoff Developed project partners Water quality sampling Soil sampling Stream surveys 2015 Watershed Inventory Comprehensive field evaluations Arc GIS tablet application Conservation planning meetings Developed conservation and enhanced nutrient mgmt. plans
 Critical area plantings Grassed waterways Cover Crops Residue Management Etc. BMP Verification Coordination, coordination, coordination.")
7 Silver Creek Pilot Project 2016 & 2017 Water quality monitoring Field planning Cost share agreements Best Management Practices (BMPs) installation Filter strips (buffers) Critical area plantings Grassed waterways Cover Crops Residue Management Etc. BMP Verification Coordination, coordination, coordination.
8 2017. By The Numbers Sampling January 1, October 30, grab samples 75 event samples Conservation and Enhanced Nutrient Management Plans Over 1500 acres Cost Share Agreements 9 Structural BMP Contracts 5 Deed recordings completed 7 Operational BMP Contracts Structural Best Management Practices 5 Critical area plantings 15 Filter strips (buffers) 1 Rock Crossing Winter Cover in Fields 540 acres of cover crops 85% of cropland covered by either alfalfa, cover crops, winter wheat, forage, pasture, or grass % %


9 Timeline of Grassed Waterway Project South East Aug 31, 2016 Aug. 16, 2016


10 Timeline of Grassed Waterway Project South East Nov. 29, 2016 Silver Creek Oct. 4, 2016


11 Timeline of Grassed Waterway Project South East Silver Creek Oct 9, 2017 June 13, 2017

12 Timeline of Grassed Waterway Project South East Silver Creek Dec 1, 2017


13 Filter Strips Projects East Dec 1, 2017 Aug. 23, 2017


14 Water and Sediment Control Basins (WASCOB) June 13, 2017 Oct. 9, 2017

15 Vegetated Water Treatment Systems

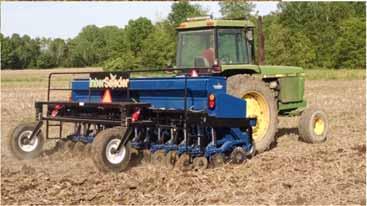
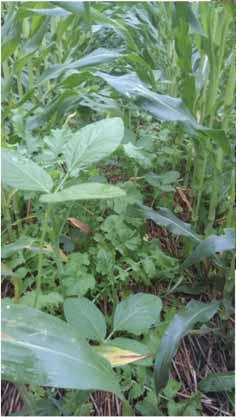
16 Cover Crop Interseeder

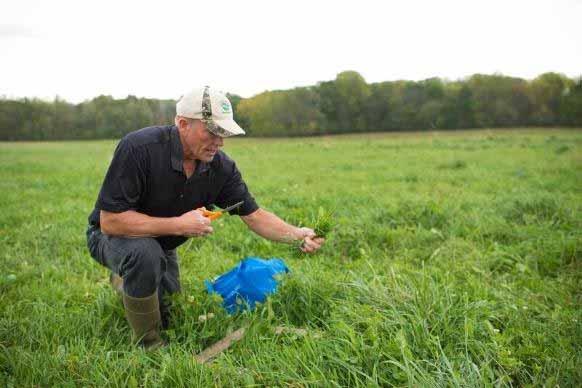
17 Managed Grazing Operation


18 Wetland Restoration Efforts 7 Wetland Basins 45 Wetland Acres 650 Acre Drainage Area
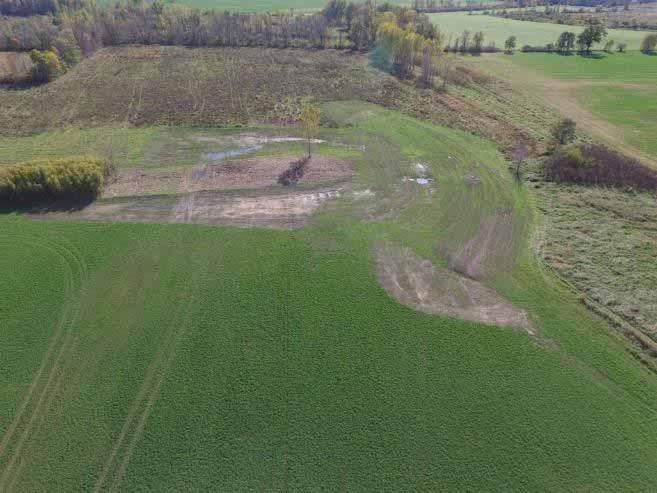

19 Wetland Restoration Efforts

20 AM SL-172 SL-FLD SL-COU SL-FCR SL-CKR


21 Stream Sediment and Drain Tile Sampling
22 2017 Total Phosphorus: January - December SL-172 SL-FLD SL-COU SL-CKR SL-FCR Event ON40W ON41W n=26 n=46 n=26 n=24 n=23 n=77 n=22 n= Total Phosphorus (mg/l) /1/2017 1/31/2017 3/3/2017 4/2/2017 5/3/2017 6/2/2017 7/3/2017 8/2/2017 9/2/ /2/ /2/ /2/2017 1/2/2018
23


24 Total Phosphorus: January - December 2017 SL-FLD Event Total Phosphorus (mg/l) /1/2017 1/31/2017 3/3/2017 4/2/2017 5/3/2017 6/2/2017 7/3/2017 8/2/2017 9/2/ /2/ /2/ /2/2017 1/2/2018
25 2017 Total Suspended Solids: January - December 2017 SL-172 SL-FLD SL-COU SL-CKR SL-FCR Event n=26 n=46 n=26 n=24 n=23 n= Total Suspended Solids (mg/l) /1/2017 1/31/2017 3/3/2017 4/2/2017 5/3/2017 6/2/2017 7/3/2017 8/2/2017 9/2/ /2/ /2/ /2/2017 1/2/2018
26 Total Phosphorus (mg/l) Silver Creek WDNR Median Total Phosphorus WQ Std Upstream Downstream SL SL - FLD grab SL - FLD Event SL - COU SL - CKR SL - FCR Silver Creek WDNR Median Total Suspended Solids WQ Std Total Suspended Solids (mg/l) Downstream Upstream 0 SL SL - FLD grab SL - FLD Event SL - COU SL - CKR SL - FCR


27 Outreach Events 3 rd Annual Student Monitoring Event Interseeder Dedication Ceremony Grazing and Cover Crop Field Day NRDA Trustees Tour State of Lake Michigan Conference Tour Over 25 presentations

28 Next Steps in Silver Creek Cover Crops How are cover crops going to be continued in the future? Residue and Tillage Management How do we continue to encourage this in the future? Interseeding Cover Crops How can we utilize the interseeder more?
29 Full Scale Adaptive Management Evaluations and Next Steps in 2018

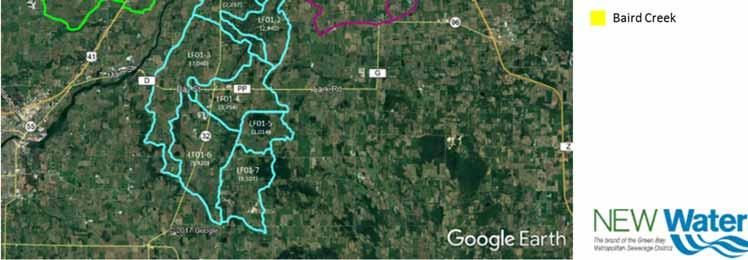
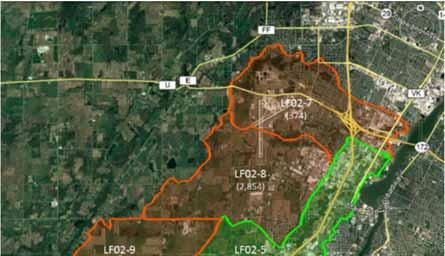
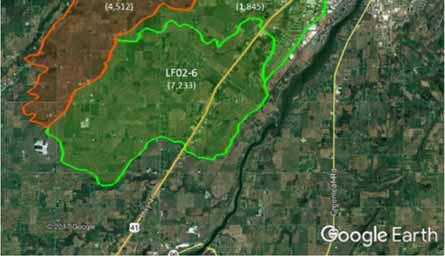
30 Opportunities in Adjacent Watersheds Silver Creek
31 Watershed Evaluation Criteria 1. Sub watershed Size 2. Sub watershed Land Use and Agricultural Contribution 3. Geographic Location 4. Nine Key Element Plan Status 5. Potential Load Partners 6. Flow and Water Quality Data 7. Ongoing Agricultural Watershed Projects 8. Severity of Perceived Issues 9. Technical Resources

32 Multiple Scenarios Led to Similar Conclusions
33 Ashwaubenon/Dutchman Creeks
34 Next Steps for a Full Scale Program Memorandum of Understanding with WDNR Finalize Action Area Evaluation Preliminary Compliance Alternatives Plan (March 31, 2018) Comparison of Treatment and Watershed Alternatives Review with Commission Chart path forward for compliance plan Adaptive Management Plan (December 31, 2018) Final Compliance Alternatives Plan (December 31, 2018)
35 A Full Scale Watershed Management Program NEW Water Commission Approved Full Scale Planning in 2018 Position NEW Water to advance AM as part of the phosphorus and TSS compliance strategy Similar starting tasks as the Pilot Workgroups and partnership agreements Soil sampling Field walks and conservation planning Water Quality Monitoring Flow Monitoring
36 Two Workgroups to Advance Planning Watershed Inventory Water resource opportunities beyond the farm field Support prioritizing opportunities Biological Monitoring Habitat assessments Fish and marcoinvertebrate sampling plans Select location(s) and frequency
37 Unique Opportunity The Environmental Programs Division is expanding upon a legacy of water quality attentiveness and monitoring. Adaptive Management provides a way for NEW Water to meet recent WPDES permit requirements through improving the health and quality of local watersheds. By linking the established AMP database with a new watershed database, NEW Water is uniquely situated to document future water quality improvement in Green Bay and area rivers.

38 Thank You! Questions? Jeff Smudde Watershed Programs Manager Green Bay Metropolitan Sewerage District T: (920) E: