Introduction to Benthic-invertebrate Biomonitoring and Biocriteria
|
|
|
- Garry Gray
- 5 years ago
- Views:
Transcription


1 Introduction to Benthic-invertebrate Biomonitoring and Biocriteria Chris Jones 1 and Sarah Sinclair 2 1 Ontario Ministry of Environment, Dorset Environmental Science Centre 2 Saugeen Valley Conservation Authority
2 Why Monitor? Change is an intrinsic property of ecosystems. For effective conservation, acceptable rates and directions of change need to be determined. A preliminary step is the development of methods for detecting, measuring and assessing the significance of ecological change. J.M. Hellawell, 1977
3 Biomonitoring Rationale Biomonitoring is required because the consequences of environmental stress can only be determined by an appraisal of the biota. Wright (2000) Since the effect of stream pollution is an alteration of the aquatic ecosystem, evaluation of that ecosystem is the logical way to detect pollution Hilsenhoff (1977)


4 Stressor- and Effect-based Monitoring Activities are Complementary We need both Water-chemistry Survey Benthic-invertebrate Biomonitoring

5 mg/l ug/l CA2 Biology Benthos data, Pretty River, October 1996; reference site data, % confidence ellipse Stressor and Effectbased Approaches are Complementary Noisy Mad R. Nottawasaga Pine 2 Pine 1 Sheldon Pretty CA1 Chemistry = Ontario Water Quality Objective Phosphorus Data: Zinc Data: Pretty River, Highway 26, Collingwood, Ontario Pretty hwy. 26, Collingwood Pretty Hwy. 26, Collingwood

6 What are Benthos? Bottom-dwelling aquatic invertebrates Include animals like insects, worms, mollusks, crustaceans, and mites Mayfly of the family Ephemerellidae. Caddisfly of the family Helicopsychidae


7


8 Benthic Invertebrate Community: an Example of a Good Indicator Abundant and widespread Easily and inexpensively sampled Sedentary & relatively long lived (months to years) Many species, having different tolerances Respond to multiple stressors that affect habitat and water/sediment chemistry Provide early-warning (Rosenberg & Resh 1993, 1996; Mackie 2001)


9 Introduction to OBBN Training Protocol Database OBBN Research Analytical Software

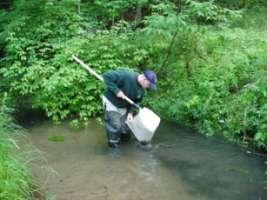
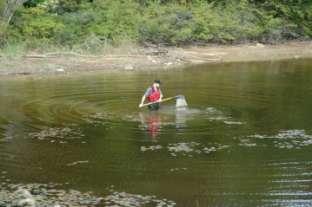


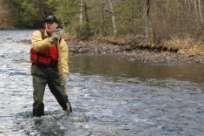
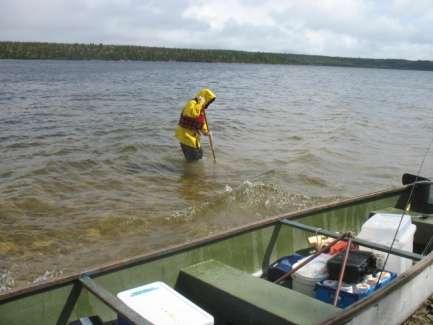
10 Sampling Methods
 Sampling unit is Transect lake segment 1 m depth contour Replicate #2 Replicate #3 10 minute traveling kick and sweep along transects 3 replicates")
11 Lakes Sampling Unit Replication Collection Method Replicate #1 OBBN Protocol Manual assumes scale of bioassessment question is a section of lake shoreline, not a whole lake Lake Segment (sampling unit) Sampling unit is Transect lake segment 1 m depth contour Replicate #2 Replicate #3 10 minute traveling kick and sweep along transects 3 replicates collected

12 Streams Replication & collection methods Samling unit encompasses 2 riffles and 1 pool (often meander sequence) Pool Riffle or cross-over Transect Traveling Kick and Sweep 2 transect subsamples in riffles, one in pool Riffle or cross-over ~ 3 minute, 10 m kick Pool Riffle or cross-over Flow Optional Transect Sampling Location Sampling Reach Boundary

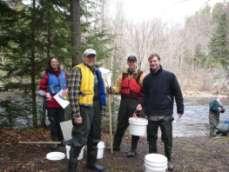
 Bucket")

 ID and")


13 Sample Processing Sieve Sub-sample Marchant Box (preferred) Bucket method Sort carefully (microscope preferred) ID and tally (taxonomic level matches training; Family or more detailed preferred) 100-count (minimum) Preserve and archive sample

14 Research
15 Problem: Healthy is Variable. Dr. Robert Bailey, University of Western Ontario 2 equally healthy sites may have different biological assemblages Need to determine what normal is Biomonitoring conundrum: Is an observed difference greater than expected by chance? Is it biologically meaningful? Stream Sample Date Partner HYDRACARINA Trhypochthoniidae 2 1 EPHEMEROPTERA Baetidae Ephemerellidae 1 2 PLECOPTERA Leuctridae 1 1 Capniidae 1 0 Perlodidae 6 5 Chloroperlidae 0 1 TRICHOPTERA Rhyacophilidae 2 1 Hydropsychidae 2 3 COLEOPTERA Elmidae DIPTERA Chironomidae Ceratopogonidae 3 2 Tipulidae 4 6 Simulidae 0 2 Empididae 1 0 Total:
16 Problem: Healthy is Variable. Dr. Robert Bailey, University of Western Ontario 2 equally healthy sites may have different biological assemblages Need to determine what normal is Biomonitoring conundrum: Is an observed difference greater than expected by chance? Is it biologically meaningful? Stream Sample Date Partner HYDRACARINA Baxter Baxter Riffle 1 Riffle 2 16-Aug Aug-04 ORCA ORCA Trhypochthoniidae 2 1 EPHEMEROPTERA Baetidae Ephemerellidae 1 2 PLECOPTERA Leuctridae 1 1 Capniidae 1 0 Perlodidae 6 5 Chloroperlidae 0 1 TRICHOPTERA Rhyacophilidae 2 1 Hydropsychidae 2 3 COLEOPTERA Elmidae DIPTERA Chironomidae Ceratopogonidae 3 2 Tipulidae 4 6 Simulidae 0 2 Empididae 1 0 Total:
17 Experimental Designs for Bioassessments Has the Is when and impact where Is there a occurred? known? control area? Experimental Design Name Yes Yes Yes Spatial Study (Control-Impact) No Impact from Spatial Pattern No Yes Reference Condition Approach No Modern Analog Approach No Yes Yes Optimal Impact Study (BACI) No Temporal (Before-After) No Yes Monitoring for When No Monitoring for Where (Adapted from Green 1979 [Bowman and Somers 2005]; see also Underwood 1997)

 against which")

18 Reference Condition Approach (RCA) Multiple, minimally impacted control sites to define the normal range of biological conditions to be expected at a test site Reference site Test site Long-term monitoring programs provide the measures of normal (reference data) against which the abnormal is judged. It is impossible to convince a court that something is wrong if right is not defined. MOEE Biomonitoring Review Committee, 1994


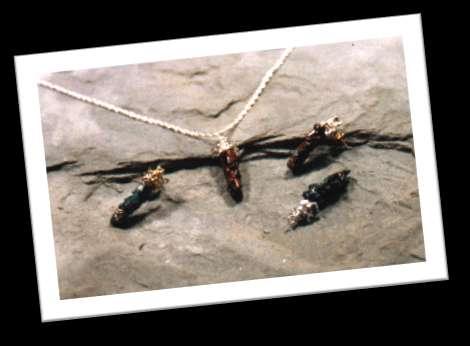
19 Can You Spot the Reference Site????

20 20

21 Reference Criteria and Biocriteria

22 Biological Biocriteria Indices 10 th Percentile 90 th Percentile Example of Biocriteria (south-western Ontario) % Chir % CIGH % Clit % EPT % FC % GC % P % SC % SH FBI Richness


23 Other Research

24 24 Summary