MAPPING GLOBAL NUCLEAR EXPANSION
|
|
|
- Evelyn Owens
- 5 years ago
- Views:
Transcription

1 MAPPING GLOBAL NUCLEAR EXPANSION Sharon Squassoni Senior Associate November 5, 2007 With Georgina Jones and Nima Gerami, research assistants
2 Nuclear Energy Today 6% global electricity demand 3 countries operating 439 reactors (37 GW) countries with 50 million SWU enrichment 5 countries separating plutonium commercially 0 countries with geologic repositories for nuclear waste
3 3 UNITED STATES 99 I: Reactor Capacities, 2007* (Gigawatts electric, GWe) 2 OECD EUROPE JAPAN 48 *See separate Appendix for details, assumptions, and data for this and other maps.


4 II: States Enriching Uranium, 2007

5 III: States Reprocessing Spent Fuel, 2007


6 Nuclear Energy Enthusiasm Since 2005, over 20 states have announced new plans for nuclear power Perceived as clean and green Greater energy security (?) But what about proliferation? (as well as cost, safety, waste?)
7 Does Geography Matter? Nuclear energy increasingly attractive to nuclear neophytes those without nuclear power now. 3 states in Middle East want nuclear Has Iran s nuclear program influenced? Energy security has geographic underpinnings To have any impact on climate change, it matters where nuclear energy grows (need to offset greatest potential growth in carbon emissions as in India, China)
8 Proliferation and Geography When do reactors spur enrichment and reprocessing also? Efforts to restrict technology transfer are foundering More states now interested in such capabilities Nuclear enthusiasm outstripping rules and institutions for managing Perennial issues: developing scientific and technological base and security & control of nuclear material
9 Nuclear Expansion Scenarios* Scenario I: Meeting demand in 2030 (EIA) Scenario II: Planning supply for 2030 Scenario III: Climate change requirements in 2050 a. One nuclear wedge (Pacala, Socolow) b. MIT 500 GW c. Stern Report (2-6 wedges ) * See following slides and separate Appendix for details of scenarios
10 Scenario I: Meeting Demand in 2030 Energy Information Administration (EIA) projections look at GDP growth, energy demand, end-use sector, electricity supply, with nuclear as share Limitations Nuclear energy projections done off-line Regional estimates (with a few country-specific ones) Wildcards = Retirements, Western Europe
11 Scenario II: Planning Supply for 2030 This scenario takes at face value states announced plans for nuclear development. Wild optimism? Strong growth in Asia (India, China) New nuclear reactor states Possibly new enrichers, reprocessers?


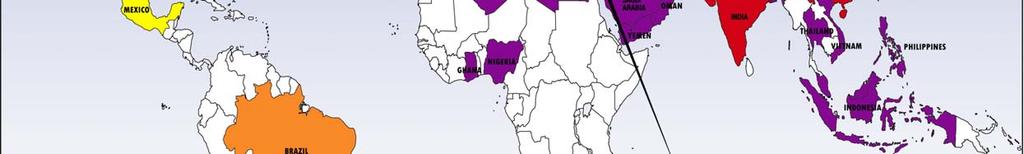

12 IV: Where Will Nuclear Energy Grow?


13 V: A Closer Look at New Nuclear States Proposals as of 2007
14 Scenario III: Global Climate Change, 2050 From tripling to quadrupling capacities a. Gigaton of carbon emissions reduction (Pacala-Socolow wedge ) = GWe for a total of 070 GWe reactor capacity b. 500 GWe = MIT study high scenario c. 2-6 Gigatons of carbon emissions reduction (Stern Report) = GWe
15 KEY: VI: Reactor Capacities for all Scenarios* (Gigawatts electric, GWe) Current Capacity 3 UNITED STATES 99 I EIA Forecast II Proposed Expansion II Proposed New Capacity III.b MIT Expansion III.b MIT New Capacity 4 2 *New nuclear capacities (red, green dots) not necessarily to scale; consult Appendix for data. 3 5 OECD EUROPE JAPAN 48 6

16 VII: A Closer Look at New Nuclear Reactors Scenarios II and III (GWe) II Proposed New Capacity III.b MIT Expansion III.b. Capacity 2050 MIT New KEY: 9 6 6
17 M illions SW U / Year Enrichment Implications* Scenario I Scenario II Scenario III: a. Wedge *See separate Appendix for details. Numbers are rough approximation. 52 Scenario Scenario III: b. MIT 225 Scenario III: c. Stern Number of Plants
18 Variables Affecting Enrichment Projections 90% operating power reactors currently use LEU Assumptions about reactor technologies and the fuel cycle (open or closed) matter a lot in projections Example: 500 GWe LWRs = 225 million SWU/year 500 GWe with MOX reactors ( recycle) = 89 million SWU/year 500 GWe with fast, thermal reactors: 23 million SWU/year
19 KEY: VIII: Enrichment Capacities for all Scenarios (million SWU/year) Current Capacity I EIA Forecast II Proposed Expansion II Proposed New Capacity III.b MIT Expansion III.b MIT New Capacity 9 USEC RESENDE 0.2 URENCO 8. EURODIF TENEX CNNC 6 6 JNFL
20 Spent Fuel: How to Handle? Reactor expansion raises questions about how to handle spent fuel. Basic options are storage vs. reprocessing; no way to predict National policies vs. international norms Existing storage capacities (S. Korea?) Fuel cycle approaches (once-through, one recycle, fast reactors?) New technologies (reactors & recycle) Cost GNEP Factor

21 Storage Capacities GWe LWR produces 20 MT spent uranium oxide fuel/yr Scenario II : 700 GWe will require 4 Yuccas (NRDC)* Scenario III a: 000 GWe will require a Yucca every 3.5 years (or, 20 Yuccas; MIT) Scenario III b: 500 GWe ~ 30 Yuccas * Assuming Yucca can only hold 70,000 MT
22 Spent Fuel Build-Up? 8 countries now = 80% of global reactor capacity Of 8, half don t reprocess: US, Canada, Ukraine and South Korea All but Canada are reconsidering By 2050, the only countries with comparably-sized fuel cycles will be China and India, both of which will reprocess Other states won t face a storage shortage
23 Fuel Cycles Dictate Waste Scenario IIIb: 500 GWe* [ DATA] Once-through (no reprocessing) ~30,000 MTIHM/yr spent fuel = 30 Yuccas** Thermal reactors with one MOX recycle ~25,000 MTIHM/yr uranium oxide is reprocessed (plus separated uranium, high-level waste in glass, etc) = 22 Yuccas (?) and 5 La Hagues Balanced cycle with fast and thermal reactors ~6,000 MTIHM/yr uranium oxide and 4,700 MTIHM of FR fuel is reprocessed leaving pyroprocessing waste, etc =4 Yuccas (?) & 0 La-Hague-sized pyroprocessing plants *est. burn-up = 50 GWd/MTIHM (millions tons initial heavy metal) ** Assuming Yucca can only hold 70,000 tons

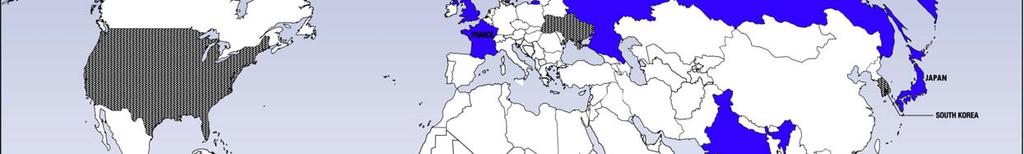
24 IX: States Reprocessing?
25 Summary Expansion plans are unrealistic Proliferation concerns are real Reactors require infrastructure, expertise, some of which can be applied to a nuclear weapons program Enrichment, reprocessing not yet off the table Real expansion will entail massive flows of sensitive material
26 Summary Even if nuclear power expansion fizzles, some states may go ahead with plans Few financial barriers to enrichment ($2 B per plant; 5 years construction for URENCO) Cost & waste are still issues for reprocessing. Second-tier nuclear suppliers -- China, India?
27 Additional Questions. Retirements of reactors a wild card after Forecasts assume light water reactors. What about a) PHWR exports from India, China, Canada?; and b) lower enrichment requirements if MOX fuel cycle or fast reactor with actinide recycling pursued. 3. Issue of electricity grids developing nations may purchase much smaller sized reactors than planned 4. Uranium enrichment -- not expensive ($-2B) or long (5 years) to build, but environmental hazards?; wide range of enrichment per GW (-.5M SWU) 5. Western European reactor plans quite variable