Tuzzy Talk # 6: Effects of Oil, Dispersants and Dispersed Oil on Organisms Part 1: Introduction to Toxicology
|
|
|
- Rose Jennings
- 5 years ago
- Views:
Transcription
1 Tuzzy Talk # 6: Effects of Oil, Dispersants and Dispersed Oil on Organisms Part 1: Introduction to Toxicology Oct 4, 2014 Nancy E. Kinner University of New Hampshire Center for Spills in the Environment
2 Tuzzy Talks Tuzzy Talks Series 1: (March 2013) What Is Crude Oil? and What Happens When It Gets in Water? Tuzzy Talks Series 2: (Feb April 2014) Biodegradation of Crude Oil Dispersants and Dispersed Oil (DDO) Natural Dispersion Chemically Enhanced Dispersion Tuzzy Talks Series 3 (Oct Nov 2014) Effects of Oil, Dispersants and Dispersed Oil on Organisms 2
3 Dispersants and Dispersed Oil (DDO) Tuzzy Talk DDO #1: Natural Dispersion Relevant oil properties What is dispersion? What affects how spilled oil disperses? At the surface Subsea How is dispersed oil transported? What happens to dispersed oil? 3
4 Dispersants and Dispersed Oil (DDO) Tuzzy Talk Series 3: Effects of Dispersants and Dispersed Oil Overview of toxicology (Today) What is toxicity? What does toxicity mean? How is toxicity measured? Are dispersants and dispersed oil toxic? What do we currently know about dispersant and dispersed oil toxicity? What research is being conducted on dispersant and dispersed oil toxicity? 4
5 Overview of Toxicology What is toxicity? What does toxicity mean? How is toxicity measured? 5
6 Dispersants and Dispersed Oil (DDO) Tuzzy Talk DDO #2: Chemically Enhanced Dispersion What are chemical dispersants? How do they affect dispersion of oil compared to natural dispersion? Why are chemical dispersants used in oil spill response? How are chemical dispersants applied? What happens to chemically dispersed oil? What happens to the chemical dispersant? 6
7 Toxicology Study of harmful effects Caused by natural or synthetic pollutants Ecotoxicology if effects are to members of ecosystem Plants Animals (including humans) Microbes Individuals Popula ons Communi es Ecosystems Ecoregions Biosphere Within Individuals Biomolecules Cells Tissues Organs Organ Systems 7
8 Ecotoxicology Develop tools/methods to understand contaminant fate and effects in biosphere Individuals Biosphere 8
9 Ecotoxicology Field is Rapidly Changing! 9
10 Main Exposure Route Ingestion (digestive tract, gut) Skin Absorp on Inhala on gills, lungs Contaminant interaction with surfaces of cells (skin, gut, gill, lung) 10
 into cell Outside Cell Inside Cell Lipid")
11 Uptake Mechanisms Movement across cell membrane (lipids) into cell Outside Cell Inside Cell Lipid membrane 11

12 Outside Cell Inside Cell Contaminant Fundamentals of Ecotoxicology M.C. Newman (2010) 12
13 Model of Fate of Lipophilic Organics in Organisms Principles of Ecotoxicology C.H. Walker et al. (2012) *Lipophilic = loves lipids Soluble in lipids (oil compounds) 13
14 Contaminant Action Contaminant acts on organism Contaminant interacts with cell s DNA or proteins DNA is nuclear material (genes) Contaminants interact with cell s structure Membranes (lipid bilayer) 14
15 Contaminant Metabolism Organism acts on contaminant Detoxifies contaminant Can make it more toxic Biotransformation of contaminant 15
16 Contaminant Storage Contaminant is not acting on organism Organism is not acting on contaminant Contaminant is in non active state in organism (stored) 16
17 Contaminant Excretion Contaminant may be excreted unchanged More likely contaminant excreted after biotransformation 17
18 Reality Check Usually not just one step May be multiple sites where things occur 18
19 Model of Fate of Lipophilic Organics in Organisms Principles of Ecotoxicology C.H. Walker et al. (2012) *Lipophilic = loves lipids Soluble in lipids (oil compounds) 19
20 Toxicokinetic Processes Toxicodynamic Processes Uptake Distribution Metabolism Molecular Interaction at Site(s) of Action 20
21 Contaminant May Be Toxic to One Species and Not Another Why? 1. Toxicokinetic Processes Don t Get Active Form of Contaminant to Site of Action or 2. Toxicodynamic Processes Don t Produce Much Toxic Response at Site of Action 21
22 Toxicokinetic Processes Toxicodynamic Processes Uptake Distribution Metabolism Molecular Interaction at Site(s) of Action 22
23 Some Major Routes of Uptake Fish Gills Dissolved or Suspended Contaminants in water Digestive Tract Food Aquatic Mammals and Birds Digestive Tract Food Aquatic Amphibians Digestive Tract Food Skin Dissolved or Suspended Contaminants in water 23
24 Some Major Routes of Uptake (Con d) Aquatic Invertebrates Digestive Tract Food Respiratory Surface Dissolved or Suspended Contaminants Plants Leaves Droplets or Particulates Leaves Vapors Roots Dissolved Contaminants in Soil Water 24
25 Hydrocarbons from Oil Most not very soluble in water Most very soluble in fats (lipids) 25
26 K ow Octanol Water Partition Coefficient Kow = X o X w = Equilibrium Concentration of Contaminant in Octanol Equilibrium Concentration of Contaminant in Water Octanol is a fatty alcohol Octanol and water don t mix 26
27 K ow Facts Ranges from (highly soluble in water, not in octanol) to 10 7 (highly soluble in octanol, not in water) Log K ow = 3 to 7 K ow not very dependent on temperature K ow is unitless 27
28 K ow Values Compound Formula K ow Temp ( C) Pentane C 5 H (0.20) Tetradecane C 14 H (1.00) Benzene C 6 H (0.10) 25 Anthracene C 14 H (0.15) 25 Chrysene C 18 H (0.40) 25 28
29 Implications of K ow for Movement of Contaminants in Cells Biological Barriers = Cell Membrane, Gills, Skin, Digestive Tract Biological barriers usually lipophilic (cell membranes are lipid bilayers) Cell contents mostly water, so contaminants need to be hydrophilic 29
30 Implications of K ow for Movement of Contaminants in Cells (Con d) K ow much less than 1.00 High soluble in water, low soluble in biobarriers K ow approximately 1.00 can move across biobarriers and be soluble in cell water K ow much greater than 1.00 Soluble in biobarrier, but not in cell s water 30
31 K ow Not Only Factor in Movement Across Biobarriers Large molecules can t move through High soluble in water, low soluble in biobarriers Temperature low means biobarrier less fluid so less movement across them 31

32 Cell Membrane wpack.php?packid=19735
33 file:///c:/users/nek/desktop/fluidmosaic.gif Cell Membrane
34 Uptake of Contaminants Influenced by Other Factors If Contaminant is weak acid or base Less of issue for hydrocarbons 34
35 Toxicokinetic Processes Toxicodynamic Processes Uptake Distribution Metabolism Molecular Interaction at Site(s) of Action 35
36 Distribution in Organism After Uptake Vertebrates via blood and lymph Invertebrates via hemolymph If K ow high in blood, contaminant will associate with lipoproteins and blood cell membranes If K ow low contaminant will dissolve in blood s water component Uptake in gut blood to liver first Uptake in lungs or skin blood to nearest ssues first Blood brain barrier easiest for lipophilic contaminants to pass into brain 36
37 Storage Fat deposits often site of storage Other storage sites = cell membranes Extent of fat deposits changes with availability of food, life stage, etc. Storage typically minimizes effects, but after released (fat used for energy) contaminant is released Delayed toxicity effects when fat used 37
38 Toxicokinetic Processes Toxicodynamic Processes Uptake Distribution Metabolism Molecular Interaction at Site(s) of Action 38
39 Metabolism BCF Bioconcentration concentration in organism relative to concentration in ambient environment (usually water) Bioconcentration Factor = BCF = Conc. in organism Conc. in environment 39
40 Metabolism BAF Bioaccumulation concentration in organism relative to concentration in food or ingested material (water included) Bioaccumulation Factor = BAF = Conc. in organism Conc. in food Bioaccumulation also called biomagnification 40
41 Bioaccumulation Up the Food Chain Contaminant stored in organism A, B, C, etc. Organisms eaten by predator Predator becomes contaminated If eats many organisms (A, B, C ) then biomagnification 41
42 Bioavailability To have bioconcentration or bioaccumulation, contaminant must be bioavailable Bioavailability function of whether contaminant can reach site of uptake or site of action Bioavailability is controlled by form contaminant is in environment Contaminant bound to sediment See earlier Tuzzy Talks 42
43 Metabolism Lots of these processed are done in the liver Liver has lots of non specific enzymes to biotransform organic molecules Phase 1 Phase 2 Add group makes organic polar (e.g., OH, H) Transformed contaminant combines with normal substance in organism Phase 1 & 2 make contaminant more water soluble so it can be excreted 43
44 Metabolism (Con d) Phases 1 and 2 can make contaminant into Less toxic form (detoxify) More toxic form (activate) 44
45 Examples of Phase 1 Metabolism Walker et al., 2012
46 Toxicokinetic Processes Toxicodynamic Processes Uptake Distribution Metabolism Molecular Interaction at Site(s) of Action 46
47 Mechanism of Toxic Action Contaminant itself or Activated Contaminant (Activated Metabolite) General Categories of Action Disrupts or destroy cell structure Direct combination with a cell constituent Impact/influence enzymes Initiate a secondary reaction 47
48 Toxicology of Hydrocarbons Most commonly structured are PAHs Polycyclic aromatic hydrocarbons Multiple aromatic rings 2 7 Low molecular weight PAHs More toxic Higher weight PAHs More carcinogenic (cancer causing) Remain after weathering of crude oil 48
49 Important Effects of Contaminants Genotoxicity Damage the DNA Example: Polycyclic aromatic hydrocarbons (PAHs) Multiple aromatic rings (2 7) Higher molecular weight PAHs damage DNA Carcinogenic cause cancer Original PAH is relatively stable Enzymatic reaction produces metabolites that bind to DNA 49
50 Typical Pathway of Detoxification or Activation (Genotoxicity) PAHs from Crude Oil Can Follow this Genotoxicity Pathway
51 Effects on Organs Cardiovascular or respiratory effects Heart rate Gas exchange rates 51
52 Effect on Whole Organism Nervous systems impacts Behavioral impacts Reaction to stimuli, swimming speed/stamina Predation vulnerability Impaired foraging Reproductive effects Reduced growth/efficiency 52
53 Interactive Effects of Contaminants Toxicity of individual compounds Toxicity of mixture of compounds Antagonism (mixing decreases toxicity) Additive (have similar effect) Potentiation (mixture exceeds effect of each) 53
54 Walker et al., 2012 Toxic Effects of Mixtures
55 Reasons for Increased Toxicity of Mixture One contaminant inhibits enzyme system that detoxifies another contaminant Once contaminant induces enzyme system that activates another contaminant 55
56 Walker et al., 2012 Additive and Potentiation Toxicity
57 Examples of Toxicity Mechanisms of PAHs to Fish Alterations of Phase I Enzymes Mixed function oxygenase enzymes (MFO) PAHs cause induction of MFOs So MFOs can be a sign of PAH exposure (biomarker) [All Information Based on Payne, Mathieu, Collier (2003) 57
58 Problems associated with Induction of MFOs MFOs produce free radicals and cause change in DNA (genotoxicity) Mutagenic/carcinogenic effects MFOs can affect reproduction and some organs and cell functions MFO induction means energy wasted on production of these enzymes 58
59 Examples of Toxicity Mechanisms of PAHs to Fish Disease causing change in tissues Skin ulcers, fin rot, etc. Liver disease Intestinal disease ] 59
60 Examples of Toxicity Mechanisms of PAHs to Fish Immunological Effects Antibody production Reduced phagocytosis of bacteria by white blood cells Few studies on this 60
61 Examples of Toxicity Mechanisms of Genetic Effects PAHs to Fish Carcinogenic issues Genetic diseases in future generations Classic studies of the effect for herring larvae for Exxon Valdez spill 61
62 Examples of Toxicity Mechanisms of Reproductive Effects PAHs to Fish Low fertility High embryo mortality Hard to study because long term chromic effects difficult to monitor 62
63 Examples of Toxicity Mechanisms of Development Effects PAHs to Fish Blue sac disease in larval fish Pacific herring embryos + PAHs affect developing heart Effect on heart rate and rhythm 63
64 Normal Heart Function Incardona, Collier, Scholtz (2004) 64
65 Embryo Treated with 28μm Phenanthrene Incardona, Collier, Scholtz (2004) 65
66 Embryo Treated with 56μm Phenanthrene Incardona, Collier, Scholtz (2004) 66
67 Normal Trunk Blood Flow in Embryo at 5 Days Post Fertilization Incardona, Collier, Scholtz (2004) 67
68 Normal Trunk Blood Flow in Embryo Treated with 5 μm Phenanthrene at 5 Days Post Fertilization Incardona, Collier, Scholtz (2004) 68
69 Examples of Toxicity Mechanisms of Behavorial Effects PAHs to Fish Feeding of some species in sediments with PAHs may stop Altered swimming behavior Less known about these effects 69
70 Examples of Toxicity Mechanisms of PAHs to Fish Narcosis (caused by narcotics including hydrocarbons) Theories of Impacts to cell membrane Contaminant alters physical and/or chemical properties of lipid bilayer Less fluid, inhibits passage of substances in and out of cell Contaminant interacts directly with protein associated with membrane Contaminant alters interaction of lipid bilayer and the protein inserted into it Decrease func on hence narcosis 70 Disruptive Proton Gradient Across Membrane
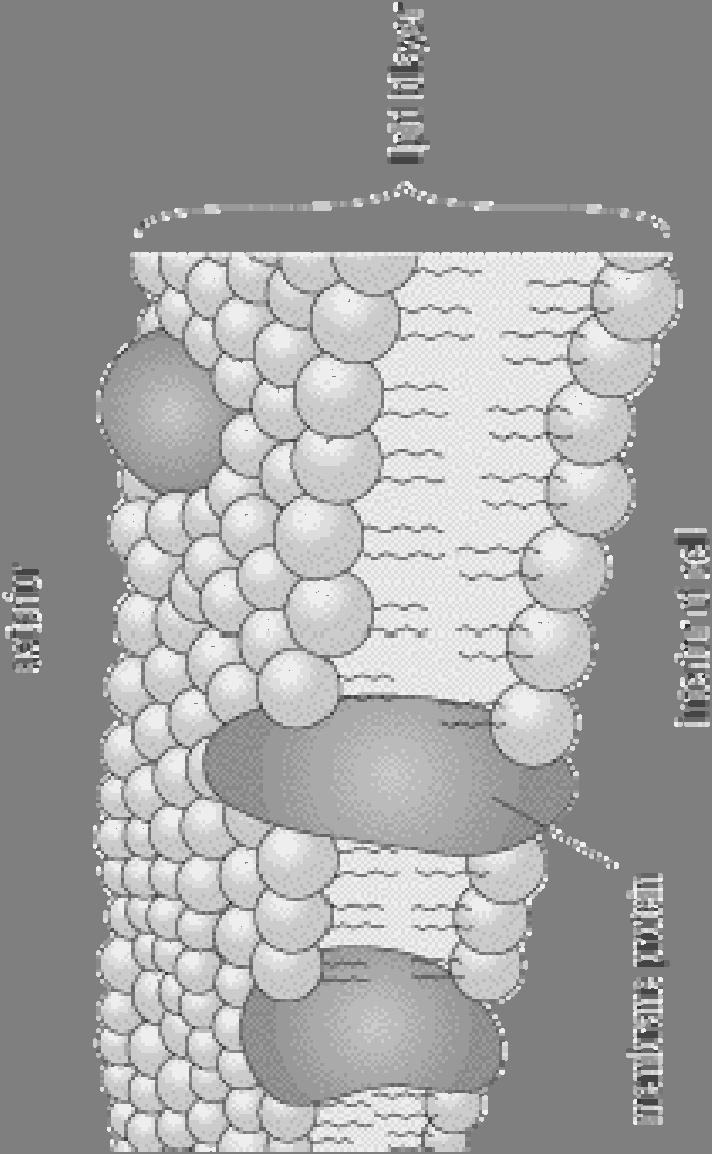
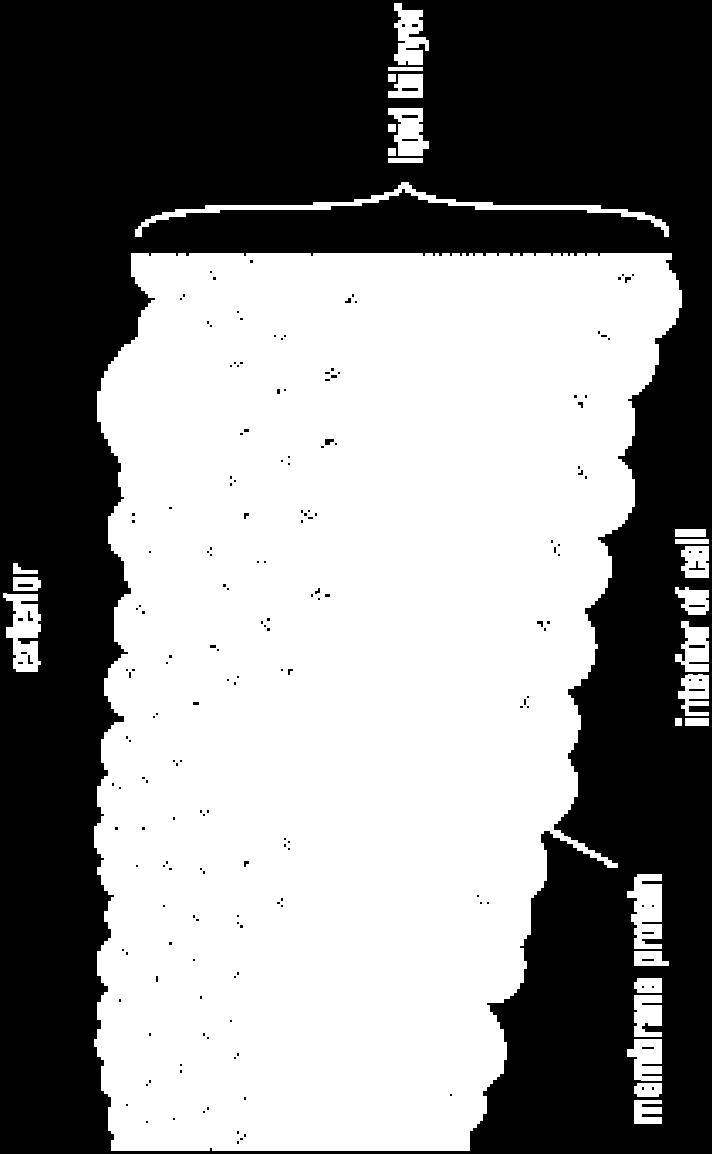
71 file:///c:/users/nek/desktop/fluidmosaic.gif Cell Membrane
72 Examples of Toxicity Mechanisms of PAHs to Fish Narcosis (caused by narcotics including hydrocarbons) Theories of Impacts to cell membrane Contaminant alters physical and/or chemical properties of lipid bilayer Less fluid, inhibits passage of substances in and out of cell Contaminant interacts directly with protein associated with membrane Contaminant alters interaction of lipid bilayer and the protein inserted into it Decrease func on hence narcosis 72 Disruptive Proton Gradient Across Membrane
73 Expressions of Toxicity 73
74 Mortality (lethality) = Death Acute mortality (lethality) Death after brief (often intense) exposure Chronic mortality (lethality) Death after prolonged exposure At least 10% of organism s life expectancy Life Cycle Testing (e.g. T. Chandler s work) Follow all stages of organism s life Critical life stage (most sensitive to toxicity) 74
75 Measures of Toxicity Toxicity is measured as clinical endpoints which include Mortality (death) =lethal Teratogenicity (ability to cause birth defects) Carcinogenicity (ability to cause cancer), and, Mutagenicity (ability to cause inherited change in the DNA) Two common measures of mortality (lethality) the LD 50 and the LC 50
76 Measures of Toxicity: Median Lethal Dose Reported at Some Time of Exposure LD 50 The amount (dose) of contaminant which produces death in 50% of population of test animals to which it is administered by any of a variety of methods mg/kg Normally expressed as milligrams of contaminant per kilogram of animal body weight (More on Units in Tuzzy Talk #7)
77 Measures of Toxicity: Median Lethal Concentration Reported at Some Time of Exposure LC 50 The concentration of contaminant in environment which produces death in 50% of an exposed population of test animals in a specified time frame mg/l Normally expressed as milligrams of contaminant per liter of air or water (More on Units in Tuzzy Talk #7)
78 Effective Concentration or Dose EC or ED Reported at Some Time of Exposure If adverse response is not death, then EC or ED EC 50 at 96hr = Concentration where 50% of the organisms show the effect 78
79 Other Values No Observed Effect Concentration (NOEC) No Observed Effect Dose (NOED) Lowest Observed Effect Concentration (LOEC) Lowest Observed Effect Dose (LOED) 79
80 Confusion with These Measures of Toxicity Lower value means more toxic Less needed to cause a toxic effect more toxic the substance is LD 50 of 25 mg/kg is more toxic than is one of 7,000 mg/kg