Impact of Geology on Your Watershed
|
|
|
- Baldwin Dixon
- 5 years ago
- Views:
Transcription
1 2011 Volunteer Stream Monitoring Symposium March 25, 2011 Impact of Geology on Your Watershed Bill Hafs Brown County Land and Water Conservation Department
2 Presentation Overview Distribution ib ti and density of livestock operations in Brown County/NE Wisconsin Land use trends Land application of Wastes Surface water Nutrient management an P Index Groundwater Other Wastes land applied Needs Opportunities 2


3
4 LIVESTOCK NUMBERS All Cattle and Calves (Fox Wolf Basin) Cattle Cropland Acres/Cow Brown 105, , Outagamie 85, , Winnebago 32, , Calumet 60, , Fond du Lac 100, , Waupaca 55, , Shawano 85, , Counties with highest cattle numbers Grant 173, , Dane 143, , Marathon 139, , Clark 136, , Dodge 106, , Manitowoc 97, , * 2009 Wisconsin Agricultural Statistics 4
5 Brown County CAFO Numbers 18existing CAFO permits (>1000AU) 13 potential (>500 AU) CAFO permits (1400 lb) dairy cows generates waste = 18,000humans (source DNR) the 80,000 animal units = 1,440,000 humans (waste equivalents). City of Green Bay + De Pere Metro area = 200,000 humans (GBMSD). 100 Staff work at Green Bay Metropolitan Sewage District. 5
6 1000 Animal Unit Operations (statewide 2007 DNR) 6
7 MILK PRODUCTION TRENDS 2009 US Dairy Statistics Milk Production (Source: Progressive Dairyman) State Ranking in Total Milk production Wisconsin is #2 nationwide. Wisconsin average herd size = 95 Number dairy herds 13,170 (13,730 in 2008) TOP DAIRY COUNTIES IN MIDWEST REGION (12 states)milk ) 1. Stearns Mn (106 million lbs) +67% 2. Clark (103 million lbs) +35% 3. Marathon (94millionlbs) lbs) +25% 4. Dane (94 million lbs) +15% 5. Fond du Lac (81 million lbs) +39% 6. Brown (80 million lbs) +16% (14% in 2008) 7. Outagamie (75 million lbs) +40% 7
8 Brown County Dairy Production Overview Production/Cow 9,959 13,200 22,300 Lbs./head/year Number of Cows 40,919 39,200 41,000 Number of Herds 1, Average Herd Size ~30 ~172 All Cattle numbers 91, ,000 Higher milk production = higher manure production Reduced herds = concentration of livestock Increased Cattle numbers (allcattle) 8
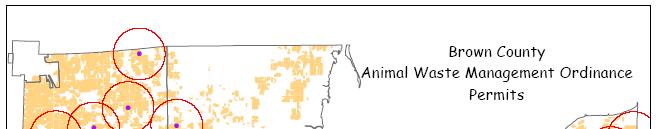

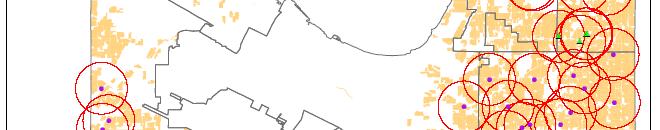
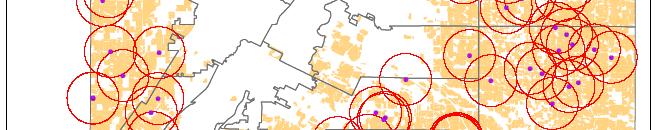
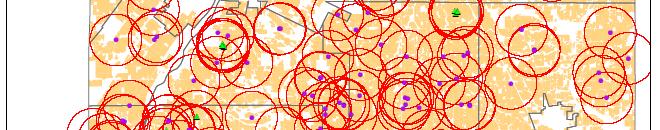
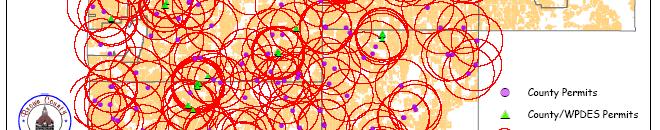
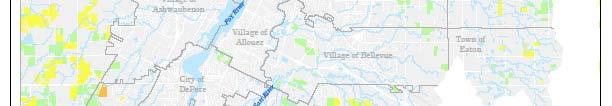
9 Distribution of Livestock 9
10 Land Use Trends Brown County total land area approximately 350, acres. Year Farms Land in Farms , ,900 acres , ,800 acres , ,400 acres , ,500 acres ,053* 162,000 acres 2010? Source: 1991 Brown County Farmland Preservation Plan; NASS 2007*,
11 Brown County Crop Production Overview Crop Potatoes Barley Corn Hay Peas Oats Snap Beans Soybeans Sweet Corn Wheat Total acres ,800 87,000 1,600 47, , , ,000 62,000 74,000 61,000 2,500 31,500 1, ,400 1,600 2,050 15, , ,000 Higher percentage of Corn, Soybeans, Wheat Lower percentage of Hay Oats eliminated Cropping trends = Less Ground Cover over winter 11
12 Acres needed for land spreading of animal waste How many acres are needed per AU for land spreading of animal waste for Phosphorus? Clemson University, University of Wisconsin 2 to 3 acres per AU. 80,000 AU in Brown County x 2 acres/ AU = 160,000 acres cropland needed. Distribution ib ti of Livestock operations. Density standards need to be developed or other waste treatment technologies promoted and funded. 12
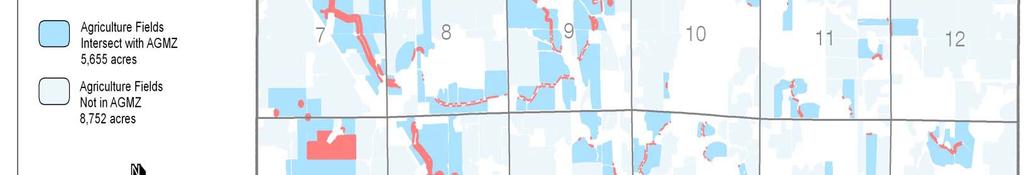
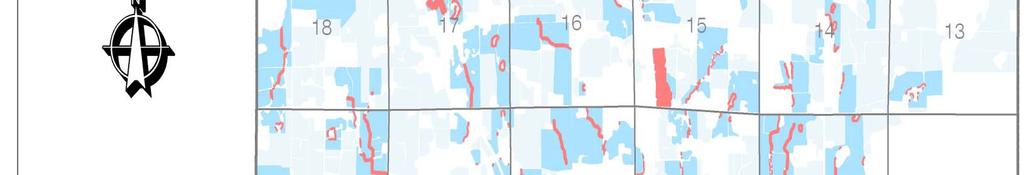
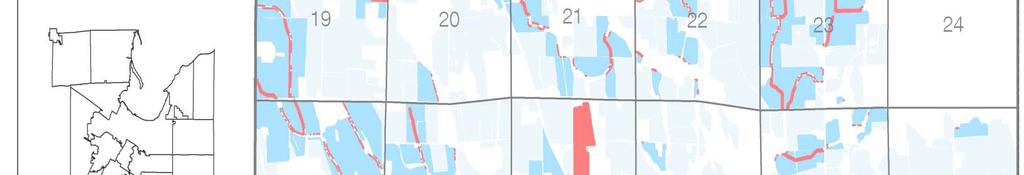
13 Land Application of Wastes Approximately 162,000 acres of cropland in Brown County. 1/3 of Cropland is estimated to have spreading restrictions such as: Set backs to streams Set backs from wells Set backs from wetlands Setbacks from KARST, Bedrock, Bd sinkholes 106,920 acres of cropland (66%) is more accurate estimate of spread able cropland. 13
14 Other Waste DNR approved land spreading sites Brown County 2/14/07: Industrial= 566 sites, 23,214 acres, 18 facilities. Municipal = 243 sites, 4854 acres, 9 facilities. Septage= 31 sites 1300 acres, 8 facilities. Total = 29,368.9 acres / 162,000 acres total cropland acres in Brown County = 18% of cropland approved for landspreadingof other wastes. 14
15 How much Waste is being land applied? Animal waste per year from di dairy and beef livestock = 551,921,154 gal per year. Industrial Municipal Septic waste land applied in 2008 = 41,759,400, gallons/ year. (DNR Form ) Is EQUAL distribution of 593 million gallons of waste per year on 106,920 acres of cropland possible? 15
16 Surface Water The Fox River is the largest contributor of phosphorus to Lake Michigan of all tributary streams (21%). The Fox River is the 3 rd largest contributor of Sediment to Lake Michigan of all tributary streams. (U.S.G.S. Water Resources) 16
17 Surface Water Suspended Sediments Total Suspended Solids Export Lower Fox River Basin and Duck Creek 2004 Baseline, Total 57,518 ton Agriculture 63% Urban 19% Construction Sites 10% Other Point Sources nonpoint 5% 3% 17
18 Surface Water Phosphorus Total Phosphorus Export Lower Fox River Basin and Duck Creek 2004 Baseline, Total 238,912 kg Industrial Point 21% Municipal i Point 17% Agricultural Land 44% Other nonpoint 3% Construction Sites 3% Ub Urban 9% Barnyard 3% (Data Sources: Integrated Watershed Approach Demonstration Project: A Pollutant Reduction Optimization Analysis for the Lower Fox River Basin and the Green Bay Area of Concern. August 2007; prepared by the Cadmus Group for the U.S. EPA, with contributions from the University of Wisconsin Green Bay, 26 pp. Solids data from P. Baumgart, UW Green Bay, 2008.) 18

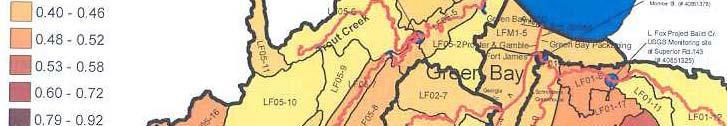
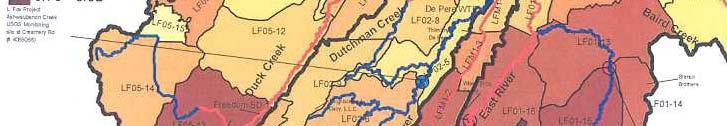


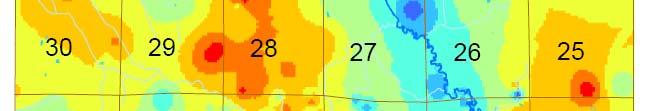
19 Suspended Sediment 19
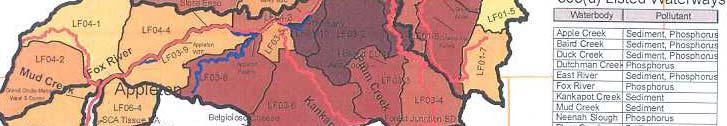
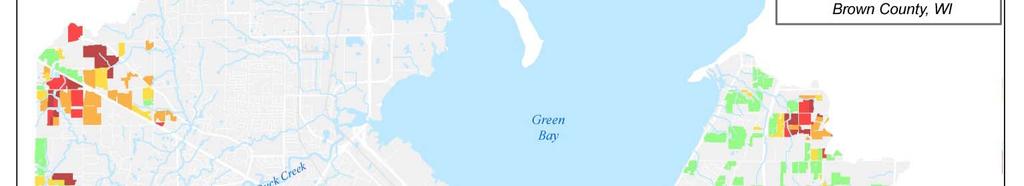
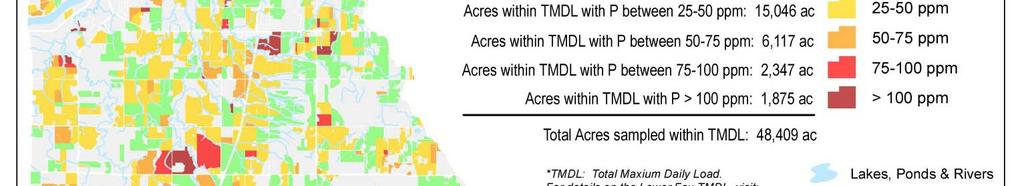
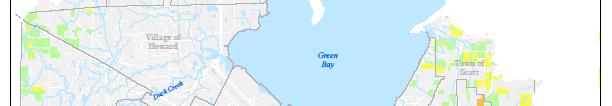
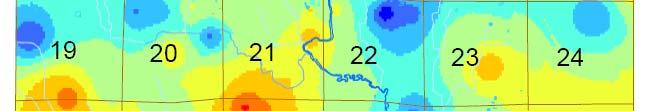
20 Phosphorus 20
21 Do Nutrient Management Plans and P Index less than 6 protect Water quality? 2010 nutrient management plans = 115,000/162,000 acres of cropland covered (71%) Are nutrient management plans accurate or really being implemented? Pi Private agronomists it NE WI say about 50% are currently implemented within reason. Is correct information being entered into P Index? 21
22 PI 6 agronomic based Not Water Quality Based The DNR will not seek to base nutrient management planning on the potential delivery of nutrients to surface water. Rather, nutrients will be managed in accordance with the needs of a crop. (June 23, 2010 Wisconsin DNR Board approves changes to NR 151 ) Rotation Soil test Rotation Soil test PI P ppm PI P ppm


23 23


24
25 PPM P vs. P Index Phosphorus ppm Farm Field Acres Percent of Total 0 25 ppm 23, % 25 50ppm 15, % ppm 6, % ppm 2, % > 100 ppm 1, % Total 48, % P Index Farm Field Acres Percent of Total , % 10% , % 4 6 1, % > % Total 36, % Source: 2010 Brown County Land and Water Conservation Phosphorus mapping project funded by DNR. 25
26 State Water Quality Standard =.075 mg/l Sub Basin Apple Creek Ashwaubenon Creek Baird Creek Duck Creek East River 3 year record of Total Phosphorus concentrations Lower Fox River Watershed Monitoring Program mg/l mg/l mg/l mg/l mg/l Source: Lower Fox River Watershed Monitoring Program (page 10 Total Maximum Daily Load and Watershed Management Plan for Total Phosphorus and Total Suspended Solids in the Lower Fox River Basin and Lower Green Bay). 26
27 Nutrient Trading? Source Total Phosphorus (lbs./yr.) Percent Natural Background 5,609 10% 1.0% Agriculture 251, % Urban (non regulated) 15, % Urban (regulated MS4) 65, % Construction 7, % General Permits 2, % Industrial WWTFs 114, % Municipal WWTFs 87, % Total (In Basin) 549,703 Source: Lower Fox River Watershed Monitoring Program (page 10 Total Maximum Daily Load and Watershed Management Plan for Total Phosphorus and Total Suspended Solids in the Lower Fox River Basin and Lower Green Bay). Green Bay Metropolitan Sewage District will be required to spend over $200,000,000 to reduce Phosphorus discharge by 25,000 lbs. per year. Statet of Wisconsini will provide $146,000 for staffing and $88,000 for cost share to landowners in Brown county in
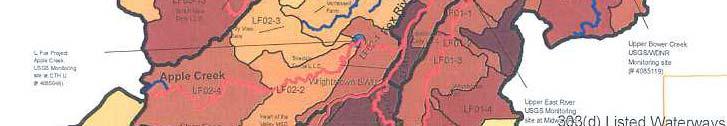
28 Sources of total phosphorus loads identified by the stream from within each sub basin. Sub Basin Total Phosphorus (lbs/yr) East River 48,478 Baird Creek 12,748 Bower Creek 27,777 Apple Creek 35,088 Ashwaubenon Creek 15,681 Dutchman Creek 15,280 Plum Creek 31,569 Kankapot Creek 20,050 Garners Creek 6,575 Mud Creek 6,594 Duck Creek 63,172 Trout Creek 4,518 Neenah Slough 11,912 Lower Fox River (main) 237,339 Lower Green Bay 12,652 Total (In Basin) 549,703 (Source of tables: Total Maximum Daily Load and Watershed Management Plan for Total Phosphorus and Total Suspended Solids in the Lower Fox River Basin and Lower Green Bay (June 2010)) 28
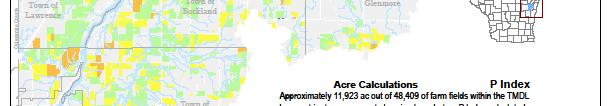
29 Conclusions of TMDL Phosphorus Mapping Project Soil P ppm better indicator of phosphorus delivery from agriculture fields than P Index. 99.9% of current 590 plans meet P Index yet TMDL identifies Agriculture sources of phosphorus at 46 % and water quality monitoring identifies stream phosphorus levels at greater than.075 ppm. 92 of 132 (70%) of the agriculture fields mapped with over 75 ppm of phosphorus had a stream which intersected the agriculture field as a delivery point for phosphorus. Many of the high soil phosphorus ppm fields are located in close proximity to livestock facilities where historical farm building sites were located. The GIS mapping of phosphorus ppm on a field basis could be used to monitor phosphorus levels by field and be used to focus conservation resources to highest Phosphorus ppm fields 29
30 Groundwater 2004 Polluted water forces family to leave home Posted Mar. 03, 2004 KEWAUNEE Five members of a rural Luxemburg family were driven from their home Tuesday by polluted well water they said was caused by manure runoff from a factory farm. Kewaunee County backs revisions to Manure Ordinance May27 27, 2004 Fecal material contaminates 6 town wells Posted Apr. 13, 2005 Lark residents point to area farm; DNR investigating MORRISON Bob Bonness knew he had a problem when the well water from the tap in his home started running brown Editorial: County must deal with manurespreading issue Posted May 10,
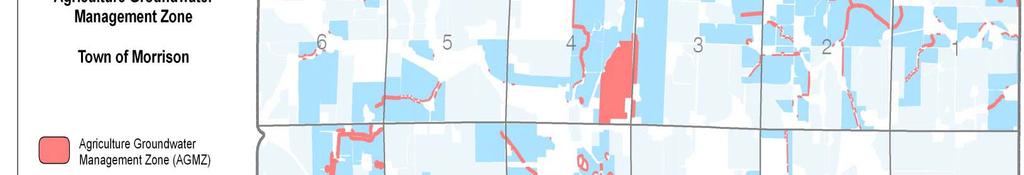
31 February 14, 2006 DNR ISSUES BOIL WATER NOTICE FOR WAYSIDE AREA Green Bay In response to private well sampling being conducted in the Wayside area of the Town of Morrison in Brown County, the DNR has issued a Boil Water advisory for private wells in this area. Several area residents began sampling their wells after a manure smell was noted in their water. Sample results from the Brown County Health Department, the Department of Natural Resources, and a local licensed pump installer showed greater than 50% of the wells contained coliform bacteria, and are judged to be bacteriologically unsafe. 31
32 Information available in 2005? 32


33 33
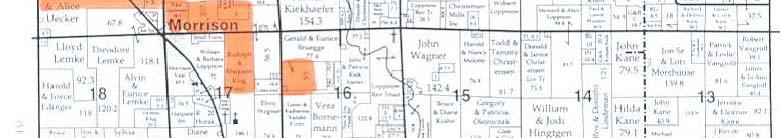
34 Town of Morrison February Fractured bedrock, Karst Features, unsafe wells. 34


35 35
36 Well testing UWSP 2006,
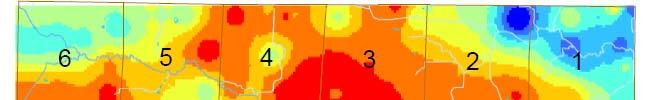
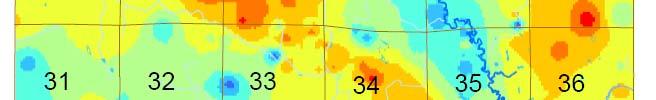
37 34% wells tested in 2006 >10ppm N 37


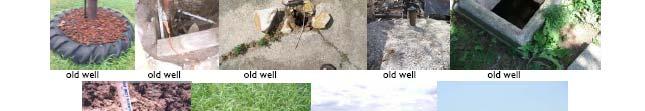
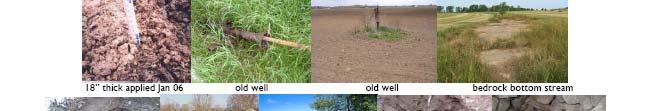

38 Meetings with town residents Old wells, sink holes, unsafe land application 38


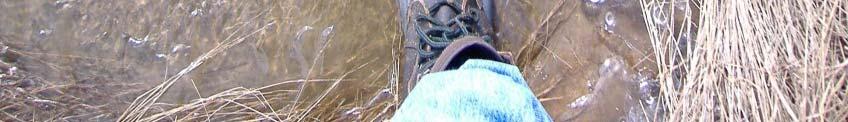

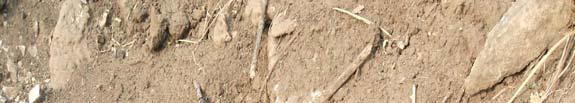
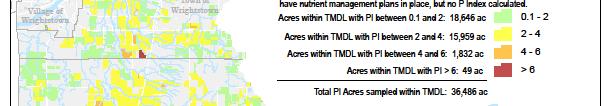
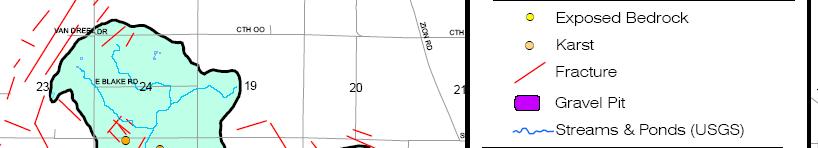
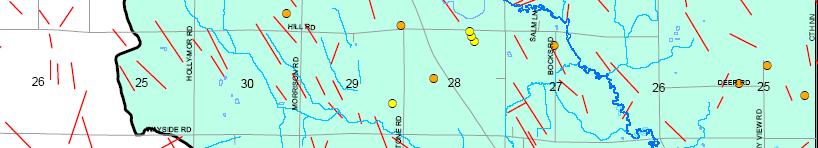
39 Morrison Karst features field verified 39

40 Field Verification Better mapping, data 40
41 Northeast Wisconsin 41
42 Summary of Morrison Wll Well contamination ti reports peaked kdin January May 2006 and wells tested Morrison Feb May Over 100 wells contaminated from bacteria or Nitrates. 34% >10ppm N. 23 Wells replaced in State zone of eligibility near Wayside $245,098 (state), $74,756 cost to landowner. 51 wells were properly p abandoned in Over 200 Karst features identified by UWGB. Northeast Wisconsin Karst Task Force assembled and completed its report and recommendations February Legislative changes have yet to be enacted to protect groundwater in Karst areas from land application of wastes. 42
43 Conclusion from 2006 Brown County Investigation of Morrison Well Contamination problem Several Factors led to contamination of over 100 wells in Morrison in A combination of wastes (animal, industrial, municipal) were land applied in winter of 2006 on frozen ground that has shallow soil or Karst features with a direct conduit to groundwater. Significant rainfall events in January and February Fb contributed tib t dto the runoff. Current nutrient management plan (590) requirements, and other land application requirements were not sufficiently designed or monitored to prevent the pollution of wells in the Karst topography of Morrison Township. 43
44 44


45 DNR approved industrial waste spreading sites 45

46 Compare to DNR approved industrial waste spreading sites 46
47 HOW MUCH Other Waste is Land Applied? DNR approved land spreading sites Brown County 2/14/07: Industrial= 566 sites, 23,214 acres, 18 facilities Municipal = 243 sites, 4854 acres, 9 facilities Septage= 31 sites 1300 acres, 8 facilities Total = 29,368.9 acres / 162,000 acres total cropland acres in Brown County = 18% of cropland approved for land spreading of other wastes. 47
48 Companies that land applied waste in Brown County in 2006 (Information provided by DNR) 1 ALLEN CANNING PULASKI PLANT 2 ARLA FOODS PRODUCTION LLC 3 ARROW SANITATION 4 ASHLEY SEPTIC SERVICE 5 BARTZ SEPTIC SERVICE 6 BELGIOIOSO CHEESE INC CHASE 7 BELGIOIOSO CHEESE INC DENMARK 8 BELGIOIOSO CHEESE INC DENMARK 9 BELGIOIOSO CHEESE INC LANGES CORNER 10 BELGIOIOSO CHEESE INC PULASKI 11 DENMARK WASTEWATER TREATMENTFACILITY 12 FOREMOST FARMS USA DEPERE 13 FOX VALLEY SEPTIC SERVICE INC 14 GREEN BAY DRESSED BEEF LLC 15 HOLLAND SD 1 WASTEWATER TREATMENT 16 LAKESIDE FOODS INCORPORATED SEYMOUR 17 MANITOWOC WASTEWATER TREATMENT 18 MORRISON SANITARY DISTRICT NO 1 19 PACKERLAND PACKING COMPANY INC 20 RENIER SANITATION SERVICE 21 SANIMAX AGS INC. 22 TIMMAR SANITATION 23 TREGA FOODS INC LUXEMBURG PLANT 24 TWO RIVERS WASTEWATER TREATMENT 25 WILLIAM WALDVOGEL TRUCKING 26 WRIGHTSTOWN SANITARY DISTRICT 2 48
49 Needs Carbonate Bedrock Management Zone Legislation to protect Karst Area groundwater. Mapping of Karst features on field basis to help identify land application restricted areas. Unification of administrative codes regarding land application of wastes. Nutrient Management Plans needs to include all wastes. Animal waste storage facilities intended for Animal waste, other wastes need their own storage or waste treatment facilities. Sustainability limits on livestock concentrations. 49
50 Education needed Survey of Dairy Farmers in Lower Fox by UW ( February 2007) 168 (58%) responded (CAFO s not in survey) 86% agreed it is their responsibility to protect WQ. Only 14% would be willing to pay more to improve WQ. Twice as many (36%) identified Waterfowl droppings as more serious than Agriculture (18%). Respondents see water pollution as generated tdprincipally i by non Ag sources. Two most influential factors are profitability (88%) and out of pocket expense (87%). 75% will maintain or expand herd size in next 5 years. 50
51 Opportunities Nutrient Management state required, 2010 Brown County 115,000/ 162,000 acres Need better plan implementation, revised PI targets lower than 6 for surface water protection. Winter spreading plans 100 per year GIS Monitoring of PPM Phosphorusby field to monitor progress and direct resources. Promotion of new technologies Funding by state of waste water treatment, digesters, dewatering, Waste Transformation Technology to overcome cropland shortage and increase sustainability. Consistent tcompliance of enforcement Rural vs. Urban Compliance. Adequate staff Enforce, inspect, monitor. Green Bay Metro Sewage has 100 employees to monitor estimated 200,000 human residents. 80,000 animal units = 1,440,000 humans and there County, DNR, Private staff monitoring animal waste. Regulation protects farming fromliability Ag is 3 billion dollar/ year industry in Brown Co. Nutrient Trading? $200 million for 25,000 lbs. P/year from GBMSD. Current Cost share from State less than $150,000 per year for Ag. 51


52 52


53 Questions? 53