Irvine CA MAE ROW ROW ROW. Office Lighting Plan. Page 93
|
|
|
- Franklin Green
- 5 years ago
- Views:
Transcription
1 MAE DEPTH DAYLIGH TING STUDY To complete the MAE additional depth requirement for thesis, a daylighting analysis for the third floor open office space has been performed. Three northern windows provide diffuse natural light into the space throughout the year. The purpose of the following study is to propose an effective photosensor dimming system for the open office with the goal of providing long-term economic benefits. Once an appropriate system has been determined, the annual energy saved can then be estimated based on the lighting power use in the space. ROW 3 ROW 2 ROW 1 Office Lighting Plan MAE Depth Daylighting Study Page 93
 was determined to be the winter solstice, December")


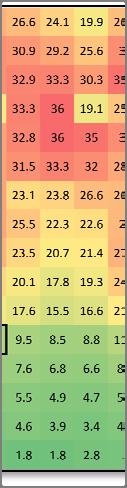
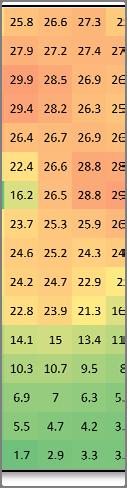
2 Critical Point Analysis AGI32 lighting software was used to study several daylight scenarios for the building. The worst-case scenario (the time of year when the least natural daylight is available on the workplane) was determined to be the winter solstice, December 21. Due to the north-facing orientation of the windows, low-angle winter sun rays are unable to enter the space directly. A rough solar study of the northernn wall is also performed within the photovoltaic electrical depth analysis for this report. Using December 21 as a date inputting the longitude and latitude of Irvine, California to simulate the project s location, a calculation with sunny and overcast sky conditions was performed and recorded. In addition to natural light, the artificial lighting system within the office has been divided into three distinctly controllable zones one near the windows, one toward the opposite wall, and one in between with row one being nearest the windows. Through the coordinated dimming of the ceiling recessed fixtures in the space, a fairly uniform light condition should be attainable in the office without the distraction of the luminaires being switched on and off as the light varies throughout the day. Each combination of active rows has been calculated with no added natural light. The AGI calculation output was then imported into Microsoft Excel for comparison. Based on this data, an appropriate photosensor location has been chosen for the space and is shown here outlined in black. Clear Sky MAE Depth Daylighting Study Page 94


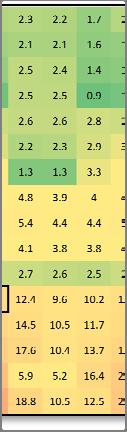
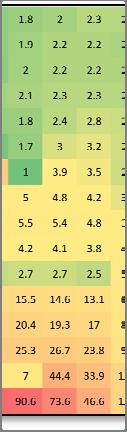
3 Overcast Row One Active MAE Depth Daylighting Study Page 95


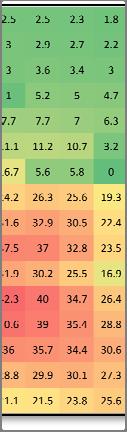
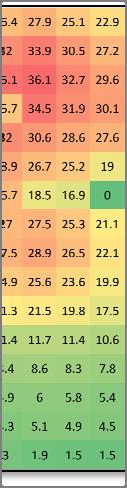
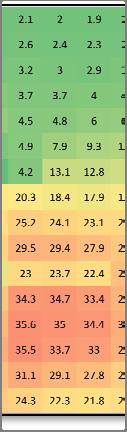
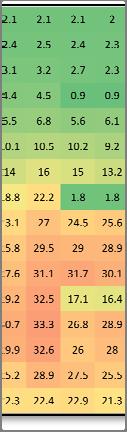
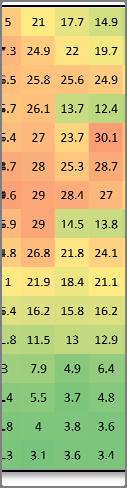
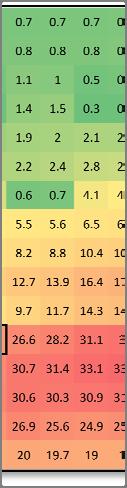
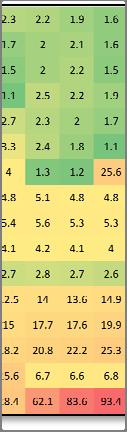
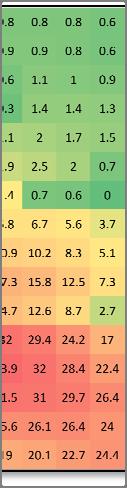
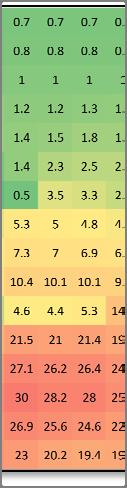
4 Rows One and Two Active Rows Two and Threee Active MAE Depth Daylighting Study Page 96


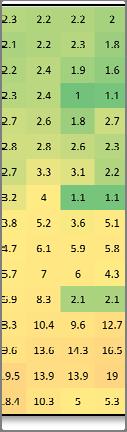
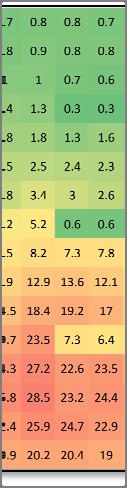
5 Row Three Active Dim Level = (Target Level Clear Condition) / Row One Active *NOTE: These plots also show striations formed by the cubicle walls within the room, and care was taken not to select a photosensor location which could be shaded at some point during the day. MAE Depth Daylighting Study Page 97


6 Daysim Analysis After the critical point has been determined, Daysim simulation software can be used to quantify any savings whichh might be achieved by the implementatio on of a dimming photosensor system. The room and surrounding geometry weree modeled in AutoCAD and then imported into the program. Daysim is then able to simulate long-term use of the system and provide estimates of the total energy used by the lighting system annually. The original target value for illuminance on the work plane was 30fc without the use of personal task lighting. The analysis was run without blinds or shades because the windows are well protected from direct solar glare by their orientation and position within the building. An additional analysis was completed using a target illuminance value of over 1 million, thereby preventing the system from ever dimming and providing a data set for a comparable non-dimming lighting solution. Daysim Inputs MAE Depth Daylighting Study Page 98
7 UCI Natural Sciences Unit II Results Daysim Simulation Report (Non-Dimming System) In short... Daylight Factor (DF) Analysis: 100% of all illuminance sensors have a daylight factor of 2% or higher. If the sensors are evenly distributed across 'all spaces occupied for critical visual tasks', the investigated lighting zone should qualify for the LEED-NC 2.1 daylighting credit 8.1 (see Daylight Autonomy (DA) Analysis: The daylight autonomy for the core workplane sensor is 0%. Useful Daylight Index (UDI) Analysis: The Useful Daylight Indices for the Lighting Zone are UDI<100=1%, UDI =38%, UDI>2000=61%. Continuous Daylight Autonomy (DAcon)and DAmax Analysis: 0% of all illuminance sensors have a DAcon above 40%. 0% of all illuminance sensors have a DAmax above 5%. Electric Lighting Use: The predicted annual electric lighting energy use in the investigated lighting zone is: 3.6 kwh/unit area. Assuming a lighting zone size of 800 [unit area], this corresponds to a total annual lighting energy use of kwh. Daysim Simulation Report (Photosensor Dimming System) In short... Daylight Factor (DF) Analysis: 100% of all illuminance sensors have a daylight factor of 2% or higher. If the sensors are evenly distributed across 'all spaces occupied for critical visual tasks', the investigated lighting zone should qualify for the LEED-NC 2.1 daylighting credit 8.1 (see Daylight Autonomy (DA) Analysis: The daylight autonomy for the core workplane sensor is 98%. Useful Daylight Index (UDI) Analysis: The Useful Daylight Indices for the Lighting Zone are UDI<100=1%, UDI =38%, UDI>2000=61%. Continuous Daylight Autonomy (DAcon)and DAmax Analysis: 100% of all illuminance sensors have a DAcon above 80%. 100% of all illuminance sensors have a DAmax above 5%. Electric Lighting Use: The predicted annual electric lighting energy use in the investigated lighting zone is: 0.6 kwh/unit area. Assuming a lighting zone size of 800 [unit area], this corresponds to a total annual lighting energy use of kwh. Conclusion The simulation results indicated a possible lighting power savings of approximately kwh. At an approximate utility cost of $ per kwh (see the derivation of this value in the photovoltaic electrical depth study), the installation of a photosensor dimming system in the office space has the potential to save just $220 per year. This is likely not enough savings to warrant the installation of photosensor system in this space financially. The low savings is likely due to the relatively small size of the windows in comparison to the space. In addition, since the orientation of the windows is to the north, the amount of available daylight is limited. MAE Depth Daylighting Study Page 99


8 M ECHANICAL BREAD TH CURTAIN WA LL STUDY One of the most prominent architectural features of the building is the four-story glass curtain wall between the lobby and the north plaza space. Although visually important to the architecture, this large expanse of glazing has the potential to be a weak point in the building envelope. The thermal impact of the north curtain wall is the subject of this mechanical breadth study. Solar Study A solar penetration study was performed for the curtain wall to determine the amount of possible solar gain for the lobby. Because the curtain wall faces roughly north, the summer solstice was determined to be the worst-cassky at noon. Several times were analyzed on this day. As illustrated by the figures below, very little direct sunlight is able to enter the space, even on the solstice. This information suggests that the solar heat gain calculated in this study may be somewhat high as compared to the real value if the calculation assumes no additional shading of the curtain wall. scenario for daylight penetration into the space, as the sun travels to its most northern point in the Summer Solstice June 21 7AM Breadth Topics Mechanical Page 1000

9 UCI Natural Sciences Unit II Summer Solstice June 21 9AM Summer Solstice June 21 11AM Breadth Topics Mechanical Page 101
10 UCI Natural Sciences Unit II Summer Solstice June 21 1PM Summer Solstice June 21 3PM Breadth Topics Mechanical Page 102

11 UCI Natural Sciences Unit II Summer Solstice June 21 5PM Breadth Topics Mechanical Page 103
12 Existing Glazing The curtain wall glazing is defined in the project specifications to be 1 thick insulated Heat Mirror 66 Clear with a U- value of 0.29 and a minimum shading coefficient (SC) of Using the online window heat gain calculation tool at approximate heat gain values in BTU/ft²/ /day have been calculated for each month based on climate data for Los Angeles, California. Input Data Assumptions / Calculations Solar Heat Gain Coefficient (SHGC): SHGC = SC x 0.87 = x 0.87 = Ground Surface Reflectance: New Concretee = 0.32 Façade Orientation: North Climate Data * Based on National Climatic Data Center (NCDC) measurements Breadth Topics Mechanical Page 104


 4323182 5331567 7731845")


13 Output and Calculated Heat Gain Month January February March April May June July August September October November December Heat Gain Rate (BTU per ft² per Day) Calculated Heat Gain (BTU per Day) Days ANNUAL TOTAL 365 * Curtain wall glass area used for these calculations: ft² Monthly Heat Gain (BTU) Modified Glazing A new curtain wall glazingg has been selected as a comparison to analyze energy savings over the existing system. PPG SOLARBAN 70XL glass has been chosen for its low solar heat gain coefficient and superior visible light transmission, which is an important architectural design quality. Partial product specifications are included below. Breadth Topics Mechanical Page 105
14 UCI Natural Sciences Unit II Input Data Solar Heat Gain Coefficient (SHGC): SHGC = 0.27 Output and Calculated Heat Gain Month Heat Gain Rate Calculated Heat Gain Monthly Heat Gain Days (BTU per ft² per Day) (BTU per Day) (BTU) January February March April May June July August September October November December ANNUAL TOTAL Conclusions After completing the thermal gain analysis, the modified curtain wall system using PPG SOLARBAN 70XL glass is expected to reduce the annual heat gain from 99,599 kbtu to 72,539 kbtu. This represents an approximate 27% reduction in cooling load for this space. Although the initial installation cost would be higher, consideration of a more thermally resistant glazing system for the north curtain wall is recommended. Breadth Topics Mechanical Page 106
15 ACOUST ICS BREA DTH LOBBY ANALYSIS The main entry lobby of the building is an importantt space within Natural Science Unit II and the surrounding campus. This area is intended to be a place for social and academic interaction between student and faculty at the university. In order to accommodate comfortable conversation in this space, an appropriate acoustic environment is required. For this reason, an analysis of the acoustics in the first floor lobby space has been analyzed in this study. The main purpose of the analysis is to determinee whether the lobby area meets recommended professional standards of acoustical quality. It is unlikely that this type of analysis was performed during the design and construction of the project. In addition, an architectural change to a portion of the ceiling (from acoustic ceiling tile to gypsum) was made during the lightingg redesign of this space. The effects of this change have also been determined in the following analysis. Room Dimensions Partial First Floor Plan Scale: NTS Breadth Topics Acoustics Page 107


 250 Hz 500 Hz 1000 2000 4000 Hz Hz Hz 0.060 0.")


16 Material Properties DESCRIPTION Floor 1 Floor 2 Interior Walls Wooden Panel Wall Concrete Walls ACT Ceiling Ceiling 2 Interior Doors Elevator Doors Exterior Doors Curtain Wall Curtain Wall Framing Interior Windows Corridor Openings MATERIAL Carpet on Concrete Stone Gypsum Wall Board Wood Concrete Acoustic Ceiling Tile Gypsum Wood Steel Steel Glass - Heavy Steel Glass - Ordinary Open 125 Hz ABSORPTION COEEFFICIENT (α) 250 Hz 500 Hz Hz Hz Hz Breadth Topics Acoustics Page 108
17 UCI Natural Sciences Unit II Reverberation Time Existing DESCRIPTION SURFACE AREA S [ft²] 125 Hz S x α 250 Hz 500 Hz 1000 Hz 2000 Hz 4000 Hz Floor Floor Interior Walls Wooden Panel Wall Concrete Walls ACT Ceiling Ceiling Interior Doors Elevator Doors Exterior Doors Curtain Wall Curtain Wall Framing Interior Windows Corridor Openings Space Volume (V) 13,530 ft³ a = Σ (S x α) T60 = 0.05 x V/a a = Room Absorption (Sabins) T60 = Reverberation Time (Seconds) Breadth Topics Acoustics Page 109
18 UCI Natural Sciences Unit II Reverberation Time Designed DESCRIPTION SURFACE AREA S [ft²] 125 Hz S x α 250 Hz 500 Hz 1000 Hz Floor Floor Interior Walls Wooden Panel Wall Concrete Walls ACT Ceiling Ceiling Interior Doors Elevator Doors Exterior Doors Curtain Wall Curtain Wall Framing Interior Windows Corridor Openings Space Volume (V) 13,530 ft³ 2000 Hz 4000 Hz a = Σ (S x α) T60 = 0.05 x V/a Comparison / Analysis 125 Hz 250 Hz 500 Hz 1000 Hz Breadth Topics Acoustics Page Hz 4000 Hz T60 Existing (Seconds) T60 Designed (Seconds) Difference (Seconds) The removal of the acoustic ceiling tile from the center of the lobby creates a notable increase in the reverberation times within the space. This difference has the potential to adversely affect the quality of speech recognition in the lobby. Any increase in reverberation time is undesirable in the space. However, the final values for reverberation time are still marginally acceptable for a large public space such as this. Several unknown variables such as plant life and human occupancy in the space will also likely act to decrease the reverberation time here. If the project budget allows, addition of sound absorbing materials back into the space should be used to improve the acoustic performance. Another option is to change the lighting design back to be integrated into an acoustic tile ceiling in the lobby. For this project, the lighting design and visual experience of the space from indoors and outdoors are of greater importance than a minor improvement in acoustic quality. Ideally, a new sound dampening method would allow the lighting appearance to stay fairly constant while still reducing the reverberation time in the room.