Tsubasa Hashimoto* H. Shigemura, T. Yokota
|
|
|
- Magnus Charles
- 5 years ago
- Views:
Transcription


1 Tsubasa Hashimoto* H. Shigemura, T. Yokota National Institute for Land and Infrastructure Management Ministry of Land, Infrastructure, Transport and Tourism, Japan The 9th International Conference on URBAN DRAINAGE MODELLING

")
")

2 2 Frequency of rainfall exceeded 50 mm/h observed in 1,000 stations per year for recent 35 years Yearly frequency (in 1,000 stations) observed in 168 stations (average) observed in 195 stations (average) observed in 226 stations (average) Reference: Japan Meteorological Agency In recent years, rainfall exceeded 50 mm/h has occurred frequently in Japan.

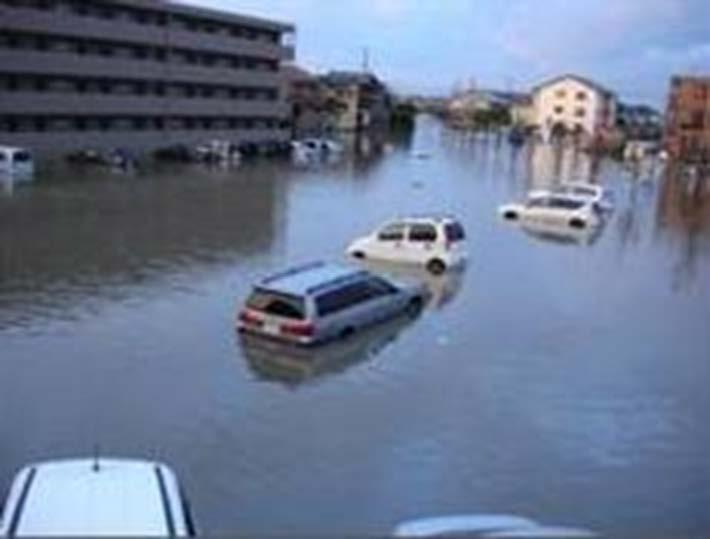
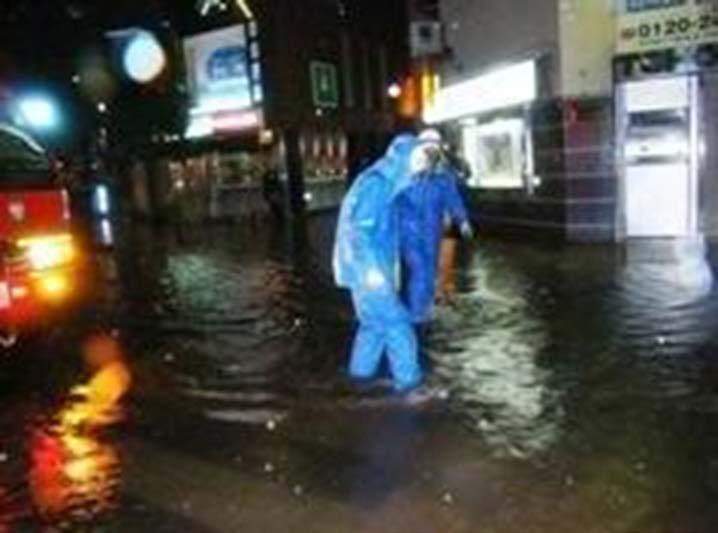
3 3 Aichi (2008) Fukushima (2010) Reference: Present inundation countermeasures need to be improved against heavy rain.


4 4 1. Increasing rate of heavy rain 2. Case studies about increase of heavy rain 3. Examples of stormwater storage systems 4. Effective use of stormwater

5 5 Is heavy rain occurring more frequently? Analysis data from Japan Meteorological Agency Annual maximum 10-minute rainfall intensity Annual maximum 60-minute rainfall intensity For 50 years ( ) 57 meteorological observatories
6 6 10 minutes 60 minutes Rainfall intensity (mm/hr) Rainfall intensity (mm/hr) 5-year probability Increasing rate for 50 years : 8% 10-year probability Increasing rate for 50 years : 8% 5-year probability Increasing rate for 50 years : 9% 10-year probability Increasing rate for 50 years : 10% Calculated by the Thomas plot method

7 7 Increasing rate of 5-year probable rainfall intensity for 50 years 57 meteorological observatories percentile パーセンタイル値 value パーセンタイル Percentile value パーセンタイル times 10 分間 minutes 60 分間 minutes times percentile パーセンタイル値 value 毎年最大降雨量の増加率 Increasing rate of rainfall intensity (times) 降雨強度の増加率
")
8 8 Increasing rate of 10-year probable rainfall intensity for 50 years 57 meteorological observatories パーセンタイル値 percentile value Percentile パーセンタイル value times 10 minutes 60 minutes times 50 percentile 50パーセンタイル値 value Increasing rate 毎年最大降雨量の増加率 of rainfall intensity (times)
9 9 Image of Scenario Pattern Rainfall intensity (mm/hr) 1.3 times 1.3 times 10 minutes 60 minutes Time Conventional planned rainfall intensities Scenario A (1.3 times Increase of 10-minute rainfall intensity) Scenario B (1.3 times Increase of 60-minute rainfall intensity) Scenario C (1.3 times Increases both of 10-minute rainfall intensity and 60-minute rainfall intensity) Object districts District X District Y District Z Area of drainage district (10 4 m 2 ) 3, ,900
10 10 District name District X District Y District Z Area of drainage district (10 4 m 2 ) 3, ,900 Scenario A (Increase of 10- minute rainfall intensity) Scenario B (Increase of 60- minute rainfall intensity) Scenario C (Increase of 10- minute and 60- minute rainfall intensity) Increasing rate of inundation area* (inundation depth over 0.2 m) Main region of inundation Increasing rate of inundation area* (inundation depth over 0.2 m) Main region of inundation Increasing rate of inundation area* 0.7% 6% 0.4% - Upstream - 7% 0% 7% Midstream - Overall In regards to small catchment 9% areas, it is 6% important 4% to (inundation depth over 0.2 m) consider the impact of short periods of rainfall. Main region of inundation Midstream Upstream, Midstream As for large catchment areas, improving the level of drainage over a wide area is effective. Overall * Increase rate of inundation area = ((Inundation area according to the scenario) (Area inundated by conventional planned rainfall)) / (Total area)


11 Reference: Sewage Works in Japan 2009(Japan Sewage Works Association) 11
12 12 Underground storage pipes Underground storage ponds Reference: ukan/usui_choryuukan.htm Reference: annou_stormwaterreservoir.pdf Surface storage in parks Storage in paddy fields Reference: u/chisui/sogochisui.html Reference: terplan/suiden/documents/suidentyoryu-taihu2gou.pdf In recent years, effective use of stormwater storage is increasing in Japan.


13 stormwater utilization systems of 9 local governments Systems vehicle-washing industrial use cleaning water etc. Consideration of stormwater use like this figure is important in the efficient use of water resources.
14 14 1. Increasing rate of heavy rain 10-minute rainfall intensity and 60-minute rainfall intensity of 5 or 10 year probability are likely to increase, and the increasing rates are estimated 1.3 or 1.4 times in 50 years at most. 2. Case studies about increase of heavy rain In regards to small catchment areas, it is important to consider the impact of short periods of rainfall. As for large catchment areas, improving the level of drainage over a wide area is effective.
15 15 3. Examples of stormwater storage systems Underground pipes, underground ponds, surface in the parks, and in paddy fields as stormwater storage is increasingly effective in Japan. 4. Effective use of stormwater The major use of stormwater is toilet water, followed by sprinkler system, etc. Consideration of stormwater use is important in the efficient use of water resources.
 Program \"Innovative Technology and System for")
16 The authors are deeply grateful to all staff members of local governments who cooperated with this research. A part of this research is supported financially by Core Research for Evolutional Science and Technology (CREST) Program "Innovative Technology and System for Sustainable Water Use" of Japan Science and Technology Agency (JST).
17 17 Extremely heavy rain is increasing in Europe, North America and South America.* In the long term, total amount of rainfall is increasing in the Southern Hemisphere, but it's not changing significantly in worldwide.** Reference: Japan Meteorological Agency * **
 Time (minute) Scenario A (1.")
18 18 Rainfall Intensity was calculated by the formula which can calculate rainfall intensity only from 10-minute rainfall and 60-minute rainfall. Conventional planned rainfall intensities Rainfall intensity (mm/hr) Time (minute) Scenario A (1.3 times Increase of 10-minute rainfall intensity) Rainfall intensity (mm/hr) 10 minutes: 1.3 times Time (minute)
 60 minutes: 1.3 times To evaluate on more dangerous situation 60 minutes: 1.3 times 10 minutes: 1.")
19 19 Scenario B (1.3 times Increase of 60-minute rainfall intensity) Rainfall intensity (mm/hr) Rainfall intensity (mm/hr) Time (minute) Scenario C (1.3 times Increases of 10-minute and 60-minute rainfall intensity) 60 minutes: 1.3 times To evaluate on more dangerous situation 60 minutes: 1.3 times 10 minutes: 1.3 times Time (minute)
 3,350 62 1,900 Runoff coefficient 0.45 0.60 0.")
20 20 In order to compare the results of a large catchment area and a small catchment area, we chose three districts. District name District X District Y District Z Drainage method Combined Separate Combined Area of drainage district (10 4 m 2 ) 3, ,900 Runoff coefficient minute rainfall Rainfall intensity (mm/hr) simulated 10-minute rainfall intensity (mm/hr) Minimum diameter of sewer pipe simulated (mm) 1, Software used for the simulations* MOUSE MOUSE InfoWorks * The model which each city was using for formulation of sewer plans Different characteristics of geographic and rainfall Adequate data for inundation simulation


21 21 Conventional planned Scenario A Scenario B Scenario C Downstream Midstream Upstream Inundation depth (m) Main region of inundation depends on size of catchment areas. However, it's not clear only from this result. It is necessary to simulate in other districts.
22 22 Small catchment area (District Y) In regards to small catchment areas, it is important to consider the impact of short periods of rainfall. So, peak cut type countermeasures are effective. Large catchment area (District X, District Z) As for large catchment areas, improving the level of drainage over a wide area is effective. So, improvement in drainage capacity is effective. For example, it's the network of large-scale sewer pipes.


23 23 Underground storage pipes Underground storage ponds Reference: ukan/usui_choryuukan.htm Reference: annou_stormwaterreservoir.pdf Underground storage pipes and underground storage ponds have benefit that large quantity for storage was ensured. However, construction of these takes high cost and long period. Surface storage in parks Storage in paddy fields Reference: u/chisui/sogochisui.html Reference: terplan/suiden/documents/suidentyoryu-taihu2gou.pdf Surface storage in parks and storage in paddy fields are cheaper than large storage systems, but require approval of the park manager or owner of paddy fields.
24 24 Institution kind Storage capacity (m 3 ) Time started to use Purpose of use Amount of annual use (m 3 ) Public office 1,095 Feb., 1990 Toilet water, Sprinkler system *1 10,000 Public office 86 Oct., 2009 Toilet water, Sprinkler system Public office 1,200 Jun., 2003 Cooling water *2, Landscaping water *3 School Apr., 1998 Toilet water, Sprinkler system 744 2,634 3,565 Communal facility 2,000 May., 1999 Toilet water 35,158 Tourist facility 500 Dec., 2000 Toilet water 6,000 7,000 [*1] Sprinkler system: Watering a tennis court, a garden, a road, etc. [*2] Cooling water: Cooling an air conditioner, etc. [*3] Landscaping water: Creating a artificial river, a artificial pond, etc.
25 25 Increase of heavy rain By conducting other simulations and investigations, the countermeasures which have effects in each district are found out. Effective use of stormwater We will visualize data on a map and exhibit the map on the Internet. By doing so, we promote effective use of stoemwater. Effective use of stoemwater in storage systems is increasing, but the area is still restricted. For example, it is an area with few water resources.