THE WORLD COUNCIL ON CITY DATA
|
|
|
- Maximilian Manning
- 5 years ago
- Views:
Transcription
1 THE WORLD COUNCIL ON CITY DATA GPSC and AfDB African Regional Workshop Integrated Urban Development in Africa: Challenges and Lessons Learnt Nico Tillie, Director European Office of the World Council on City Data & Urbanism, TU Delft Abidjan 14th of May Facebook: WCCityData

2 Cities and the Challenges of Data v ISO World Council on City Dataa


3 It is about improving. How do you perform, challenges, targets, actions? Knowing where to invest For this you need standardised globally comparable city data, comparing apples to apples third part verified data feedback on our score

4 The first ISO standard for cities.
5 ISO Indicators
6 17 themes Economy Governance Telecommunications Education Health Transportation Energy Recreation Urban Planning Environment Safety Wastewater Finance Shelter Water & Sanitation Solid Waste Fire & Emergency Response


7 WORLD COUNCIL ON CITY DATA WELCOMING CITIES OF ALL SIZES TO BECOME ISO CERTIFIED 0 50,000 50, , , , , , , , ,000 1,000,000 1,000,000 5,000,000 5,000,000 10,000,000 10,000,000


8 WCCD CERTIFICATION LEVELS ASPIRATIONAL BRONZE SILVER GOLD PLATINUM Core Indicators Indicators Indicators Indicators Indicators 46 Core Supporting 46 Core Supporting 46 Core Supporting 46 Core

9 WCCD ISO CERTIFIED CITIES
10 Creating a Family of Standards for City Data

11 HOW FINANCIALLY INDEPENDENT IS MY CITY? High own-source revenue as a percentage of total revenues 83.2% Tshwane

12 HOW CONNECTED IS MY CITY? 212,792 Number of non-stop commercial flights annually. Amsterdam

13 HOW INCLUSIVE IS MY CITY S WORKFORCE? Percentage of women employed in the city government workforce 41.87% Minna

14 HOW TRANSITFRIENDLY IS MY CITY? High percentage of commuters using a travel mode to work other than a personal vehicle 71.28% Cape Town
15 DATA PLATFORM FOR ANALYTICS, EXPLORING RELATIONS WITH LIFE EXPECTANCY 100 DATA POINTS average(24.6 µg/m³) MELBOURNE ZWOLLE TORONTO LONDO N BARCELO LOS ANGELES NA AMSTERDAM BOSTON ROTTERDAM Gemiddelde (76 jaar) MAKATI SHANGHAI BOGOTA AMMAN GUADALAJARA DUB AI MAKKAH JOHANNESBURG PM2.5
16 EXPLORING WCCD ISO DATA IN AFRICAN CITIES
17

18

19

20
21

22

23

24

25 Africa urgently needs to industrialize To make this happen, we need investments in infrastructure. At the African Development Bank, we are talking about using aid to massively leverage private capital to fund Africa s development" Akinwumi Adesina, President, African Development Bank, May 7th 2018
26 WCCD ISO DATA CAN HELP
27 CITY DATA FOR INFRASTRUCTURE INVESTMENT A. Pre-Investment Support: Building a Robust Baseline for Evidence Based Decision Making B. Post-Investment Support: Measuring Infrastructure Investment Impact Across Ontario and

28


29 TORONTO GLOBAL CATCHMENT REGION

30 Investable Cities Index City Data for City Leaders

31 To harness standardised, globally comparable, city data as essential to tackling global, national and local agendas


32 WCCD LOCAL DATA HUBS SUPPORTING DATA FOR AFRICAN CITIES

33

34 The United Nations Sustainable Development Goals - 17 Goals for 2030

35

36

37

38

39 USING THE DATA: EXAMPLE OF LOCAL USE IN CITIES

40 A MAP IS EASIER TO READ THAN MANY EXCELL SHEETS ISO37120 indicator
")

41 Themes and indicators (orange is threshold) Helps with focusing, behind each indicator is a GIS map


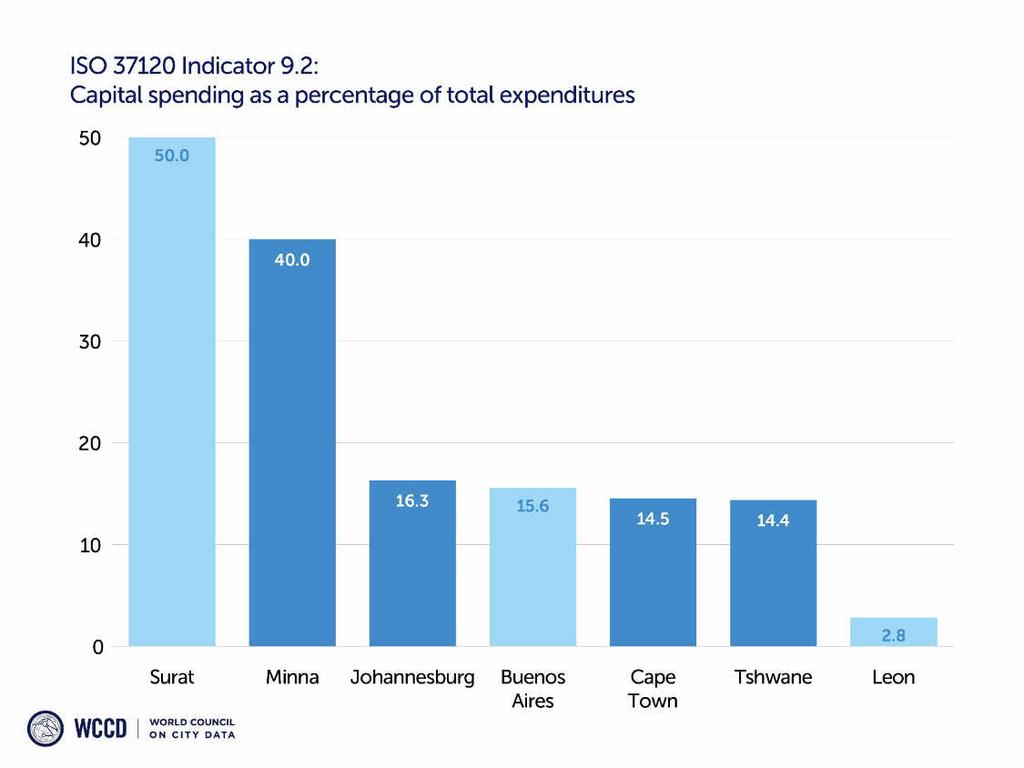
42 Sustainability and Quality of life performance for whole city and for all 90 neighborhoods


43 Facilitate the transition use data and gis mapping Inhabitants, stakeholders Government as a stakeholder PROJECT Smart City Planner & Profile Kaarten (WAT, WAAR WAAROM DAAR) Put open, objective data on the table challenges opportunities Coalitions Goals actions


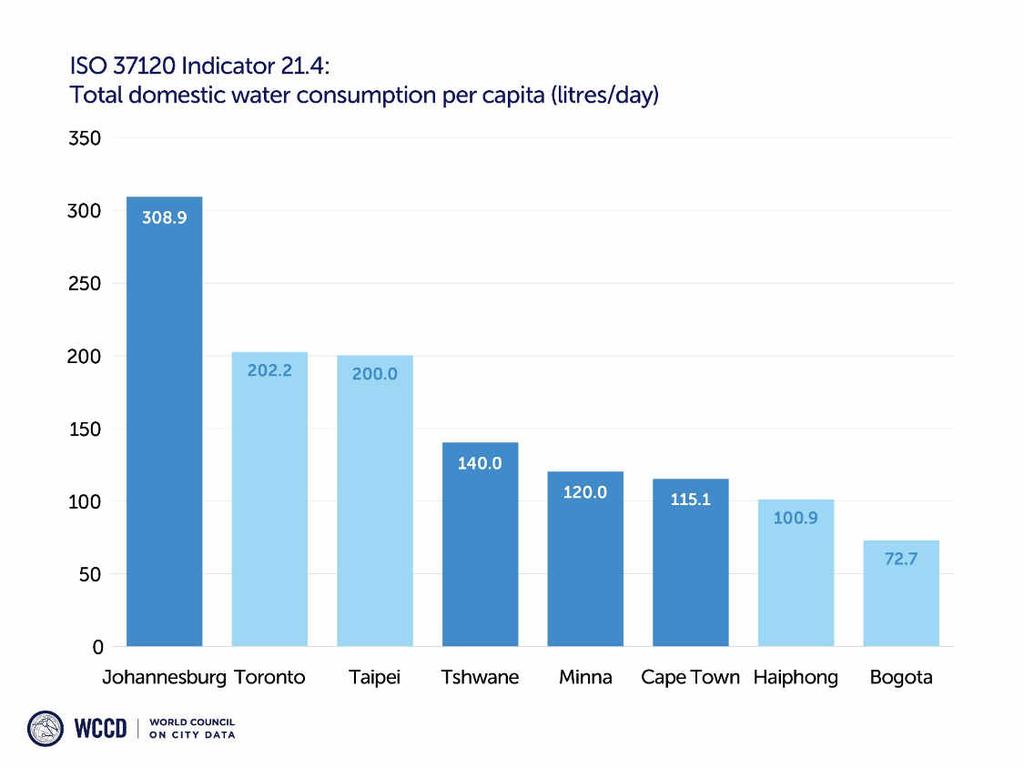
 This leads back to")
44 DATA KNOWLEDGE THAT LEADS TO INFORMED INVESTMENT DECISIONS Waterproblems, recreation shortage, poor public space Possible solution : watergarden, water square (resilience!) This leads back to the basic indicators in the standard37120


45

46
47 the value of municipal data generated by The World council on City data DATA THAT IS: Globally Standardized (ISO 37120) Regularly Reported (Annual Reporting) Independent and Third Party Verified (WCCD + Externally Audited) Open (Housed on the WCCD Global Open Data Portal) Drives informed infrastructure investment Pre-requisite for sound investment and smart city development
48 THE WORLD COUNCIL ON CITY DATA Toronto, ON M5S 2H9 Phone Web WCCD 2018, All Rights Reserved
49 ISO INDICATORS Theme ECONOMY Core Indicator EDUCATION ENERGY ENVIRONMENT City s unemployment rate Assessed value of commercial and industrial properties as a % of total assessed value of all properties % of city population living in poverty % of female school-aged population enrolled in schools % of students completing primary education: survival rate % of students completing secondary education: survival rate Primary education student/teacher ratio Total residential electrical energy use per capita (kwh/year) % of city population with authorized electrical service Energy consumption of public buildings per year (kwh/ m²) % of total energy derived from renewable sources, as a share of the city s total energy consumption Fine particulate matter (PM2.5) concentration Particulate matter (PM10) concentration Greenhouse gas emissions measured in tonnes per capita Supporting Indicator % of persons in full-time employment Youth unemployment rate Number of businesses per population Number of new patents per population per year % of male school-aged population enrolled in schools % of school-aged population enrolled in schools Number of higher education degrees per population Total electrical energy use per capita (kwh/year) Average number of electrical interruptions per customer per year Average length of electrical interruptions Nitrogen dioxide (NO2) concentration Sulphur dioxide (SO2) concentration Ozone (O3) concentration Noise pollution % change in number of native species
50 ISO INDICATORS Theme FINANCE FIRE AND EMERGENCY RESPONSE Core Indicator Debt Service ratio (debt service expenditure as a % of a municipality s own-source revenue) Number of firefighters per population Numbers of fire related deaths per population Number of disaster related deaths per population Supporting Indicator Capital spending as a percentage of total expenditures Own-source revenue as a percentage of total revenues Tax collected as a percentage of tax billed Number of volunteer and part-time firefighter per population Response time for emergency response services from initial call Response time for fire department from initial calls GOVERNANCE Voter participation in last municipal election (as % of eligible voters) Women as a % of total elected to city-level office HEALTH Average life expectancy Number of in-patient hospital beds per population Number of physicians per population Under age five mortality per live births % of women employed in the city government workforce Number of convictions for corruption and/or bribery by city officials per population Citizen s representation: number of local officials elected to office per population Number of registered voters as a % of the voting age population Number of nursing and midwifery personnel per population Number of mental health practitioners per population Suicide rate per population
51 ISO INDICATORS Theme Core Indicator RECREATION SAFETY Number of police officers per population Number of homicides per population SHELTER % of city population living in slums Supporting Indicator Square meters of public indoor recreation space per capita Square meters of public outdoor recreation space per capita Crimes against property per Response time for police department from initial call Violent crime rate per population Number of homeless per population Percentage of households that exist without registered legal titles % of the city s solid waste that is disposed of in a sanitary landfill % of the city s solid waste that is disposed of in an incinerator % of the city s solid waste that is burned openly % of the city s solid waste that is disposed of in an open dump % of the city s solid waste that is disposed of by other means Hazardous Waste Generation per capita (tonnes) % of the city s hazardous waste that is recycled SOLID WASTE % of city population with regular waste collection (residential) Total collected municipal solid waste per capita per year % of the city s solid waste that is recycled TELECOMMUNICATIONS AND INNOVATION Number of internet connections per population Number of cell phone connections Number of landline phone connections per population
52 ISO INDICATORS Theme Core Indicator Supporting Indicator Kilometres of high capacity public transport system per population Kilometres of light passenger public transport system per population Annual number of public transport trips per capita Number of personal automobiles per capita Green area (hectares) per population TRANSPORTATION URBAN PLANNING WASTEWATER % of city population served by wastewater collection % of the city s wastewater that has received no treatment % of the city s wastewater receiving primary treatment % of the city s wastewater receiving secondary treatment % of the city s wastewater receiving tertiary treatment % of city population with potable water supply service % of city population with sustainable access to an improved water source % of population with access to improved sanitation Total domestic water consumption per capita (litres/day) WATER AND SANITATION Percentage of commuters using a travel mode other than a personal vehicle Number of two-wheel motorized vehicles per capita Kilometres of bicycle paths and lanes per population Transportation fatalities per population Commercial air connectivity (number of non-stop commercial air destinations) Annual number of trees planted Areal size of informal settlements as a percentage of city area Jobs/housing ratio Total water consumption per capita (litres/day) Average annual hours of water service interruption per household % of water loss (unaccounted for water)