River Export of N, and Coastal and Freshwater Eutrophication
|
|
|
- Prosper Sparks
- 5 years ago
- Views:
Transcription


1 River Export of N, and Coastal and Freshwater Eutrophication Bob Howarth Workshop on Nitrogen Assessment in the USA Boulder, CO May 19, 21
2 Eutrophication caused by both nitrogen and phosphorus (should control both). Strong tendency for nitrogen control in estuaries and coastal marine ecosystems (can be driven to phosphorus limitation). Freshwaters? Often nitrogen control in systems with very low productivity (oligotrophic, ultra-oligotrphic) phosphrous control in more produtive systems (mesotrophic, eutrophic(.


3 Two-thirds of US coastal waters degraded from nutrient pollution, primarily nitrogen Both N and P should be controlled (NRC 2). Coastal nutrient pollution particularly N is a rapidly increasing global problem resulting in proliferation of hypoxic & anoxic zones (UNEP 28).
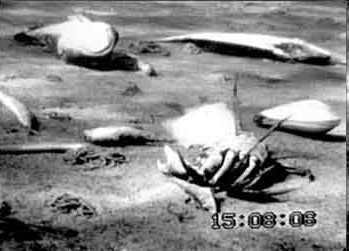
4 Dead Zone
5


6

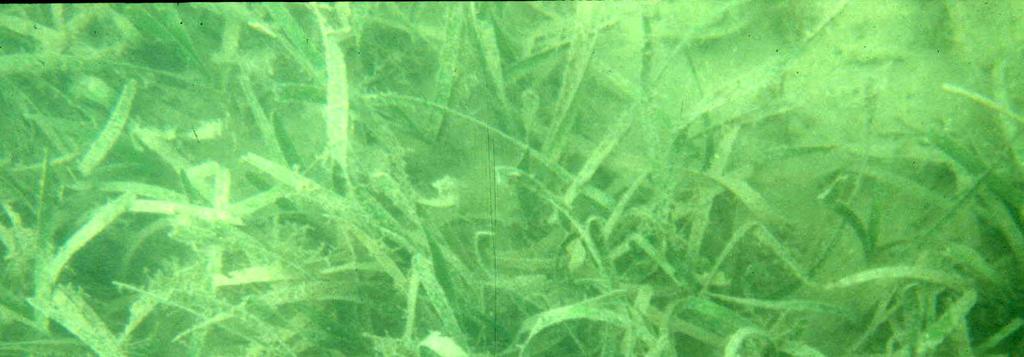
7 Harmful algal blooms (related to low N:Si)

8 National assessment by NOAA of extent and severity of coastal nutrient pollution in USA. All coastlines affected. 2/3rds of coastal rivers and bays degraded. (Bricker et al. 1999)

9 Bricker et al. 27
10 Response due both to nutrient inputs and sensitivity of ecosystem (based on physics, ecology).

11 Schindler et al. (28), Proc. National Academy of Sciences: The proponents of controlling N in lakes and estuaries are relying on the same bioassays or correlations with nutrient concentrations that we found to lead to the erroneous conclusion that N inputs must be controlled to reduce eutrophication. These bioassays and the related assumptions have led to very expensive mitigation programs in several countries. To reduce eutrophication, the focus of management must be on decreasing inputs of phosphorus. The only reliable source of information in lakes or estuaries comes from wholeecosystem experiments.


12 Evidence for N limitation in coastal marine ecosystems: bioassays and nutrient ratios. mechanistic differences in biogeochemistry of lakes and estuaries (N fixation, P desorption from particles, etc.). mesocosm experiments. (Oviatt et al. 25)
13 Is there any whole-ecosystem evidence for nitrogen vs. phosphours control of eutrophication in estuaries and coastal waters? Searched for systems where one nutrient (N or P) went down while the other stayed steady or increased over time.. Or where one nutrient went up while the other stayed steady. And where quality data on both inputs and ecosystem response available. (MANY examples of systems where both N and P increased over time.. Also some where both decreased). (with Gilles Billen, Josette Garnier, Daniel Conley, and Roxanne Marino)


14 Seine and Scheldt Basins and Belgian coast of North Sea North Sea Collaborative project with European colleagues led by Gilles Billen and Josette Garnier English Channel
15 Seine River basin TN flux, kgn/km²/yr Freshwater discharge TN load TP flux, kgp/km²/yr annual mean discharge, m3/s TP load
16 Molar TN:TP ratio in nutrient flux TN:TP, Seine River 8. Seine River 7. Redfield Ratio TN:TP ratio Year
17 Molar TN:TP ratio in nutrient flux TN:TP, Seine River 8. Seine River 7. Redfield Ratio TN:TP ratio 6. Expect N limitation in coastal receiving waters Year
18 Molar TN:TP ratio in nutrient flux TN:TP, Seine River 8. Seine River 7. Redfield Ratio TN:TP ratio 6. Increasing P limitation? Year


19 Station 33, Belgian coast, North Sea max Chla, mg/m Phaeocyst is 1 µm 1 m m
20 max Chla, mg/m3 3 2 Chlorophyll in North Sea on Belgian coast TN flux, kgn/km²/yr Seine River N load TN flux, kgn/km²/yr 4 3 Scheldt River N load
21 Why did production remain N limited in coastal North Sea, despite increasingly high N:P ratios (well above Redfield)? P supplied from coastal waters. N:P ratio very low on most of the continental shelves of the world s oceans (6:1). Provides huge supply of P potentially.
22 West Falmouth Harbor Watershed load of N and N:P ratio Nitrogen only. P adsorbed in soils 2.5 N:P = ~ 21:1 (with Roxanne Marino, Karen McGlathery, Peter Berg, Anne Giblin, Ken Foreman, & Melanie Hayn) Kmol N per day 2. N:P = ~ 6:
23 Inner West Falmouth Harbor --average summer rates of Gross Primary Productivity Year GPP (mol O2 m-2 d-1)
24 Very dynamic patterns for inorganic N and P on a daily time scale. Inorganic N:P ratio remains extremely low throughout West Falmouth Harbor in recent years (usually less than 1:1). Indicates continued strong N limitation, despite high N:P of external load from watershed!
 1,8 mol d-1 Net import of TP From Buzzards Bay during summer 225 mol d-1 N:P ratio from combined external inputs =")
25 Watershed TN load Measured at mouth! (Hayn et al.) 1,8 mol d-1 Net import of TP From Buzzards Bay during summer 225 mol d-1 N:P ratio from combined external inputs = 8:1 P inputs from coastal waters sufficient to maintain N limitation.
26 Similar story for the Yangtze River estuary (high N:P load in river, yet N limitation maintained by low N:P from the Yellow Sea): Xiangan Li, Zhiming Y, Xiuxian S, Xihua C, and Yongquan Y. 21. Studies on the nitrogen and phosphorus budgets of the Changjiang estuary. Est Coast Shelf Science, in press.
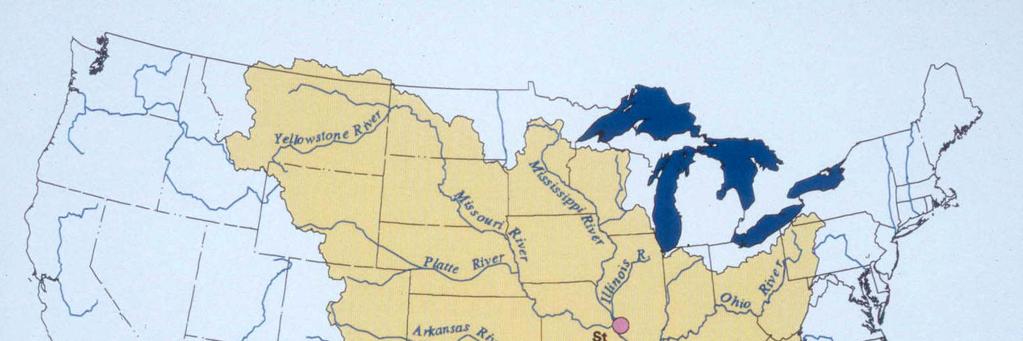
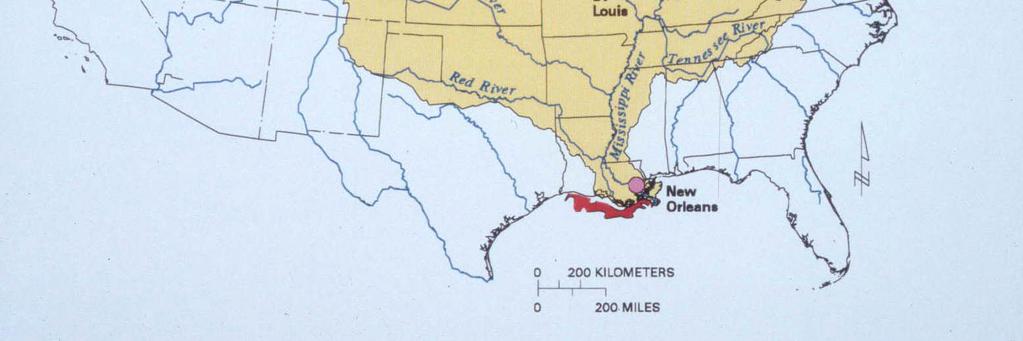
27 Northern Gulf of Mexico hypoxic area ( dead zone )? Unusually little exchange of deep ocean water onto the continental shelf, making the high N:P of the Mississippi River more likely to shift the ecosystem towards P limitation (Howarth et al. 21. Frontiers in Ecology & Environment, in press).
28 Take-home messages: Very few whole ecosystem studies have quality data and clearly separate effects of N and P. Nonetheless, several available whole-ecosystem studies provided important insights. P control alone is not effective for coastal eutrophication. N is clearly critical in causing coastal eutrophication. Both N and P should be controlled. N:P ratio of river inputs to the coast is not a reliable indicator of whether N or P is limiting. P supply from coastal water masses with low N:P ratios important in determining effect of riverine nutrient loads.
 International SCOPE N Project (Howarth et al. 1996)")
29 North Atlantic Ocean Kg N km-2 year-1 NANI (net anthropogenic N inputs) International SCOPE N Project (Howarth et al. 1996)
30 8 Riverine TN flux (kg N km -2-1 yr ) Riverine TN flux as a function of NANI for all watersheds 6 y =.24x R = , 1, 15, 2, -2-1 NANI (kg N km yr ) ~ 25% of NANI exported to coastal oceans on average from 15 watersheds in Europe and the US 25, 3, ~ 15 watersheds on two continents
31 Fraction of NANI exported in rivers is a function of the freshwater discharge Frac tio n o f NANI expo rted in riverine N flux as a functio n o f disc harge fo r all watersheds > 5 k m2 4 Fraction NANI export y =.15x R = Discharge (mm yr )
32 Simple regression model based on NANI and freshwater discharge Predicted riverine TN flux (kg N km-2 yr-1) 6 5 Prediction model: Flux = NANI (.24Q +.14); 4 r =.86 1:1 line :1 line Observed riverine TN flux (kg N km yr )
33 Hong et al., submitted

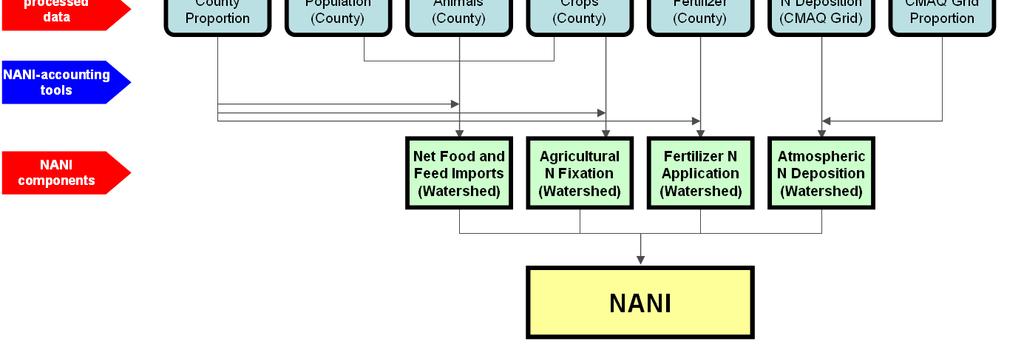
34 NANI tool box Hong et al., submitted

35 22 Hong et al., submitted
36 Hong et al., submitted
.")
37 Also applying NANI at fine spatial scale across Europe (with Christoph Humborg and colleagues at Univ. of Stockholm and Gilles Billen and colleagues at University of Paris). Can provide nitrogen flux estimates for any watershed in US and Europe. Formed basis of estimates for river nitrogen fluxes in European Nitrogen Assessment (Billen et al., in press). NANI 27
38 Nine major sub-basins of the Mississippi River 22: y = e.12x R2 = : y = 1.51e.8x R2 =.818 TN flux 15 27:y = e.9x R2 = NANI TN flux vs NANI for 9 Mississippi subbasins (MARB Data) y =.64x - 6. R2 =.818 TN flux (kg N/km2/yr) avg NANI (kg N/km2/yr) Swaney, Hong, and Howarth (unpubl.)
39 Fraction of NANI exported Fraction of NANI exported vs discharge for 9 Mississippi subbasins (MARB Data) y =.6x R2 = avg US and European watersheds Discharge (mm/yr) Hong, Swaney, and Howarth (unpubl.)
40 Predicted TN flux (kg N km -2yr-1) Comparison of 9 major Mississippi River sub-basins (red) with 15 other watersheds in Europe and the US 6 5 Prediction model: Flux = NANI(.34Q+.12) R2= :1 line Miss basins Predicted TN flux (kg N km yr ) Observed riverine TN flux (kg N km -2yr-1) 1 Prediction model: Flux = NANI(.34Q+.12) R2= :1 line 1 9 Miss basins Observed riverine TN flux (kg N km yr )


41 Thanks for invitation to participate! NOAA Coastal Hypoxia Research Program NSF Biocomplexity Coupled Biogeochemical Cycles Development of Wedge Analysis for Solutions to the Coastal Nitrogen Pollution in the US