MICHAEL YULKIN. WGE 2018 meeting, Skelleftea (Sweden), 14/11/2018
|
|
|
- Geoffrey Hunt
- 5 years ago
- Views:
Transcription
1 EIC MICHAEL YULKIN WGE 2018 meeting, Skelleftea (Sweden), 14/11/2018

2 Climate Cooperation in Barents Region 2
3 Project s Main Objective and Schedule The main objective of the Project was to enhance and strengthen the ongoing cooperation between Nordic countries and north-west Russia in order to increase the possibility for reaching the Paris Agreement s goal, i.e. limiting the increase of global mean temperature to o C. The Project was implemented in 2 stages: 1 st Stage from January through to June nd Stage from July through to October
4 Project Milestones Stage 1 (Jan Jun 2018) Sustainable network of project partners established Database identifying the region's main sources of greenhouse gas and black carbon emissions (GHG inventories) developed Possibilities to reduce GHG and black carbon emissions identified Meeting with the region's main emitters of GHG conducted 4
5 Project Milestones Stage 2 (Jul Oct 2018) Dialog with main GHG emitters organised to share and spread the knowledge about how to use sustainable CRS strategies to promote green marketing and green growth 2025 carbon strategies for the main emitters compiled and analysed Action plan (road map) to reduce GHG emissions (exemplified for LULUCF) prepared 5

 On the Swedish side: Energy and")
6 Project Partners On the Russian side: EIC One of the top Russian professional advisors and service providers in the sphere of climate change mitigation and adaptation Member of the UN Sustainable Development Solutions Network (SDSN) On the Swedish side: Energy and climate unit 6

7 Project Agreement 7

8 Project network On 1 Feb 2018 the meeting with the region's main emitters of GHG was conducted with representatives of 10 biggest GHG emitters as well as the representatives of the regional ministry of natural resources and forestry attending. As the outcome of the meeting the pool of interested emitters was established by signing to the relevant MoU prepared by EIC 8


")

9 Project network State budgetary institution of the Arkhangelsk region "CENTER FOR NATURE MANAGEMENT AND ENVIRONMENTAL PROTECTION" ARKHANGELSK PULP-AND-PAPER MILL ILIM GROUP TGK-2 (Generating company) TITAN GROUP OF COMPANIES SAWMILL 25 GAZPROM TRANSGAZ UKHTA (based in the Republic of Komi) 9


10 Arkhangelsk region (Russia) 10
, Mt Источник: данные АНО")
11 Arkhangelsk region (Russia) Preliminary estimation of СО 2 emissions from fossil fuel combustion (including Nenets Autonomous District), Mt Источник: данные АНО «ЦЭИ» 11
")
12 Norrbotten (Sweden) 12


13 Norrbotten (Sweden) 13
14 Arkhangelsk region s GHG Inventory 2016 GREENHOUSE GAS SOURCE AND SINK CATEGORIES CO2 CH4 N2O HFCs PFCs SF6 СО2 equivalent (kt) Unspecified mix of HFCs and PFCs Total (net emissions) , , ,62 115,78 1,19 2,76 NO, NA, NE NO ,16 1. Total energy ,76 771,35 158, ,62 A. Fuel combustion activities (sectoral approach) ,55 46,82 158, ,89 1. Energy industries 4 325,69 4,82 13, ,87 a. Public electricity and heat production 3 953,68 4,42 12, ,68 i. Electricity production 51,47 0,05 0,12 51,65 ii. Combined heat and power generation 3 423,19 1,38 6, ,36 iii. Boiler houses 479,02 2,99 5,66 487,68 b. Petroleum refining NO NO NO NO c. Manufacture of solid fuels and other energy industries 372,01 0,40 0,78 373,19 2. Manufacturing industries and construction 3 687,04 16,21 55, ,53 a. Iron and steel IE IE IE IE b. Non-ferrous metals NO NO NO NO c. Chemicals 0,29 0,00 0,03 0,32 d. Pulp, paper and print 3 337,74 14,34 35, ,30 e. Food processing, beverages and tobacco 10,11 0,02 0,05 10,18 f. Non-metallic minerals 0,05 0,00 0,01 0,06 g. Other 338,84 1,86 19,98 360,67 i. Machines and equipment 0,11 0,01 0,03 0,15 ii. Vehicles and equipment 6,36 0,01 0,72 7,09 iii. Mining industry (excluding fuel) 174,85 0,21 10,23 185,29 NF3 TOTAL 14
15 Arkhangelsk region s GHG Inventory 2016 GREENHOUSE GAS SOURCE AND SINK CATEGORIES CO2 CH4 N2O HFCs PFCs SF6 СО2 equivalent (kt) Unspecified mix of HFCs and PFCs Total (net emissions) iv. Wood processing and woodware production ,18 9, ,64 1, ,62 2,46 115,78 1,19 2,76 NO, NA, NE NO ,16 13,49 v. Construction 42,46 0,07 4,67 47,20 vi. Textile and clothing manufacture NA NA NA NA vii. Other industries 105,48 0,10 1,87 107,45 3. Transport 3 732,67 9,56 68, ,21 a. Domestic aviation 179,63 0,03 1,50 181,16 b. Road transportation 1 358,20 8,08 20, ,41 c. Railways 400,90 0,56 46,11 447,58 d. Domestic navigation 36,58 0,09 0,29 36,96 e. Other transportation 1 757,35 0,80 0, ,10 i. Pipeline transport 1 757,35 0,80 0, ,10 ii. Other IE IE IE IE 4. Other sectors 498,16 10,01 14,71 522,89 a. Commercial/institutional 316,09 5,14 4,67 325,89 b. Residential 59,76 2,91 0,47 63,14 c. Agriculture/forestry/fishing 122,32 1,97 9,57 133,86 i. Stationary 2,36 1,73 0,28 4,36 ii. Off-road vehicles and other machinery 78,94 0,14 8,96 88,04 iii. Fishing 41,02 0,10 0,33 41,45 5. Other 146,99 6,21 6,19 159,40 a. Stationary 51,83 6,03 0,70 58,56 b. Mobile 95,15 0,19 5,50 100,84 B. Fugitive emissions from fuels 0,20 724,53 NO, NA 724,73 1. Solid fuels NА NА NА NA 2. Oil and natural gas and other emissions from energy production 0,20 724,53 NO, NA 724,73 a. Oil NА NА NА NA NF3 TOTAL 15
16 Arkhangelsk region s GHG Inventory 2016 GREENHOUSE GAS SOURCE AND SINK CATEGORIES CO2 CH4 N2O HFCs PFCs SF6 СО2 equivalent (kt) Unspecified mix of HFCs and PFCs Total (net emissions) a. Oil ,18 NА 2 393,64 NА 1 299,62 NА 115,78 1,19 2,76 NO, NA, NE NO ,16 NA b. Natural gas 0,17 115,40 NO, NA 115,58 i. Exploration NO NO NO NO ii. Production NO NO NO NO iii. Processing NO NO NO NO iv. Transportation and storage 0,00 22,95 NA 22,95 v. Distribution 0,17 92,46 NA 92,63 vi. Other NO NO NO NO c. Venting and flaring 0,03 609,12 NA 609,15 d. Other NO NO NO NO C. CO2 Transport and storage NO NO 2. Total industrial processes 42,41 NO, NA, NE, IE 11,15 115,78 1,19 2,76 NO, NE NO 173,29 A. Mineral industry NA, NO, IE NA, NO, IE 1. Cement production NA NA 2. Lime production NA NA 3. Glass production NO NO 4. Other process uses of carbonates IE IE B. Chemical industry 1,92 NO, NA NO NO NO NO NO NO 1,92 1. Ammonia production NO NO NO NO 2. Nitric acid production NO NO 3. Adipic acid production NO NO NO 4. Caprolactam, glyoxal and glyoxylic acid production NO NO NO 5. Carbide production 1,92 NO, NA 1,92 a. Silicon carbide NO NO NO b. Calcium carbide 1,92 NA 1,92 6. Titanium dioxide production NO NO 7. Soda ash production NO NO 8. Petrochemical and carbon black production NO NO NO NF3 TOTAL 16
17 Arkhangelsk region s GHG Inventory 2016 GREENHOUSE GAS SOURCE AND SINK CATEGORIES CO2 CH4 N2O HFCs PFCs SF6 СО2 equivalent (kt) Unspecified mix of HFCs and PFCs Total (net 7. emissions) Soda ash production ,18 NO 2 393, ,62 115,78 1,19 2,76 NO, NA, NE NO ,16 NO 8. Petrochemical and carbon black production NO NO NO 9. Fluorochemical production NO NO NO NO NO NO 10. Other NO NO NO NO NO NO NO NO NO C. Metal industry IE IE IE NO NO NO NO NO IE, NO D. Non-energy products from fuels and solvent use 3,99 NE NE 3,99 1. Lubricant use 3,99 NE NE 3,99 2. Paraffin wax use NE NE NE NE 3. Other NE NE NE NE E. Electronics industry NO NO NO NO NO NO F. Product uses as substitutes for ODS 115,78 1,19 NE NE NO 116,97 G. Other product manufacture and use NO NO 11,15 NO NO 2,76 NO NO 13,91 1. Electrical equipment NO NO 2,76 NO NO 2,76 2. SF6 and PFCs from other product use NО NО NО NО 3. N2O from product uses 5,58 5,58 a. Medicical applications 5,58 5,58 b. Other NO NO 4. Other NO NO NO NO NO NO NO NO NO H. Other 36,50 NO NO NO NO NO NO NO 36,50 1. Pulp and paper 36,50 NO NO NO NO NO NO NO 36,50 2. Food and beverages industry NA NO NO NO NO NO NO NO NA, NO 3. Agriculture NE, NO 108,21 138,31 246,53 A. Enteric fermentation 102,39 102,39 1. Cattle 97,77 97,77 2. Sheep 2,49 2,49 3. Swine 0,38 0,38 4. Other livestock 1,75 1,75 NF3 TOTAL 17
18 Arkhangelsk region s GHG Inventory 2016 GREENHOUSE GAS SOURCE AND SINK CATEGORIES CO2 CH4 N2O HFCs PFCs SF6 СО2 equivalent (kt) Unspecified mix of HFCs and PFCs Total (net 3. emissions) Swine , ,64 0, ,62 115,78 1,19 2,76 NO, NA, NE NO ,16 0,38 4. Other livestock 1,75 1,75 B. Mature management 5,83 14,60 20,43 1. Cattle 4,43 5,99 10,42 2. Sheep 0,06 0,41 0,47 3. Swine 1,02 0,62 1,64 4. Other livestock 0,32 1,24 1,55 5. Indirect N2O emissions 6,35 6,35 C. Rice cultivation NO NO D. Agricultural soils NE 123,71 123,71 E. Prescribed burning of savannas NO NO NO F. Field burning of agricultural residues NO NO NO G. Liming NE NE H. Urea application NE NE I. Other carbon-containing fertilizers NO NO J. Other NO NO NO NO 4. Total LULUCF ,28 23,20 969, ,92 A. Forest land ,00 22,93 954, ,49 B. Cropland 13,71 NO NO 13,71 C. Grassland 851,41 0,27 14,57 866,25 D. Wetlands NO NO NO NO E. Settlements 103,00 NO NO 103,00 F. Other land NO NE NE NO,NE G. Harvested wood products 4 343, ,60 H. Other NE NE NE NE 5. Total waste 0, ,89 22, ,65 A. Solid waste disposal NA 1 401, ,23 1. Managed waste disposal sites NA 830,06 830,06 18 a. Anaerobic NA 830,06 830,06 NF3 TOTAL
19 Arkhangelsk region s GHG Inventory 2016 GREENHOUSE GAS SOURCE AND SINK CATEGORIES CO2 CH4 N2O HFCs PFCs SF6 СО2 equivalent (kt) Unspecified mix of HFCs and PFCs 5. Total Total (net waste emissions) ,18 0, ,89 393, ,62 22,47 115,78 1,19 2,76 NO, NA, NE NO ,65 148,16 A. Solid waste disposal NA 1 401, ,23 1. Managed waste disposal sites NA 830,06 830,06 a. Anaerobic NA 830,06 830,06 b. Semi-aerobic NO NO NO 2. Unmanaged waste disposal sites NA 571,17 571,17 3. Uncategorized waste disposal sites NO NO NO B. Biological treatment of solid waste NO, IE NO, NA NO, IE, NA 1. Composting NO NO NO 2. Anaerobic digestion at biogas facilities IE NA IE, NA C. Incineration and open burning of waste 0,29 0,00 0,00 0,29 1. Waste incineration 0,29 0,00 0,00 0,29 2. Open burning of waste NO NO NO NO D. Wastewater treatment and discharge 89,66 22,47 112,13 1. Domestic wastewater 75,03 22,47 97,50 2. Industrial wastewater 14,63 NO 14,63 3. Other NO NO NO E. Other NO NO NO NO 6. Other NA NA NA NA NA NA NA NO NA, NO NF3 TOTAL 19
20 Arkhangelsk region s GHG Inventory 2016 GREENHOUSE GAS SOURCE AND SINK CATEGORIES CO2 CH4 N2O HFCs PFCs SF6 СО2 equivalent (kt) Unspecified mix of HFCs and PFCs Total Memo (net items: emissions) , , ,62 115,78 1,19 2,76 NO, NA, NE NO ,16 International Bunkers 73,86 0,17 0,58 74,61 Aviation NE NE NE NE Navigation 73,86 0,17 0,58 74,61 Multilateral operations NO NO NO NO CO2 emissions from biomass 4 269, ,06 СО2 captured NO NO NE - not estimated, NA - not applicable, NO - not occurring, IE - estimated but included elsewhere NF3 TOTAL Total CO2 equivalent emissions without land-use, land-use change and forestry ,08 Total CO2 equivalent emissions with land-use, land-use change and forestry ,16 20

21 Arkhangelsk region s GHG Inventory 2016 Distribution of GHG emissions among major emitters APPM OTHER EMITTERs ILIM GROUP GAZPROM TRANSGAZ UKHTA TGK-2 21
22 Black Carbon Emissions 2016 Sources of emission 1. Energy sector i Electricity generation ii Combined power and heat generation iii Boiler houses с. Manufacture of solid fuels and other energy industries Sub-Total: 2. Manufacturing industries and construction с. Chemicals d. Pulp, paper and print е. Food processing, beverages and tobacco f. Non-metallic minerals g. Другое Sub-Total: Emission, kg 6 256, , , , ,1 32, ,3 382,2 6, , ,0 22
23 Black Carbon Emissions 2016 Sources of emission Emission, kg Transport Energy sector а. Domestic i Electricity aviation generation ,1 256,1 b. ii Road Combined transportation power and heat generation ,2 993,5 с. Railways iii Boiler houses ,9 897,2 d. с. Manufacture Domestic navigation of solid fuels and other energy industries ,6 529,3 Sub-Total: е. Other transportation ,3 676,1 Sub-Total: 2. Manufacturing industries and construction ,1 4.. с. Other Chemicals sectors 32,2 а. d. Commercial/institutional Pulp, paper and print ,0 401,3 b. е. Food Residential processing, beverages and tobacco 4 579,6 382,2 с. f. Non-metallic Agriculture/forestry/fishing minerals ,4 6,5 Sub-Total: g. Другое ,0 769,8 5. Sub-Total: Other Stationary and Mobile Sources ,4 592,0 TOTAL: ,6 23
24 Black Carbon Emissions 2016 Fuel Share of Black Carbon Emissions, % Diesel 35,9% Fuel oil 27,7% Biomass (firewood, bark and wood waste, black liquor, waste water sludge) 17,4% Coal 8,4% 24
25 Possibilities to reduce GHG and black carbon emissions Energy saving/energy efficiency Energy switch to renewables and biomass Switch to bio-diesel and electric vehicles Introduction of 3R (reduce-reuse-recycle) approach to waste management Sustainable forest management including forest protection against wildfires and harmful insects 25
26 Meetings with the main emitters One-to-one discussions on the benefits and opportunities of CRS strategies and low carbon development with have been organized with APPM, ILIM GROUP and Sawmill 25, which resulted in bilateral agreements with EIC on GHG emissions monitoring/quantification, reporting and management including development of 2030 carbon strategies The meeting was organised by Arkhangelsk Pulp-and-Paper Mill at its premises in the city of Novodvinsk (Arkhangelsk region) on the occasion of the World Climate Change Day on 15 May 2018 where most big GHG emitters were presented 26
27 Carbon Strategies So far, carbon strategies towards 2030 have been elaborated for and adopted by Arkhangelsk PPM and Sawmill 25. Carbon strategy for ILIM GROUP is under preparation now and will be presented by EIC early next year. 27
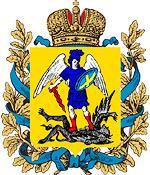
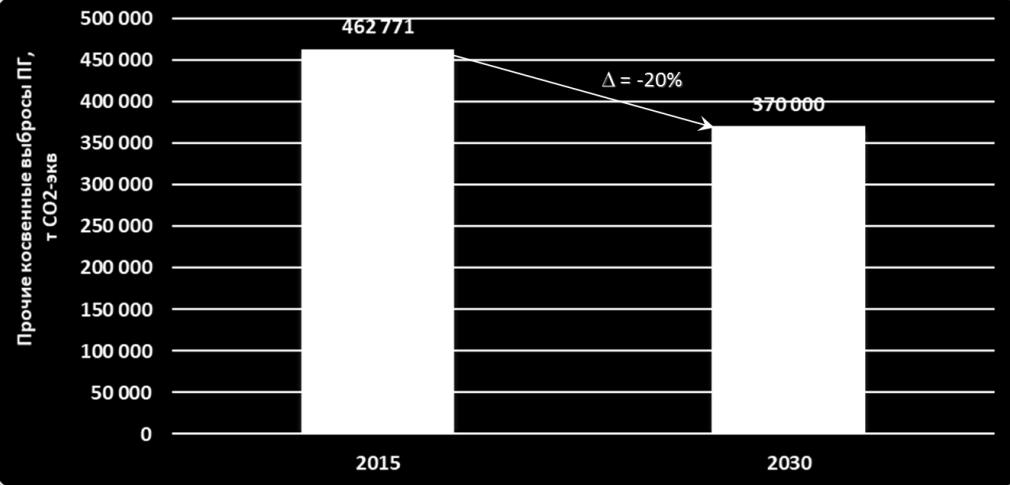
28 Carbon Strategies Arkhangelsk PPM APPM has decided to control its direct and indirect emissions, both energy and other, associated with the production. The goal it has set for 2030 is twofold: o to reduce direct and energy indirect GHG emissions by 55% below the 1990 level, and o to reduce GHG emissions up the supply chain by 20% below 2015 level. Now APPM is considering whether it can set science based targets in accordance with the requirements and criteria set forth by SBTI. 28
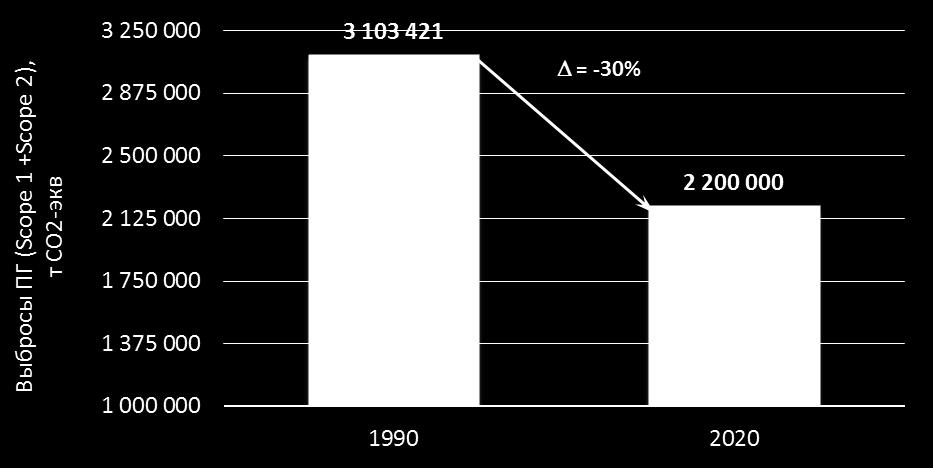

29 Carbon Strategies Arkhangelsk PPM Strategy 2012 Strategy 2020 Strategy

30 Carbon Strategies Arkhangelsk PPM. GHG emissions in


31 Carbon Strategies Arkhangelsk PPM. Specific GHG emissions in
32 Carbon Strategies Sawmill 25 Sawmill 25 fully compensates its carbon footprint by avoided GHG emissions from consumers, supplying them with fuel pellets it produces from its own wood waste. These pellets are used to produce energy instead of fossil fuels (normally, coal, and often in the same boilers, as the technologies of energy combustion of coal and pellets are almost the same). A part of waste (mostly bark) generated in the process of sawing is used by the company to generate energy for its internal needs, thus covering 100% of its needs for heat and partly for electrical energy. SM25's carbon strategy towards 2030 provides for the reduction of specific GHG emissions per 1 cubic meter of processed wood by 20% and also for the increase of production and supply of the low-carbon products (wood pellets) by 75% compared to
33 Carbon Strategies ILIM Group The carbon strategy would cover 6 affiliates of ILIM Group located both in Arkhangelsk region (Kotlas PPM and the logging enterprise in Koryazhma) and in Irkutsk region in Siberia (Ust-Ilimsk PPM, Bratsk PPM and 2 logging enterprises). 33
34 Action Plan Corporate level Carbon strategies of APPM and Sawmill 25 are accompanied by their individual action plans which include measures aimed at reducing of GHG emissions in accordance with the established targets. Action plan for ILIM Group will be presented next year together with its 2030 carbon strategy. 34
35 Action Plan Regional level Road map to reduce GHG emissions for the Arkhangelsk region as a whole is yet to be developed. Apart from additional time and efforts, this will require discussions and cooperation with different regional ministries, i.e. the Ministry of energy, housing and communal services, the Ministry of agroindustrial complex and trade, the Ministry of transportation, the Ministry of Economic development, as well as with the companies operating in the region (TGK-2, Northern Railways, Gazprom, etc.). The step that has to be made first of all is a long term vision of the Arkhangelsk region as a part of the Russian economy, Barents economy and the world economy. 35
36 Action Plan Energy sector Potentially, GHG emissions from energy sources in the region can be reduced dramatically through reduced fossil fuel combustion in power generation, district heating, industries, natural gas transmission, railway transportation, aviation, city commuting, vehicles and trucks. This would also help reduce black carbon emissions which are mainly produced by diesel and heavy oil combustion. However a lot has to be done to achieve this in terms of motivation, regulation and finance. 36
37 Action Plan LULUCF Potential to increase CO 2 removals from the atmosphere through LULUCF activities in forest land has been evaluated. According to our estimates, in 2030 CO 2 removals by forests might vary between MtCO 2 e and MtCO 2 e, subject to the logging strategy, forest conservation and protection measures as well as climate change impact. However the wildfire risks, the risks of harmful insect attacks and other adverse risks associated with climate change would increase over time imposing challenges and threats onto the forest sector in the region and requiring therefore higher attention to all risk factors that might occur or escalate over time because of climate change. 37
38 Action Plan LULUCF The amount of GHG emissions and removals coming as a result of LULUCF activities are generally very uncertain. This uncertainty roots partly in rather poor information available, especially with regard to the forest current status, conditions and dynamics, and also in the calculation methodology which includes a number of assumptions and speculations that cannot not be reasonably checked and proved. 38
39 Findings and takeaways Technically, the Arkhangelsk region is well prepared to monitor and report its GHG emissions in accordance with international standards. There s a huge potential to reduce GHG and black carbon emissions through improved energy generation and use, including switch from fossil fuels to renewables and biomass. The potential to enhance CO 2 removals and storage in the forests is also there. However risks and challenges imposed on forest sector by climate change should be taken into account and managed properly. A number of major GHG emitters in the region have started caring about their GHG emissions and carbon footprint and come up with smart carbon strategies or are about to do so soon. The Arkhangelsk regional government is yet hesitant about climate change mitigation strategy and does not have action plan to reduce GHG emissions nor a plan to come up with such a plan any time soon 39
40 Findings and takeaways More time and efforts as well as discussions with different regional ministries and companies are needed to get to the point where they start seeing climate change mitigation and transition to low carbon development route as an opportunity and potential benefits rather than a burden and wasted costs. Probably, the good idea would be to launch a Barents Climate Partnership (or Alliance) as international platform for more close cooperation in the region on climate change mitigation and adaptation where the leaders of the Barents regions from different countries can learn from each other, share their concerns, develop common vision and joint climate strategies (initiatives) combining their efforts and resources to reduce GHG emissions in line with the Paris agreement goals for the benefit of their economies, business and people. 40
41 ЦЭИ Thank you for your attention! Michael Yulkin Mobile phone: