A strategy for kinetic parameter estimation in the pyrolysis of lignin
|
|
|
- Meredith Evans
- 5 years ago
- Views:
Transcription

1 Engineering Conferences International ECI Digital Archives BioEnergy IV: Innovations in Biomass Conversion for Heat, Power, Fuels and Chemicals Proceedings Spring A strategy for kinetic parameter estimation in the pyrolysis of lignin Raffaella Ocone Heriot-Watt University Mustafa Adam Heriot-Watt University Javeed Mohammad ICFAR Franco Berruti ICFAR Cedric Briens ICFAR Follow this and additional works at: Part of the Chemical Engineering Commons Recommended Citation Raffaella Ocone, Mustafa Adam, Javeed Mohammad, Franco Berruti, and Cedric Briens, "A strategy for kinetic parameter estimation in the pyrolysis of lignin" in "BioEnergy IV: Innovations in Biomass Conversion for Heat, Power, Fuels and Chemicals", Manuel Garcia- Perez,Washington State University, USA Dietrich Meier, Thünen Institute of Wood Research, Germany Raffaella Ocone, Heriot-Watt University, United Kingdom Paul de Wild, Biomass & Energy Efficiency, ECN, The Netherlands Eds, ECI Symposium Series, (2013). This Conference Proceeding is brought to you for free and open access by the Proceedings at ECI Digital Archives. It has been accepted for inclusion in BioEnergy IV: Innovations in Biomass Conversion for Heat, Power, Fuels and Chemicals by an authorized administrator of ECI Digital Archives. For more information, please contact franco@bepress.com.

2 Mustafa Adam, Raffaella Ocone Heriot-Watt University, Edinburgh, UK Javeed Mohammad, Franco Berruti, Cedric Briens ICFAR, Western University, London Ontario, Canada


 Bio-oil: Phenolic oily")

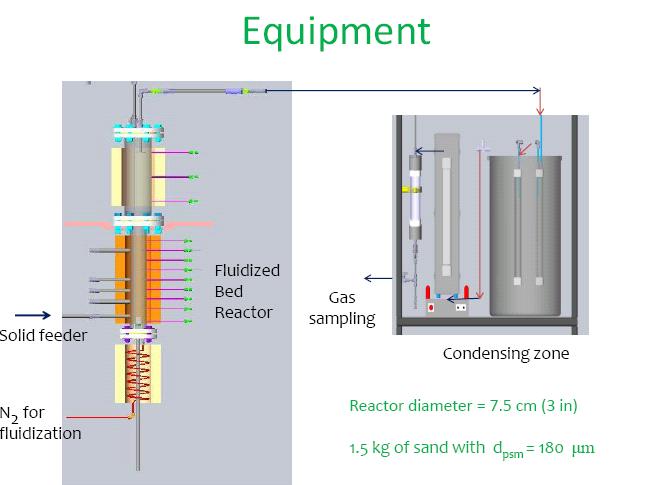
3 Pyrolysis Gases: most commonly detected gas species are CO, CO2, CH4, CH2O, CH3CHO, H2O, H2 Lignin Fluidised bed pyrolyser (temperature C) Bio-oil: Phenolic oily fraction and carbohydrate-rich water fraction Bio-char: carbon and ashes
4
5
6


7 Mechanical Stirrer Mechanical Stirrer No mixer: 200g of lignin fed Mixer: 80 rpm 200g of lignin fed
8 Lumping of Multi-Component Reactive Mixtures Substitute to the real mixture an equivalent one of (fewer) pseudo-component which mimics more or less exactly the behaviour of the real mixture DISCRETE Lumping Interest only in global quantities (which are usually the only accessible to measurement) CONTINUUM Lumping 7
9 Thermal Degradation (Pyrolysis) Gases Lignin DL Oil CL Lighter components Residue Gas Oil Char Char how the total mass change with time time=1.2h wt(%) total mass comulative wt % Time (h) time(h) 15 time=1.2h number of components 10 wt % number of components
10 Modelling Discrete lumping kinetics for pyrolysis of lignin Model 1 Lignin decomposition is described by three parallel reaction. The reaction rate constants of these reactions can be determined by measuring theamount of each lump as a function of time.
11 Discrete lumping kinetics for pyrolysis of lignin Model 2
12 yield (wt%) Models results Discrete model 1 (better suited for the FB without mixing) pyrolysis temperature ( C) Tar exp Tar model Char exp Char model Gas exp Gas model
13 yield (wt%) Models results Discrete model pyrolysis temperature ( C) Tar exp Gas exp Char exp Tar model Gas model Char model
14 Applying the CL to the fractionation of bio-oil Label the species Devise the kinetic model Write the governing equations (mass balance) Calculate the lumped concentration Calculate the lumped rate of reaction
15 Model Formulation The mass balance (model) for generic component of reactivity k is: dc( k, t) dt kc( k, t) k max k p( k, K) Kc( K, t) D( K) dk Disappearance Production from all the components with a higher reactivity First order kinetics is assumed in agreement with a number of papers in the field (e.g. Ho, 2008)
16 Model Results (short residence time)
17 Kinetic parameters for the pyrolysis of lignin T ( C) K G K T K c Reaction Rate Constant Frequency Factor (s -1 ) Activation Energy (J/mol) K G K T K C
18 Continuum Modelling
19 Parameters of the Continuum Model (bio-oil)
20 Future Work Further model validation Feed distribution function to link the CL to the DL to generate a complete model (the species-type distribution function, D(k), contains the kinetics and it is a characteristic of the feed only) Gases Lignin DL Oil CL Lighter components Char
21 Conclusions Discrete lumping models predict well the yields observed in FB and MF bed reactors The continuum model is shown to be appropriate to predict the cracking (upgrading) of bio-oil in a catalytic reactor (utilising methodologies and lessons borrowed from the fossil fuel industry) Much less analytical support required (when compared with mechanistic models) smaller number of model parameters Effectively used for rapid catalyst screening/evaluation (new catalysts?) Polymerisation (CL) Monomers Oligomers (CL)
22
23 Labelling the Components Identify a label which can be attributed univocally to a species x The concentration c(x,t) is the concentration at time t of the species in the interval (x, x+dx) c x) C h( x) dx ( 0 With C 0 the lumped initial concentration (at t=0) and h(x,) a distribution function which is normalised to assure mass conservation: 0 xh( x) dx 1
24 Labelling the Components The label is the molecular weight, n(i) The normalised molecular weight can be defined with respect the highest, n(h) and the lowest n(l) molecular weight: q n( i) n( h) n( l) n( l) The concentration of the generic component i can then be expressed as: c i ( t) c( q, t) dq Assume that the molecular weight is univocally related to the reactivity, the relation between q and k being monotonic: k k max q 1
25 The Yield Function p(k,k) has to be zero when k=k (the species of reactivity k cannot yield to itself upon cracking) p(k,k)=0 for k>k since net polymerisation is not significant p(k,k) has to satisfy a material balance p(k,k) should be a finite, small nonzero value when k=0 (this property is a consequence of the experimentally observed fact that, when a component of reactivity K cracks, even the smallest reactivity components are formed in traces) p(k,k) should always be positive
26 Model Formulation The term: k max k p( k, K) Kc( K, t) D( K) dk contains all the constitutive hypothesis about the model p( k, K) is the yield distribution function and needs to have the shape of a skewed Gaussian. It contains three parameters that determine the peak location and constraint the distribution to verify the total mass balance.