Climate Scenarios and Climate Sensitivity for the Bay Delta Conservation Plan
|
|
|
- Suzan Mercy Morgan
- 5 years ago
- Views:
Transcription

1 Climate Scenarios and Climate Sensitivity for the Bay Delta Conservation Plan Armin Munévar, CH2M HILL CWEMF Annual Meeting Asilomar, CA March 1, 2011
2 Presentation Focus Key Research/Application Questions Which climate projections should be selected for longrange water planning impact analyses when the entire ensemble cannot be simulated? What balance of climate projection versus observed variability should be incorporated in planning? How can climate change uncertainty be presented as scenarios of the future? Scenarios based on these research/application questions were developed for use in the Bay Delta Conservation Plan Summary of Projected Changes to System


3 Sacramento-San Joaquin Delta supports a vital ecosystem and serves as a major hub for water exports Delta smelt Sacramento Recent export restrictions under biological opinions Stockton SWP Pumps CVP Pumps 3

4 Bay Delta Conservation Plan (BDCP) Collaborative approach to restore the Sacramento San Joaquin Delta s ecosystem and protect water supplies Conservation measures being considered by the BDCP tidal marsh restoration, floodplain restoration, alternative ways for conveying water for exports, changes to operations of current facilities, and control of toxic pollutants, invasive species, and other impairments to water quality
5 Delta Water Quality (DSM2-QUAL, RMA) Delta Hydrodynamics (DSM2-HYDRO, RMA) Delta channel flows, velocities, stage Salinity (EC, Cl, TDS, Br), Organic Carbon, Temp, Nutrients Estuarine Species Food Web Regional Hydrology (VIC) Upper watershed inflows & patterns Hydrology & System Operations (CALSIM II) River flows, exports, storage, deliveries Delta Particle Tracking (DSM2-PTM, RMATRK) Particle fate and transport, residence time, Expected Outcomes for Covered Fish Reservoir and River Temperature (SRWQM) Reservoir, river temperature Anadromous Species River & Reservoir Fish (DPM, OBAN, SalMod) Integrated & Cascading Set of Analyses Process seeks permit for a 50 yr period Quantitative analysis being prepared for disclosure of impacts/ effects at three points in time Approximately 2015, 2025, and 2060


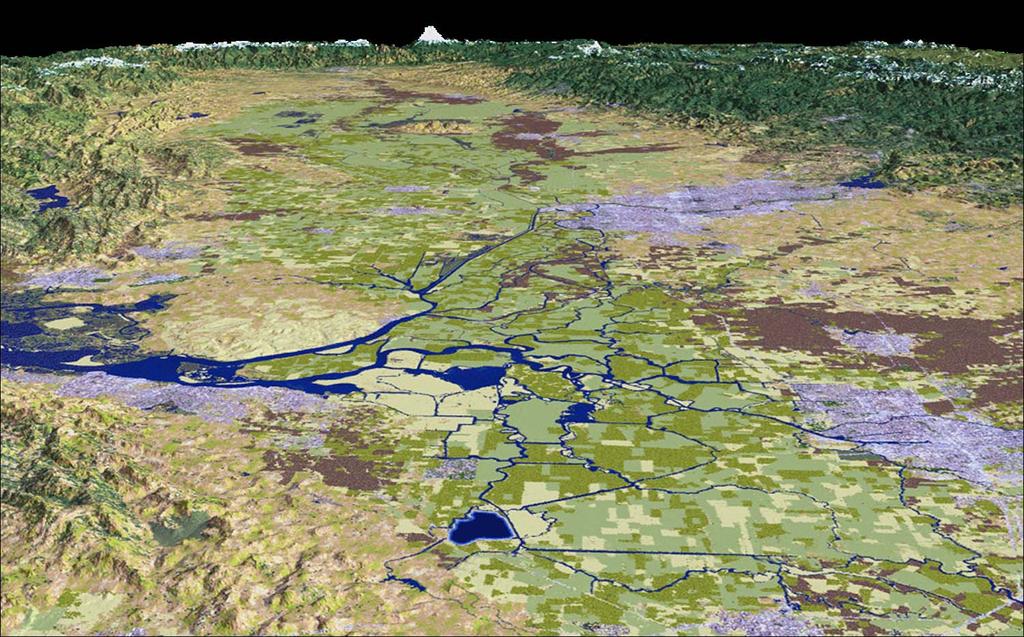
6 Observed Climate (Maurer et al 2002) Temperature Precipitation
7 Observed Statewide Temperature Trends
8 Observed Statewide Precipitation Trends

9 Downscaled Climate Projections 112 downscaled climate projections PCMDI CMIP3 DCP archive BCSD downscaling method 16 GCMs included in IPCC AR4 SRES A2, A1b, and B1 scenarios to bracket range Multiple realizations Source: IPCC 2007 Modeling Group, Country Bjerknes Centre for Climate Research Canadian Centre for Climate Modeling & Analysis Meteo-France / Centre National de Recherches Meteorologiques, France CSIRO Atmospheric Research, Australia US Dept. of Commerce / NOAA / Geophysical Fluid Dynamics Laboratory, USA US Dept. of Commerce / NOAA / Geophysical Fluid Dynamics Laboratory, USA NASA / Goddard Institute for Space Studies, USA Institute for Numerical Mathematics, Russia Institut Pierre Simon Laplace, France Center for Climate System Research (The University of Tokyo), National Institute for Environmental Studies, and Frontier Research Center for Global Change (JAMSTEC), Japan Meteorological Institute of the University of Bonn, Meteorological Research Institute of KMA Max Planck Institute for Meteorology, Germany Meteorological Research Institute, Japan National Center for Atmospheric Research, USA National Center for Atmospheric Research, USA Hadley Centre for Climate Prediction and Research / Met Office, UK WCRP CMIP3 I.D. BCCR-BCM2.0 CGCM3.1 (T47) CNRM-CM3 CSIRO-Mk3.0 GFDL-CM2.0 GFDL-CM2.1 GISS-ER INM-CM3.0 IPSL-CM4 MIROC3.2 (medres) ECHO-G ECHAM5/ MPI- OM MRI-CGCM2.3.2 CCSM3 PCM UKMO-HadCM3


10 Multi model Ensemble is Superior to Any Individual Model Projection Statistical significance of model trend in JFM Tmin for western U.S. with increasing # of realizations Same model Different models Change in model skill score with increasing # of realizations Source: Pierce et al, 2009 Source: Gleckler et al, 2008
11 Climate Scenarios Nearest Neighbor Method GCMs Q1 (10NN) Q2 (10NN) Q3 (10NN) Relationship Between Changes in Mean Annual Temperature and Precipitation Scenarios - 10 NN Method Feather River Basin (Example) Q2 (drier, more warming) Change over period as compared to base period Q3 (wetter, more warming) Q4 (10NN) Temperature Change (C) T50 P50 T10 P10 T90 P90 Q5 T P25 T75 P75 Q1 (drier, less warming) Q4 (wetter, less warming) PRELIMINARY DRAFT NOT 0.0 FOR DISTRIBUTION Precipitation Change (%)


")

12 Temperature 2025 Temperature 2060 Projected Changes in Annual Temperature and Precipitation (Q5 Scenario) Precipitation 2025 Precipitation 2060


13 VIC Hydrologic Analysis VIC Model Grid VIC Routing Network Climate interaction with the watershed characteristics matter immensely

14 Streamflow Routing and Climate Station Locations
15 Temperature Projections Delta 2060
16 Precipitation Projections Feather River 2060
17 Projected Streamflow Feather River at

18 Projected Streamflow Feather River at

19 Projected Streamflow Tuolumne River at New Don
20 Projected Streamflow Tuolumne River at New Don

21 2025 Simulated Changes in Annual Runoff North North South Transect 2060
22 Navigating Sea Level Rise Uncertainty BCDC 2009 USACE 2009 Delta Vision/CALFED ISB 2009 DWR/CAT 2009 OCAP BA 2008/BOs DRMS 2009 IPCC cm (18 inches) 15 cm (6 inches) Source: Rahmstorf 2007

23 Effect of Sea Level Rise on Salinity Intrusion X2 is defined as the position of the 2 psu bottom salinity value, and is measured along the axis of the estuary in km from the Golden Gate 140 km 130 km 120 km 110 km 20 km 20 km 40 km 50 km 60 km 70 km 80 km 90 km 10 km 0 km Source: MacWilliams 2010

24 Putting it Together system responds to climate forcings at both the watershed scale and ocean boundary CALSIM II hydrology and operations model California IPCC emission scenarios 1. Emissions Scenario 5. Operations Models 2. Climate Simulations IPCC AR4 simulations. Statistically downscaled. 4. Hydrologic Models 3. Spatial Downscaling San 6. Francisco Bay-Delta Models UNTRIM, RMA, DSM2 estuary models VIC hydrologic model Sea level change Adapted from Cayan and Knowles, SCRIPPS/USGS, 2003
 No Action Shasta Carryover")

25 Summary of Changes to the Delta System (Difference at 2060 from No Action, No Climate Change reference) No Action Shasta Carryover Storage (kaf) Proposed Project Shasta Carryover Storage (kaf) Increase in No. of Events Activating Floodplain (more than 7 consec. days) DRAFT

")
")
")
26 Summary of Changes to the Delta System (Difference at 2060 from No Action, No Climate Change reference) No Action Proposed Project Delta Exports (kaf/yr) Delta Exports (kaf/yr) DRAFT Spring Delta X2 (km) Spring Delta X2 (km)
27 Summary Long range planning for programs such as the BDCP with cascading analyses and many alternatives require a manageable, yet informative set of climate scenarios for analysis Ensemble informed climate scenarios have been developed for California for this long range planning purpose Hydrologic and system responses to future climate change is substantial, but geographically/facility varied
28 Thank you! Armin Munévar, CH2M HILL
29 Sorting through Regional Climate Uncertainty Annual Temperature Tavg Change (ºC) Change (C) Q2 Q1 Relationship between Changes in Period-Mean Annual Precipitation and Temperature: Folsom (112 projections, evaluated at 2060 [ ] relative to ) P Precipitation trends are less conclusive, particularly in near-term All projections indicate strong warming trend % -20% -10% 0% 10% 20% 30% Mean Annual Prcp Change (%) Annual Precipitation Change (%) 82 Q Q4 All T50