INNOVATING FOR BETTER URBAN WATER AND SANITATION SERVICES
|
|
|
- Julian Perry
- 5 years ago
- Views:
Transcription
1 INNOVATING FOR BETTER URBAN WATER AND SANITATION SERVICES Jenna Davis Associate Professor and Higgins-Magid Senior Fellow Dept. of Civil & Environmental Engineering and Woods Institute for the Environment Stanford University April 2016 World Resources Institute Ross Center for Sustainable Cities
2 Roadmap Trends in access & challenges for water service provision in low-income urban settings Case 1: Water resale in Maputo, Mozambique Case 2: Point-of-collection disinfection in Dhaka, Bangladesh Trends in access & challenges for sanitation service provision in low-income urban settings Case 3: Container-based sanitation service in Cap Haitien, Haiti Looking ahead
3 Urban water access in 2015
4 Share of urban population with indicated water supply service in 1990 and 2015, by World Bank income group 100% Unimproved Shared piped Piped on premises 80% 60% 40% 20% 0% Low income Lower middle income Upper middle income Total (excl. high income) Source: Figure created using Joint Monitoring Programme data, downloaded from wwwinfo.org

5 Share of urban households with improved water supply on premises, 2015 Source: Figure created using Joint Monitoring Programme data, downloaded from wwwinfo.org

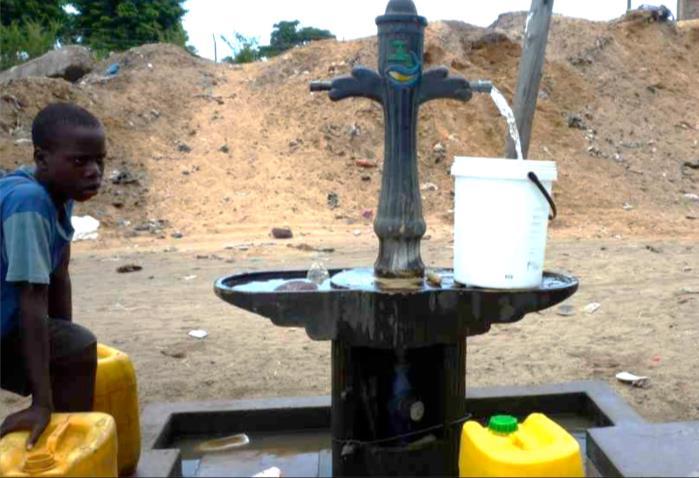
6 Urban water supply service challenges Hard to charge costrecovering water tariffs, despite strong user demand Poor households spend more time, money per unit volume of water Photo: A. Schwartz than non-poor Few cities in low-income countries provide 24-hour water service Improved water sources may not deliver safe water
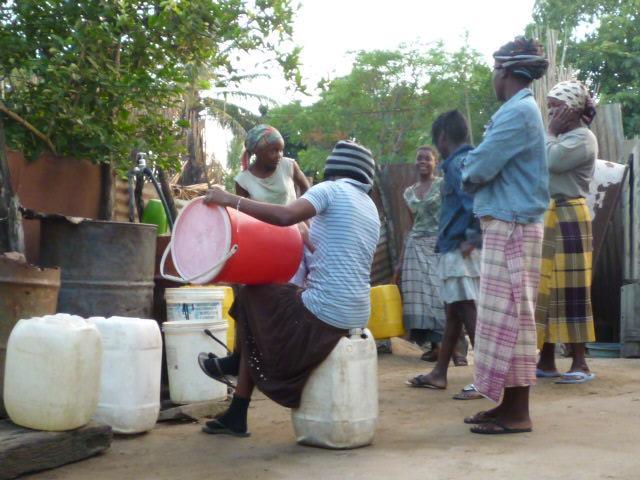
7 Case 1: Water resale


8 Maputo, Mozambique ~1.7 million people ~50% below poverty line
9 Neighbor s Tap Public Standpipe Maputo, Mozambique: Water supply service by wealth quintile, 2007 Quintile 1 The Poorest Neighbor's Tap Public Standpipe Utility Connection Private Standpipe Informal Connection Source: Water Regulatory Council of Mozambique Beneficiary assessment. Slide Water Regulatory Council of Mozambique. Thanks to Manuel Alvarinho.

10 Photo: V. Zuin Photo: V. Zuin Photo: M. Alvarinho/CRA Photo: V. Zuin
11 How should resale be addressed in public policy? Standpipes traditionally viewed as propoor service level Limited public health benefits Often a financial liability for utility Resale is prohibited in some contexts; more often has ambiguous legal status (as was the case in Maputo)
 Walking 56 50 Neighbor's tap (n=390) Queueing/filling")
. 1.06 Own tap, utility (=298) 1.")
12 Time and money costs Mean daily walk, queue time Mean expenditure/1000 liters (US$) Standpipe (n=300) Walking Neighbor's tap (n=390) Queueing/filling Standpipe (n=301) Neighbor's tap (n=402) Source: V. Zuin et al J Water Health 9(4) Own tap, utility (=298) 1.67 Own tap, SSIP (n=137)
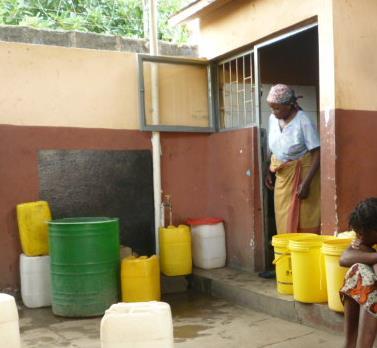
13 Service quality, reliability Standpipe (n~300) Neighbor s tap (n~400) Reliable service? 89% 76% Ave. hours/day Water use (LPCD) Good quality at source 85% 85% Standpipe users 1.8 times more likely to report satisfaction with service, all else held constant Source: V. Zuin et al J Water Health 9(4).
14 How should resale be addressed in public policy? In Maputo, CRA publicized support for resale from legal, metered utility connections Little evidence for major regulatory requirements post-legalization Tariff reform important; increasing block tariff penalizes resale
15 Case 2: Point-of-collection disinfection


16 Most households access piped water network ~85% groundwater Intermittent supply Centralized chlorination; end-of-the-line contamination Photo: Yoshika Crider million residents, ~1/3 in slums Photo: Amy Pickering
17 20% WC to sewer Safely emptied Unsafely emptied Leakage Illegally dumped Effectively treated Not effectively treated 2% 98% 2% of fecal sludge safely disposed of fecal sludge unsafely disposed 79% On-site facility Left to overflow or abandoned 1% Open defecation 1% 69% 9% 9% 1% 9% Residential environment Drainage systems Receiving waters Source: Blackett, I., et al The missing link in sanitation service delivery. World Bank Water and Sanitation Program. Slide Bill & Melinda Gates Foundation. Thanks to Jan-Willem Rosenboom.


18 Annual flooding Increased frequency, magnitude expected with climate change Photo: A. Pickering Creative Commons
")


19 Point-of-use (household) water treatment Efficacious when used correctly and consistently Low uptake in Dhaka, even at very low/no cost
20 Per-capita $ cost Centralized disinfection Vended water Filters Boiling HH chlorination Extent of behavior change required Solar Disinfection


21 Passive community-level chlorine doser Low cost Local supply chains No behavior change required Photo: Amy Pickering No moving parts Does not require electricity Pickering, A., et al PLoS ONE 10(3)


22 Sustainability and scalability H 0 : Higher water quality confers competitive advantage in rental housing market $ $ $ $
23 Urban sanitation access in 2015
24 Share of urban population with indicated sanitation service in 1990 and 2015, by World Bank income group 100% Open defecation Other unimproved Shared toilet Private toilet 80% 60% 40% 20% 0% Low income Lower middle income Upper middle income Total (excl. high income) Source: Figure created using Joint Monitoring Programme data, downloaded from wwwinfo.org

25 Share of urban households with improved, private sanitation facility, 2015 Source: Figure created using Joint Monitoring Programme data, downloaded from wwwinfo.org

26 Urban sanitation service challenges Photo: J. Davis Cost, water requirements, and political sensitivities limit scope for sewers Space constraints, lumpy costs, user responsibilities for on-site facilities Low rates of home ownership Low demand for waste treatment

27 Excreta management ~80% of urban wastewater flows released without treatment Public health consequences likely to intensify with city growth, climate change Photo: J. Davis Sustainable Development Goals targeting access and safe management

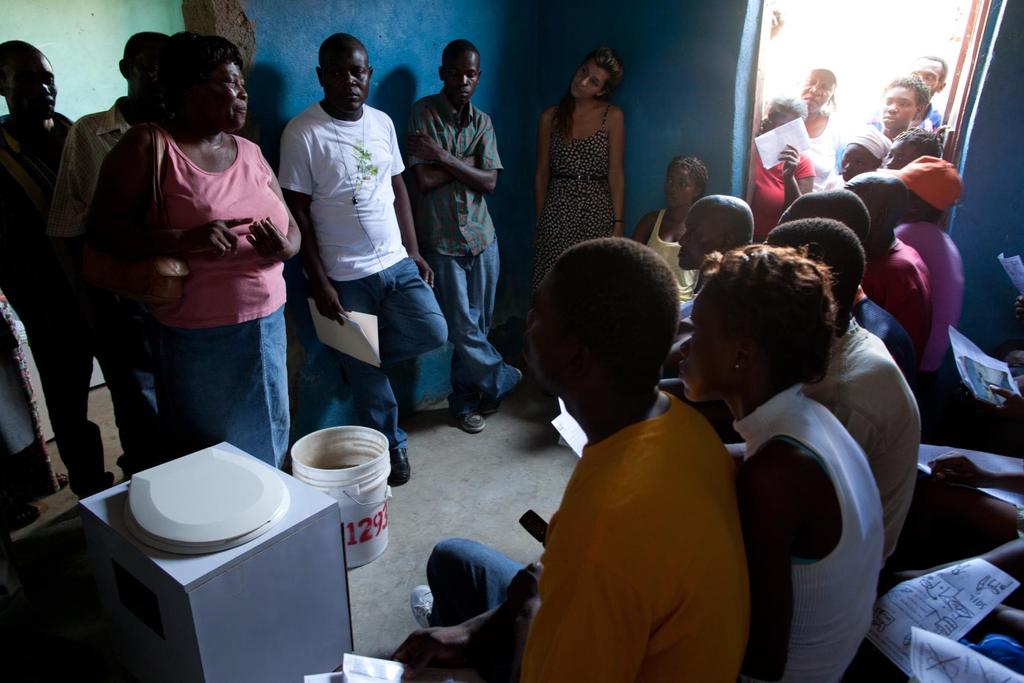
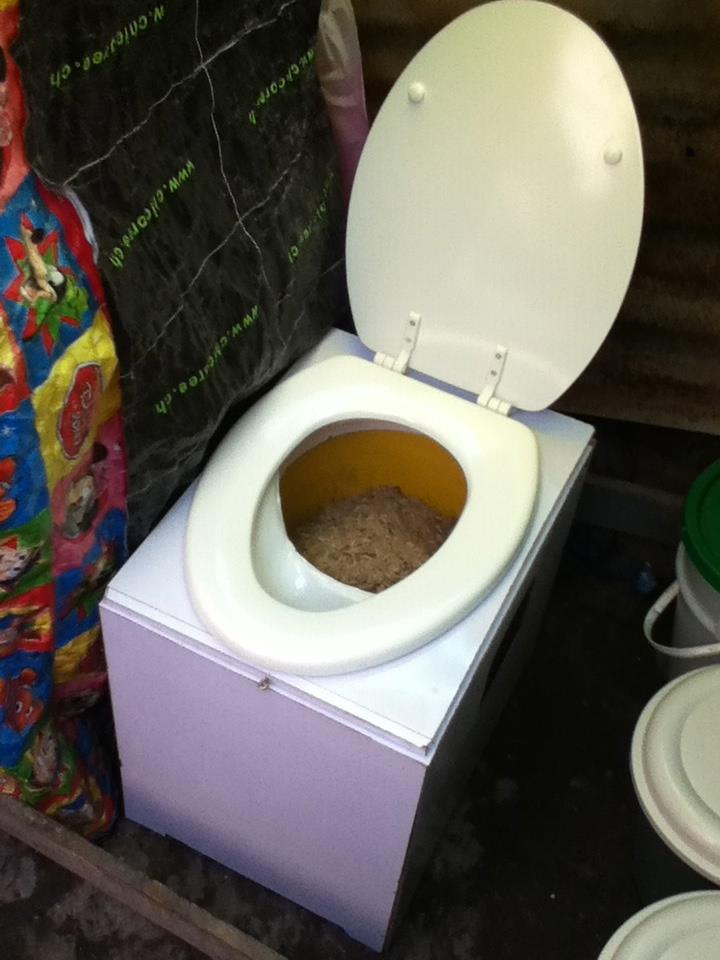
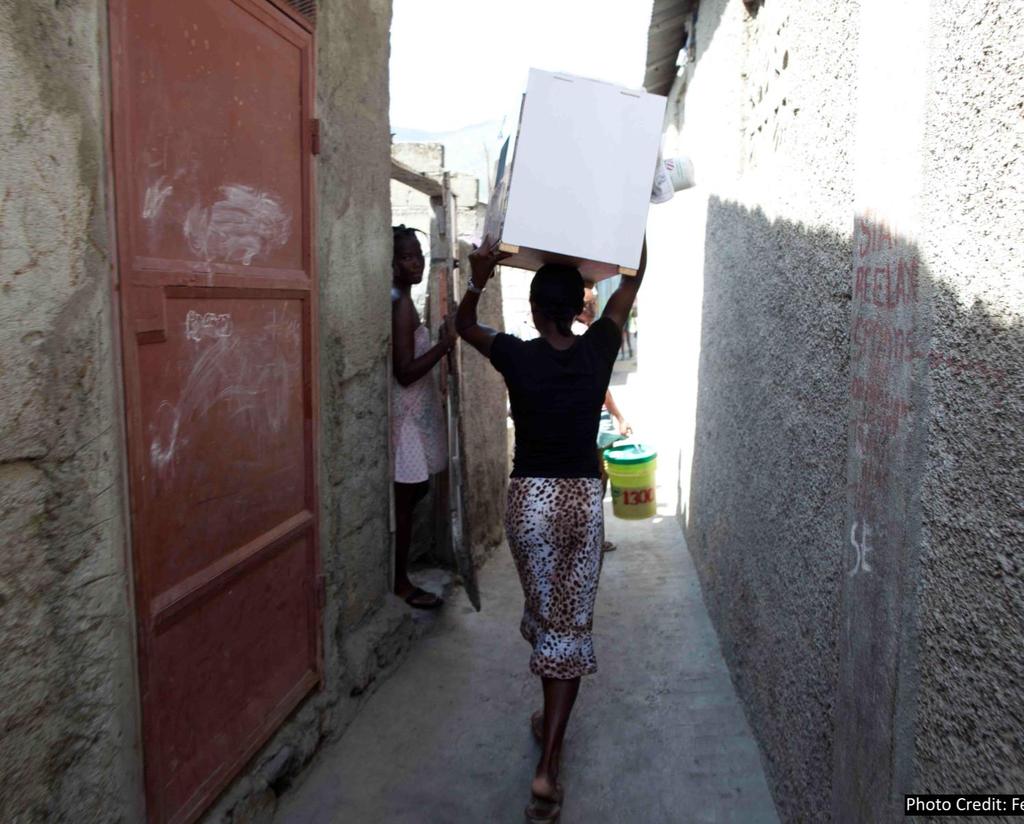
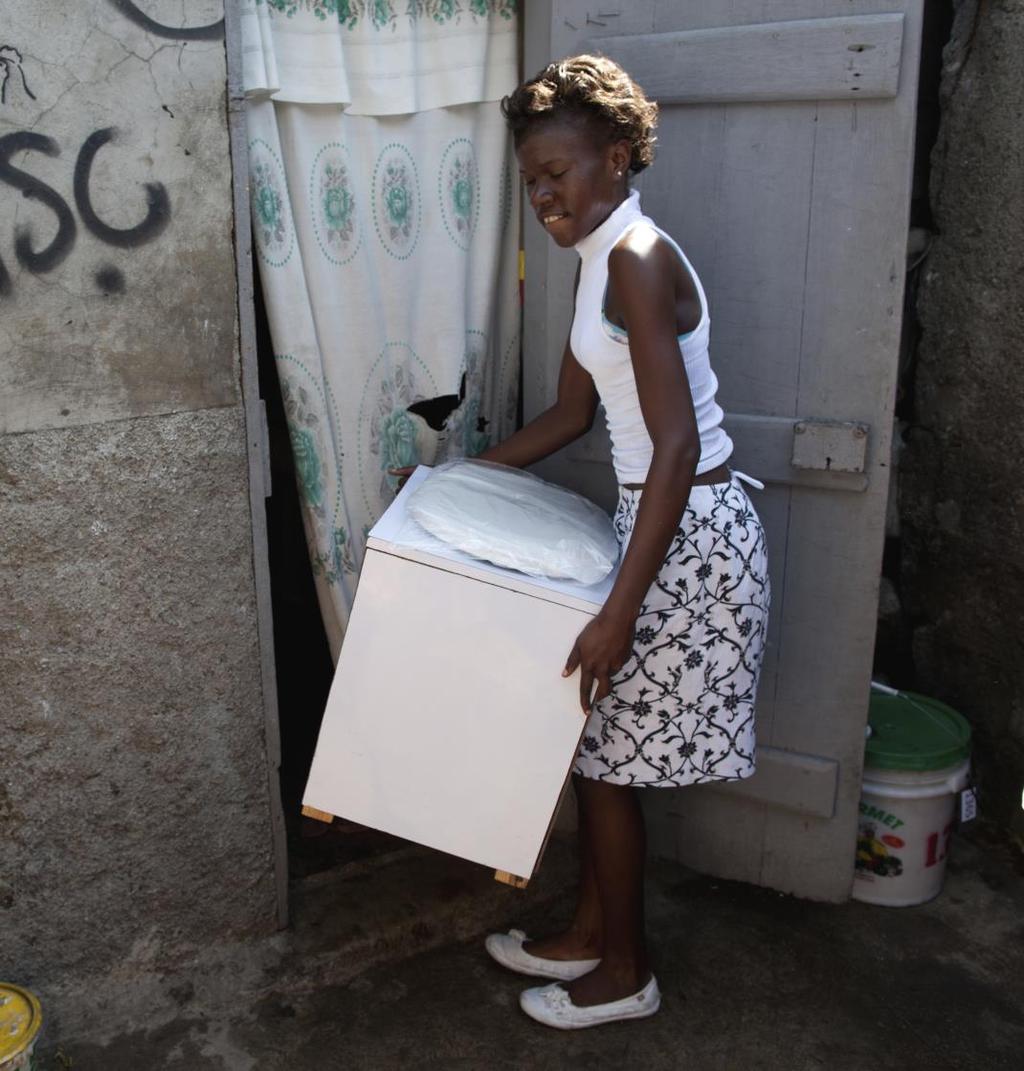
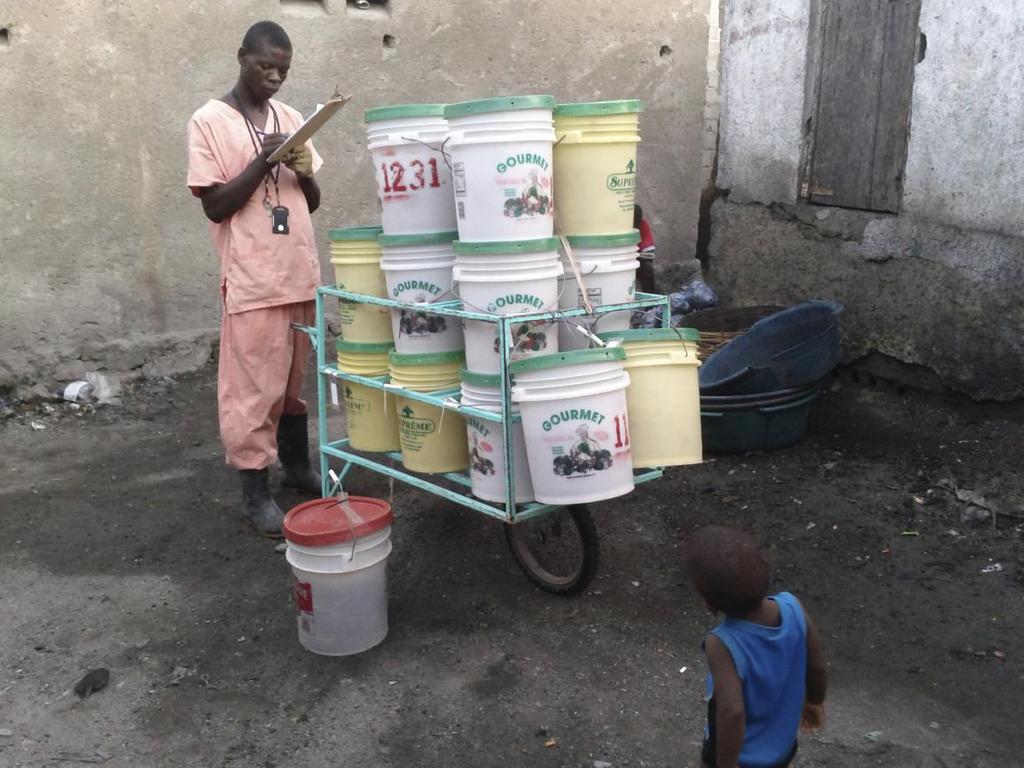
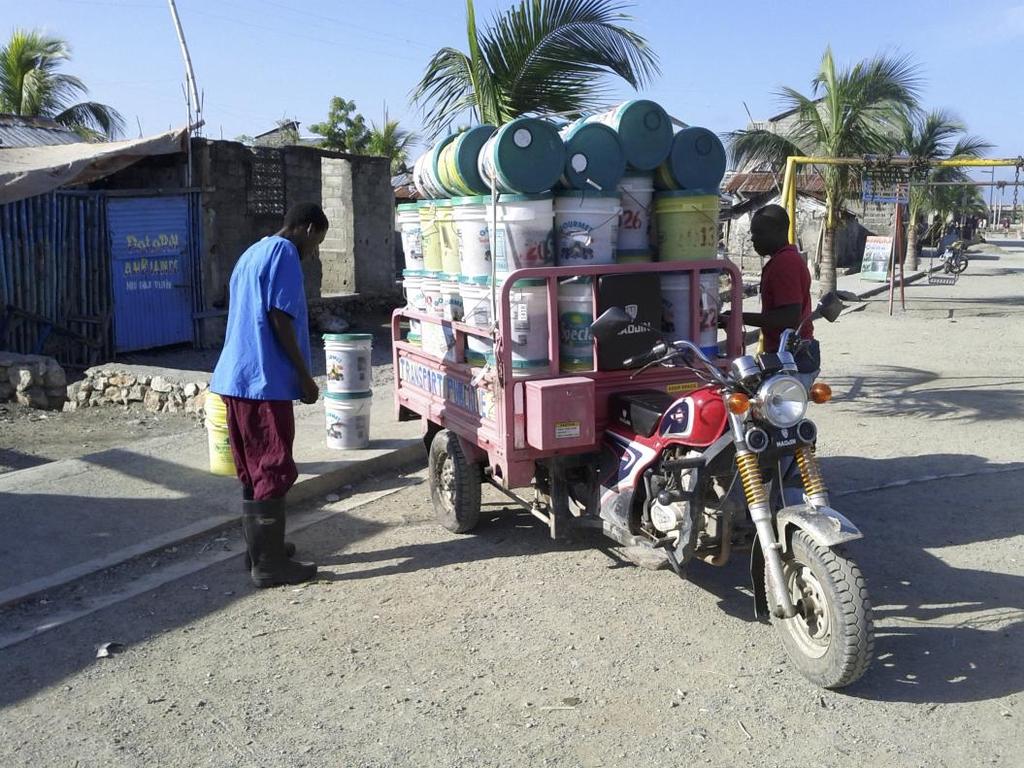
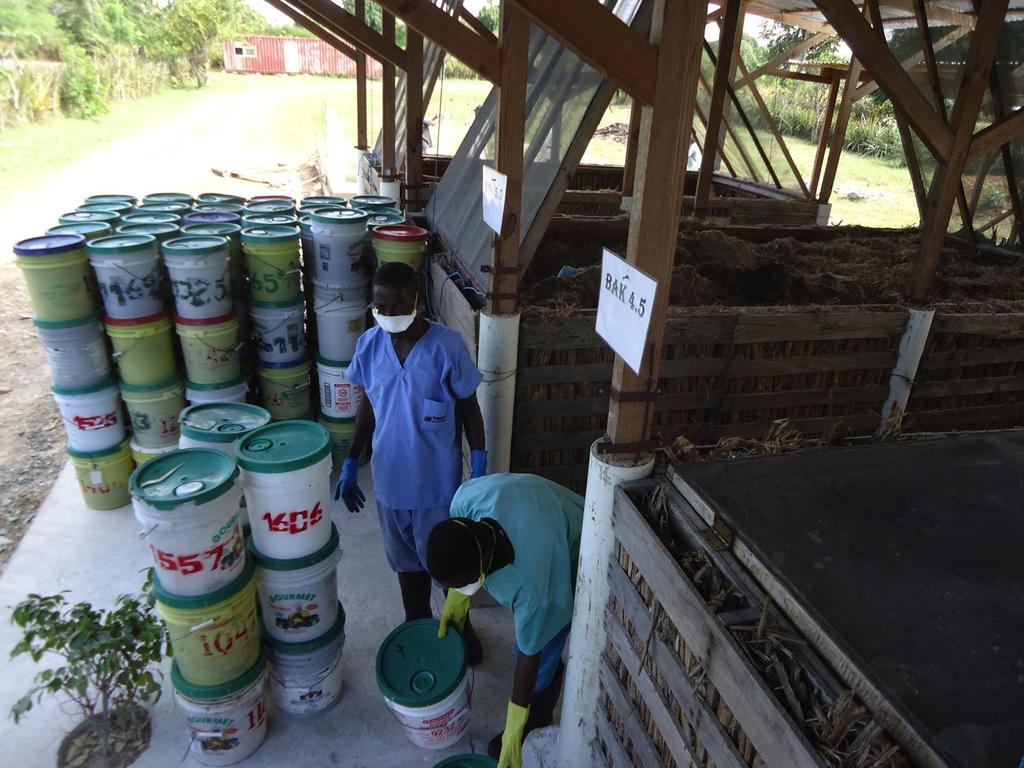
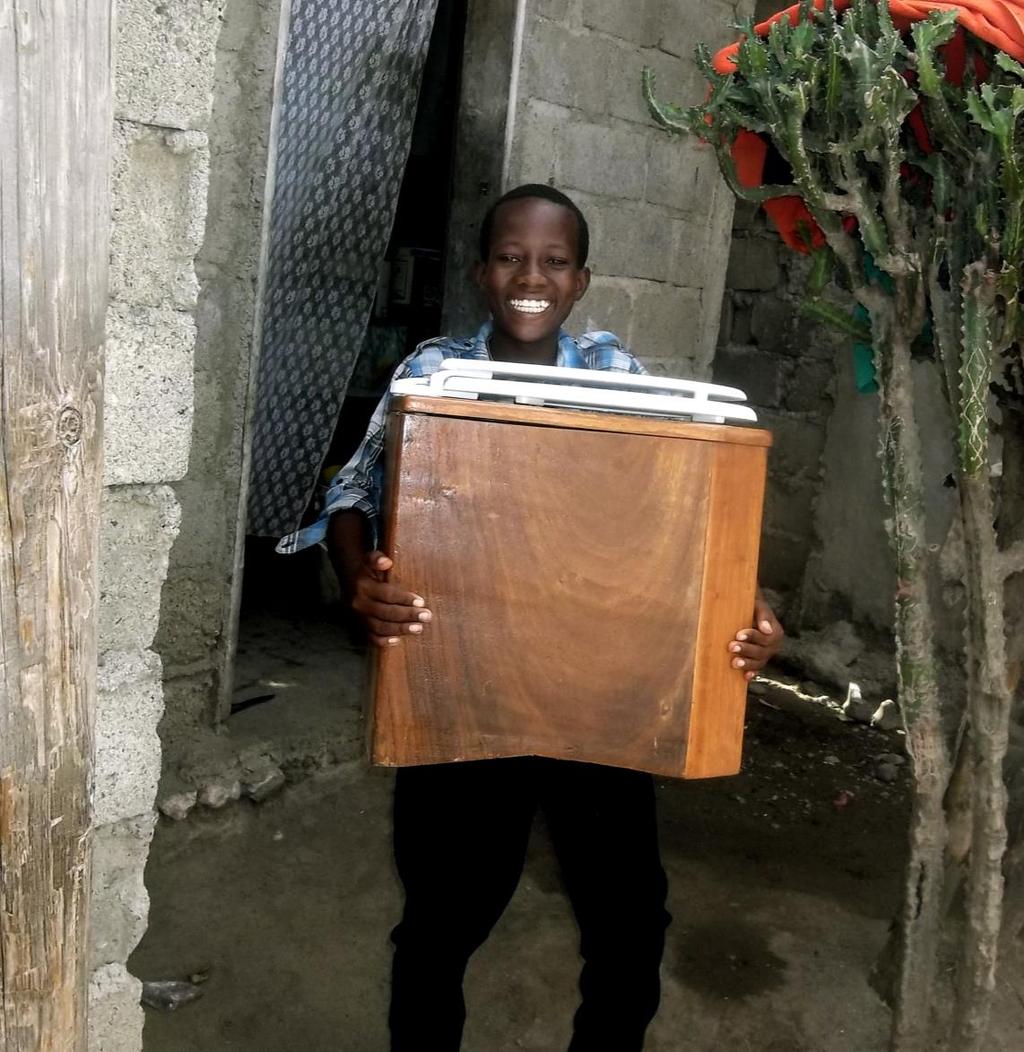
28 The container-based sanitation model Toilet captures waste in removable container Waterless and urine-diverting Additives used for odors, pests Container swapped out when full on regular service schedule Waste transported in containers to processing facility

29 Urban sanitation service challenges Source: J. Davis Cost, water requirements, and political challenges limit scope for sewers Space constraints, lumpy costs, user responsibilities for on-site facilities Low rates of home ownership Low demand for waste treatment
30 Case 3: Container-based sanitation
. K. Russel et al. 2015. Environment and Urbanization 27(2).")
31 Cap Haitien, Haiti Shada Avyasyon Google Earth ~Sea level; frequent flooding No roads No sewers Limited piped water CBS pilot Built on existing public toilet program of NGO SOIL S. Tilmans et al Environment and Urbanization 27(1). K. Russel et al Environment and Urbanization 27(2).

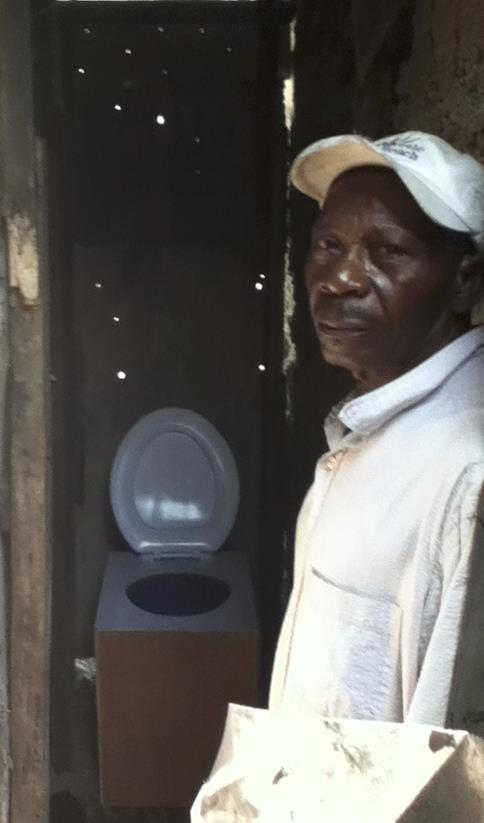
32 Toilet design
33
34
35
36
37
38
39 Results: Safe management of feces Share of feces produced by cohort members that are safely managed, by study phase Treatment (n=126, 125) Comparison 1 (n=115, 110) Baseline Endline Source: S. Tilmans et al Environment and Urbanization 27(1).

40 Verified usage CBS toilets collected ~ 97% of excreta production predicted by mass balance calculations


41 100% Overall, how satisfied are members of your household with your current sanitation situation? Treatment Comparison 1 Comparison 2 (n=126,125) (n=115, 110) (n=131, 122) Dissatisfied 87% 50% 32% Satisfied 39% 35% 26% 36% 0% Baseline Endline Baseline Endline Baseline Endline
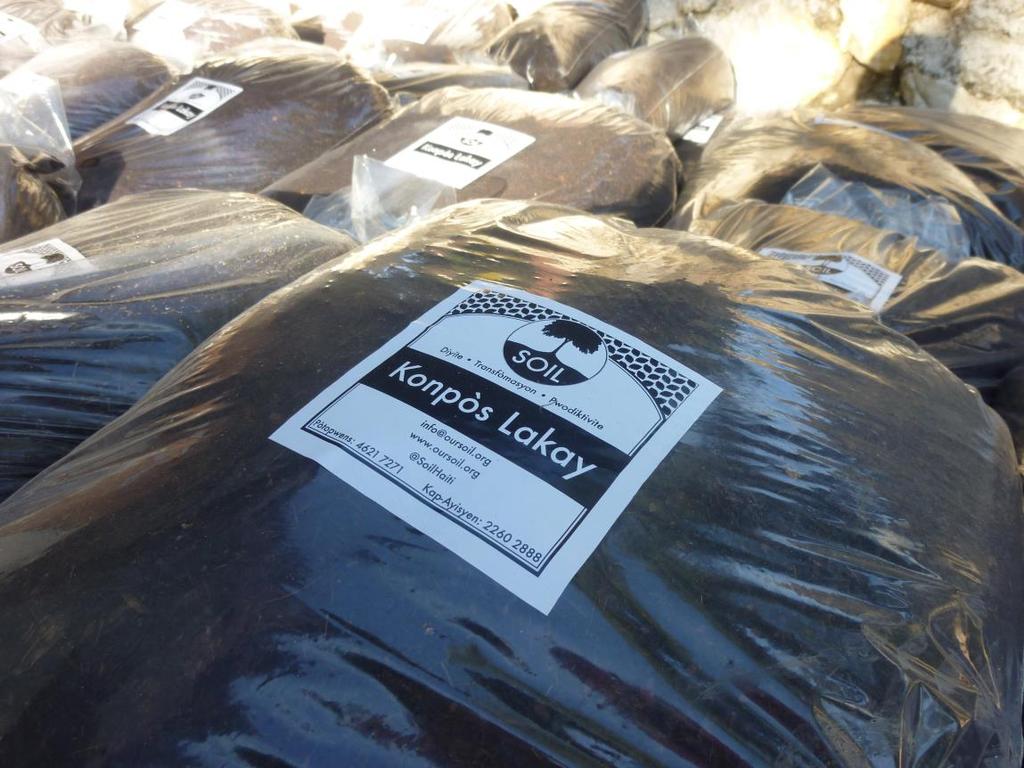
42 EkoLakay service After free pilot, SOIL assumed responsibility for the ongoing CBS service 9 months after the pilot, 90 HHs (71% of treatment cohort) were paying subscribers Now more than 400 HHs, and growing
43 CBS and urban sanitation planning How do costs compare to other options? Who should pay? Waste management Municipal contracting (as with SWM) Is CBS more than a transitional strategy?
44 Summing up Water policy innovations can be effective, but tariff reform is essential Neighborhood-level water quality management may be more effectiveness, less vulnerable when supply is intermittent Container-based sanitation service can represent a high quality option for underserved Diverse roles for government across these innovations
45 Summing up, cont d. Rates of city growth, socioeconomic trends (particularly in SSA) will challenge continued progress in W&S access Climate change will exacerbate fecal sludge management challenges, particularly in coastal zones Increasingly important to address disconnects between W&S planning and water resources policy
46 Thank you Support from our sponsors is gratefully acknowledged. Stanford Woods Institute for the Environment Higgins-Magid fellowship, Stanford University The World Bank The Bill & Melinda Gates Foundation The Stanford Institute for Innovation in Developing Countries US Environmental Protection Agency Urban Sustainability Initiative
47
48 Additional slides
49 Among sub-saharan African urban households with access to improved water source, percentage who rely principally on neighbors with private taps, 2010 Source: Figure created by V. Zuin and C. Stamatakis, using Joint Monitoring Programme country assessment data downloaded from wwwinfo.org

50 Data collection: 6 bairros of inner Maputo chosen purposefully (combined population ~ 106,000) 2 rounds of household surveys o 2010: 1439 households interviewed, including 126 resellers o Choice experiment conducted in 586 households o 2012: 1287 of the original 1439 households re-interviewed, plus 77 new resellers Participant observation in 7 households for 7-10 consecutive days each (4am-1pm) 8 focus group discussions Map by Anne Thebo

51 Adults defecation practices, all comparison households Open defecation Flying toilets Own/neighbor s pit latrine Public toilet

52 Adults defecation practices, treatment households Open defecation Flying toilets Own/neighbor s pit latrine HH CBS toilet Public toilet

 Agree 87% 53% 6% Disagree 46% 65% 0%")
53 Extent of agreement: My household s sanitation situation makes me feel ashamed. 32% 100% 50% Treatment Comparison 1 (n=126,125) (n=115, 110) Agree 87% 53% 6% Disagree 46% 65% 0% Baseline Endline Baseline Endline
54