Zamdela Water Loss Reduction Project A Case Study
|
|
|
- Arline Melton
- 5 years ago
- Views:
Transcription


1 Zamdela Water Loss Reduction Project A Case Study Rivash Panday, Sasol Risk & SHE 9 May 2018

2 Background World Economic Forum s (WEF) Global Risks Report 2018 ranks Water Crisis in the top five risks with the greatest potential impact. Water risks are amplified: In water scarce regions; In companies with large and complex footprints. *Aqueduct Water Risk Atlas World Resources Institute Water risks are largely influenced by location; South Africa is particularly exposed while Europe and North America less so South Africa s water security situation could get rapidly worse as our demand escalates due to growth, urbanization, continued degradation of wetlands, unabated water losses, climate change and delays in implementing new water supply infrastructure. 2


3 Sasol Continues to Endorse the UNGC CEO Water Mandate s Water Stewardship Framework TRANSPARENCY PUBLIC POLICY DIRECT OPERATIONS SIX KEY FOCUS AREAS COMMUNITY ENGAGEMENT WATERSHED/ SUPPLY CHAIN COLLECTIVE ACTION Water stewardship is about responding to a shared challenge, taking collective responsibility and being transparent and accountable 3
4 Yield/Water Requirements (million m3/a) Water to Integrated Vaal River System (IVRS) users is being supplied at increased risk While the water supply to Sasol Operations remains secure the revised water balance of the IVRS shows a growing worsening of the water supply imbalance resulting increasing probability of water restrictions Long Term Water Supply from Integrated Vaal River System Projected System Yield 2018 Projected System Yied Demand Projection : Elevated risk of restrictions being imposed 2022: Desalination of Treated AMD preventing loss of water from the system 2025: Partial supply from Lesotho Highlands Project Reduced Demand Projection due to Reducing Water Losses
5 Risk facing the Integrated Vaal River System (IVRS) Water demand per sector from IVRS (total demand 2900 mil.m 3 /a) 4% Sasol 42% Domestic Secunda Operations: 90 mil.m³/a Sasolburg Operations: 21 mil.m³/a 17% Domestic Losses 41% Irrigation 6% Unlawful Irrigation 13% Eskom 5
6 Business case for Water Partnership Incentives SA stats*(wrp,2017): Non-revenue water is close to 37%. 45% of municipalities have poor/no water loss information and plans. Average water consumption in SA is 238 L/capita/day as apposed to international consumption average of 178 L/c/d. The Department of Water and Sanitation (DWS) Response: Reconciliation Strategy identified meeting 15% savings target in reducing urban water losses by Municipalities as a significant opportunity in bringing the IVRS into balance. Appeal to the private sector to support Government initiatives in water conservation/water demand management (WC/WDM). The DWS included the development of a Water Offsetting Policy (being revised to Water Stewardship framework policy) in the National Water Resource Strategy 2 (NWRS2) as an incentive for Business to participate A company may offset for good corporate stewardship, or may seek a regulatory benefit such as higher-priority access to water in times of drought. (Hastings & Pegram; 2012). Sasol has concluded that water security for our operations can be improved in a more meaningful way by saving water beyond our factory fence line. *WRP, Status Report on Water Losses within the 8 large water supply systems, March

, Sasol USD 225,000 (advanced pressure management) and GiZ USD 70,000 (education and")
 due to pressure reduction (equates to savings of approx. USD 730,000 /annum).")
7 War on Leaks in Metsimaholo Local Municipality A Case for Water Offsets Summary: Sasol was involved in a water conservation/water demand management project for MLM in Sasolburg, in collaboration with Rand Water, GiZ and the DWS. A feasibility study completed in 2012 concluded that the focus of the MLM War on leaks project should be in the Greater Zamdela area. The DWS contributed USD 310,000 (baseline establishment), Sasol USD 225,000 (advanced pressure management) and GiZ USD 70,000 (education and awareness raising). The partnership support contributed to MLM achieving a reduction in potable water demand in the greater Zamdela area by 23% (3.1 ML/day) due to pressure reduction (equates to savings of approx. USD 730,000 /annum). Saving equates to offsetting 5% of Sasolburg Operation s (SO s) raw water demand (60 ML/day) and 72% of SO s potable water demand (4.3 ML/day). 7
8 Scope of Work Baseline Establishment Advanced Pressure Management in Zamdela and Harry Gwala Harry Gwala Reservoir Complex Remedial Works Large Consumer Meter Audits and Meter Installations Large Consumer Meter Monitoring Control Valve Training 8

9 Greater Zamdela Zone Layout Zamdela Harry Gwala Amelia Zamdela Ext 13 Wolvehoek Kragbron Holly Country 9
10 Greater Zamdela KPI Summary AREA NO. PROPERTI ES ESTIMATED POPULATION PER PROPERTY ESTIMATED POPULATION MEASURED DAILY DEMAND (M³/DAY) DEMAND / HOUSEHOLD / MONTH (M³)* LITRE / CAPITA / DAY ** MNF / AVERAGE Avg = 193m³/day Zamdela % Harry Gwala % Zamdela X N/A Amelia N/A Kragbron % Holly Country % Wolvehoek N/A N/A N/A 836 N/A N/A N/A Total *MNF = Minimum Night Flow * Norm Average = m³/month ** Norm Average = l/capita/day 10

11 Pressure Reducing Valve Installation (PRV) in Zamdela & Harry Gwala Zones ZAMDELA PRV S HARRY GWALA PRV 11

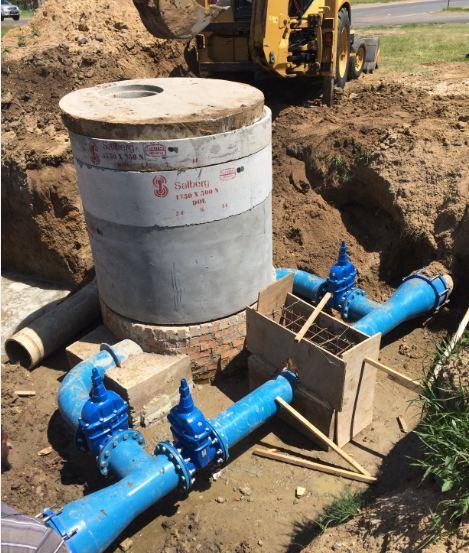
12 Zamdela 3 PRV Construction 12


13 Pressure Controller Installations to Zamdela PRV s 13
14 Results Upstream Vs Downstream Pressure 14

15 Average Daily Demand (ADD) Change for Zamdela & Harry Gwala 23% Savings 15
16 Financial Savings Area Baseline ADD (m 3 /day) Current ADD (m 3 /day) Daily Savings (m 3 /day) Monthly Savings (m 3 /month) Yearly Savings (m 3 /year) Zamdela Harry Gwala Total Using Rand Water Tariff Area Daily Savings (R/day) Monthly Savings (R/month) Yearly Savings (R/year) Zamdela R R R Harry Gwala R R R Total R R R (USD 730,000) 16

17 Zamdela Consumption (1 August May 2018) Daily Demand Prior to pressure Management Daily Demand Post Pressure Management Implementation m3/Day Average = m3/day Volumetric Savings = m3/day = m3/day = m3/year 24% Savings 17

18 Harry Gwala Consumption (1 October May 2018) Daily Demand Prior to Pressure Management Daily Demand Post Pressure Management Implementation 4 241m3/Day Average = m3/day Volumetric Savings = m3/day = 806 m3/day = m3/year 19% Savings 18


19 Large Consumer Meter Audits and Meter Replacements 15 top consumers were audited. Design for new meters. Installation of 11 Consumer (budget constraints) Temporary Logging of meters 19
20 Summary of Large Consumer Logging Results to Date LARGE CONSUMER AVERAGE FLOW RATE (M 3 /H) MINIMUM NIGHT FLOW (M 3 /H) AVERAGE DAILY CONSUMPTION (M 3 /DAY) ESTIMATED LEAKAGE (M 3 /DAY) 1 22,6 13, ,2 2 5,5 4, ,4 3 0, ,3 0 8, , ,3 6 10,5 6, ,4 7 3,4 0 80, ,5 6,4 137,8 138,2 9 1,9 1, ,6 10 2, ,67 0, Total


21 Control Valve Training 21
22 Lessons Learnt in Water Partnership Projects Leak reduction projects should be done on a large enough scale to see savings on bulk purchases. A proper baseline needs to be established in order for losses to be measured. Municipality needs to dedicate resources to the project. Project Management is required for the success of partnership projects. Ensure that partners contribute equally in the process. Education and awareness on water conservation needs to be ongoing and part of the municipalities business model for achieving sustainability of such a project. Proper project governance needs to be administered. Stakeholder management communities and political stakeholders needs to be kept informed. Assess beneficiaries capabilities to ensure sustainability. 22
23 Conclusion and Recommendation The Zamdela water loss reduction project was a success; there are still opportunities for further leakage reduction. Sasol is aligned to a stakeholder approach in mitigating water risks hence we support water partnerships. Municipalities are under immense pressure to meet their WC/WDM targets hence this case study demonstrates a need for incentives for private sector investment beyond the factory fence-line. It is therefore recommended that the DWS enable incentives like Water Offsetting to be recognised in law to attract private sector investment in Public infrastructure. 23