Carbon footprint and biosolids treatment. Dr Bill Barber
|
|
|
- Anna Walsh
- 5 years ago
- Views:
Transcription
1 Carbon footprint and biosolids treatment Dr Bill Barber
2 Carbon footprint Embodied + Operating Indirect + Direct Owned + Influenced manufacture construction vs. operating fossil fuel use vs. process emissions process generated vs. supply chain

3 Indirect Carbon Footprint Depends on power source Wind 0.05 Solar Nuclear 0.05 Biomass Gas 0.20 Coal CO 2 e / kwhr N 2 O, CH 4 Emissions Processing Power (kwhr) Fuel
4 UK Power GHG emission factor [kgco2e/kwhr] Power Emission Factors depend on energy mix
5 Carbon footprint [kg CO2/kWhr] Power Emission Factors depend on energy mix Coal Gas 0 NSW + ACT VIC QLD SA WA TAS NT UK
6 Embodied Carbon Footprint CO 2 e CO 2 e CO 2 e N 2 O, CH 4 Design Power Emissions Fuel Quantity Manufacture Transport
7 Aggregate Sand Soil Asphalt Stone Plaster Concrete Road Soil-cement High strength Pre-cast Bricks Clay Mortar Plasterboard Clay pipe Clay tile Timber Bitumen Cement Glass Hardboard Portland Paper Carbon Steel Insulation Plastics Copper Paint Stainless Steel Aluminium Embodied Carbon Footprint Embodied Carbon Footprint Natural materials Processed Natural Materials Metals complex materials fertilizers


8 Sustainability Carbon Footprint Process Emissions, 17% Transport, 5% Other, 1% Electricity, 77% Biosolids influences all of these parameters UK Water industry > 5 million tonnes CO 2 e Only the power industry emits more carbon footprint Pumping + Aeration
9 Carbon Impacts in Biosolids Carbon Footprint of Biosolids CO 2 e CO 2 e CO 2 e -CO 2 e CO 2 e N 2 O, CH 4 Power Chemicals Emissions Biogas Fuel WwTW Transport
 Land")
10 CO 2 e -CO 2 e -CO 2 e N 2 O, CH 4 Emissions Fertilizer Disp (Sequestration) Land Application

11 CO 2 e -CO 2 e CH 4 Emissions Biogas Landfill
12 391 kg -532 kg CO 2 e +380 kg CO 2 e +168 kg CO 2 e +16 CO 2 e CHP kg CH kg CH kg CH 4 Direct atmospheric emission Direct atmospheric emission 649 kwhr 20 kg 8 kg CH 4 8 kg CH kg 609 kg 589 kg Primary Digestion Open secondary Digestion
13 504 kg -893 kg CO 2 e +189 kg CO 2 e 9 kg CH4 Direct atmospheric emission -704 CO 2 e 1089 kwhr CHP Parasitic Demand 193 kg CH kg CH kg 496 kg Pre-treatment Primary Digestion Secondary Digestion
14 Lime + supp heat Class A liming Raw Drying Raw Incineration Thermal hydrolysis + MAD Series acid phase + MAD TAD-MAD Pre-MAD pasteurisation Digested Drying Advanced Digested Inc Digested Incineration ATAD Carbon Footprint Carbon Footprint of Class A Biosolids treatment No digestion With digestion
15 Carbon footprint breakdown Liming Composting TH + MAD BH + MAD TAD + MAD ATAD Key: ( Biosolids Transport); ( Land Emissions); ( Chemicals); ( Dewatering); ( Transport Other); ( Power); ( Gas); ( Process Emissions); ( Down Time)
16 Carbon footprint breakdown Liq Past + MAD Raw Drying MAD + Drying Lime + S H Raw Incineration MAD + Incineration Key: ( Biosolids Transport); ( Land Emissions); ( Chemicals); ( Dewatering); ( Transport Other); ( Power); ( Gas); ( Process Emissions); ( Down Time)
17 Australia - Australian government reduction target of 5% of 2000 levels by million t/co 2 e year - Currently being measured and reported - Carbon tax will come in force 1 July 2012 Will cover 500 worst polluters (approx 60% of the emissions) This will include all large water companies $ 23 AUD/t carbon dioxide Rising 2.5% per year - Will become trade scheme 1 July 2015


18
19
20
21 Carbon footprint [t CO2/yr] Carbon Footprint of Australian Water Industry 700, ,000 SCOPE 2 SCOPE 1 500, , , , ,000 0 Hunter Water Melbourne Water SA Water SunWater Sydney Water Water Corp. Data plot using Australian Government NGER 2009/10 data
22 Carbon footprint [t CO2/yr] Carbon Footprint of Australian Water Industry 700, ,000 SCOPE 2 SCOPE 1 500, , , , ,000 0 Hunter Water Melbourne Water SA Water SunWater Sydney Water Water Corp. Data plot using Australian Government NGER 2009/10 data

23 Carbon Footprint of Australian Water Industry

24 Normalised (to UK) Carbon Footprint of Australian Water Industry
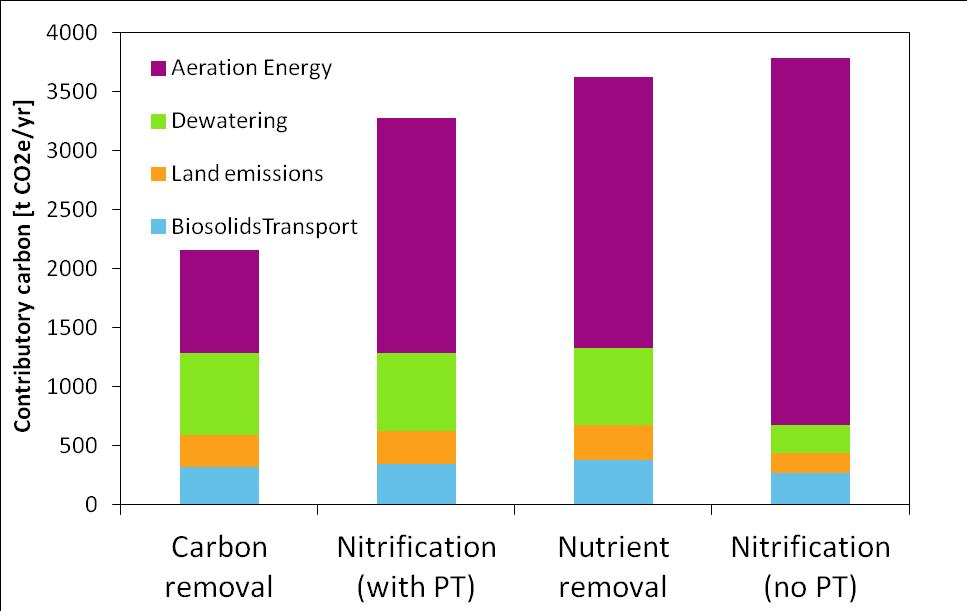
25 Tightening Legislation
26 Tightening Legislation
27 Tightening Legislation
28 Case Study New advanced digestion facility
29 Option 1 New raw sludge incineration plant Main Inputs/Outputs impacting Carbon Dewatering Conveying Contributing Sites Power Chemicals Sludge Transport Pre-drying Air provision Waste Heat Recovery Dust Removal Acid gas clean-up Scrubber Effluent Treatment Incinerator Plant Waste Sludge Flue gas Ash Transport Power Chemicals Start-up Gas Combustion Air Power Generation
30 Option 2 Advanced Digestion with existing incineration Dewatering Conveying Re-liquification Thickening Thermal Hydrolysis Anaerobic Digestion Liquor Treatment Dewatering Conveying CHP Plant Pre-drying Air provision Waste Heat Recovery Dust Removal Acid gas clean-up Scrubber Effluent Treatment Contributing Sites Sludge Transport Digestion Centre Liquid Sludge Pumping Existing Incinerator Plant Waste Sludge Flue gas Ash Transport Power Chemicals Power Chemicals Natural Gas Renewable Energy Generation Sludge cake Export Power Chemicals Start-up Gas Combustion Air Power Generation
31 Weight of Construction material Weight of Construction Materials Steel Concrete Raw Incinerator Advanced Digestion
32 Embodied Carbon (CO 2 e) Embodied Carbon Total Concrete (CO 2 e) Total Steel (CO 2 e) Raw Incinerator Advanced Digestion
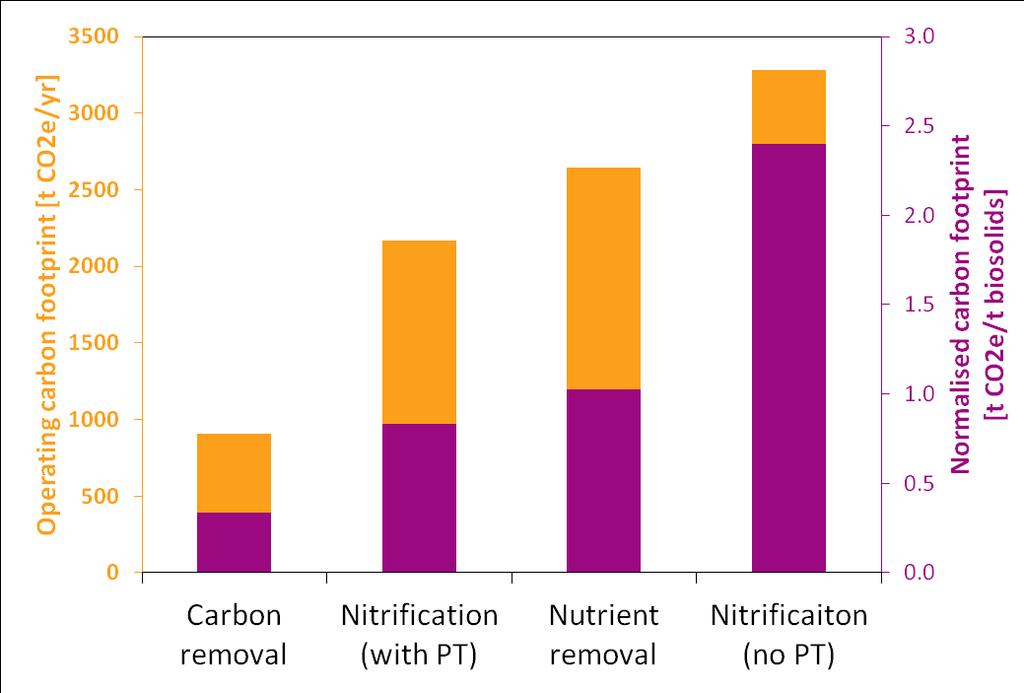
33 Breakdown of carbon footprint Factors Contributing to Increasing Operating Carbon Dewatering at DH Land Application Additional pumping to SG Incinerator chemicals Incinerator power demand Ash transport Downtime Incinerator emissions Sludge transport Dewatering (inc liquor treatment) Raw Incinerator Advanced Digestion
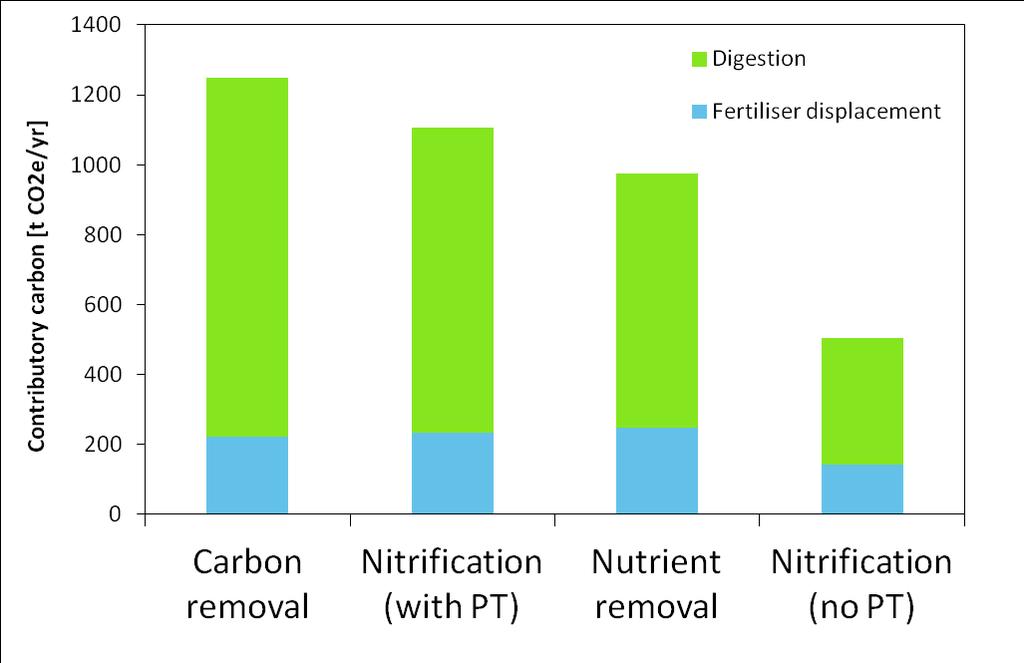
34 Operating Carbon footprint Impacts and benefits on operating carbon Total Total Benefits Biogas production Energy generation at incinerator Fertilizer displacement Carbon sequestration Raw Incinerator Advanced Digestion
35 Cumulative Carbon Footprint Whole Life Carbon Impact Liming Raw Incineration AD AD delay 5 AD Delay Years in operation
36 Summary - Everything we do has a carbon impact and that also includes biosolids production and processing - Carbon footprint is made up of: embodied and operating Indirect and Direct Owned and influenced emissions - Choice of technology has large impact on carbon footprint of biosolids options - Anaerobic digestion is very influential Renewable energy generation Reduces biosolids for further processing Can improve dewatering so reducing transport
37 Thank You

38 52,230 Power 8,640 37,370 Polymer Power Gas Manufacture 6,220 7,360 CO 2 e CO 2 e CO 2 e CO 2 e 44,870 (Raw Incineration) Dewatering Fuel Transport Chemicals Manufacture Emissions N 2 O Downtime CH 4 + N 2 O Incineration Ash Transport Avoided Power Power Generation
 1 Existing)")


39 29,300 29,300 (Option 1 (Option Existing) 1 Existing) Polymer Power Manufacture Power N 2 O 40,200 6,500 5,600 11,300 16,800 10,850 CO 2 e Dewatering CO 2 e CO 2 Lime Manufacture Lime Addition CO 2 e Fuel Transport CH 4 CO 2 e GHG Emissions Field Application CO 2 e Avoided Power Fertiliser Manufacture
40 Advanced Digestion Carbon Footprint 1. Impact on existing digestion plant 2. Impact at existing incineration facility processing additional sludge 3. Recycling of additional Class A biosolids 4. Additional transport (double-handling)
41 SBAP Impact at Davyhulme Impact on existing digestion plant 652 (Existing Digestion) 26,282 (New Digestion) = 26,934 (Reduction at Existing Digestion)
42 Additional land application emissions 10,778 (Contributory land application) 1,969 (Beneficial land application) = 8,809 (Additional land application)
43 Impact on existing incineration plant 10,778 (Contributory incineration) 1,969 (Beneficial incineration) = 8,809 (Additional Incineration)
44 Total for Advanced Digestion Option = -26,934 (Reduction at existing digestion) 3,829 (Additional land application) 8,809 (Additional Incineration) 11,408 (Additional Transport) 2,888 (Advanced Digestion Total)