Pajaro River Watershed Flood Prevention Authority. Phase 3 and 4a. Pajaro River Watershed Study
|
|
|
- Adrian McDowell
- 5 years ago
- Views:
Transcription
1 Pajaro River Watershed Flood Prevention Authority Phase 3 and 4a FEBRUARY 2005
2 Funding for this project has been provided in full or in part through a contract with the SWRCB pursuant to the Costa-Machado Water Act of 2000 (Proposition 13) and any amendments thereto for the implementation of California s Nonpoint Source Pollution Control and Watershed Program. The contents of this document do not necessarily reflect views and policies of the SWRCB, nor does mention of trade names or commercial products constitute endorsement or recommendation for use. i
3 Table of Contents Chapter 1: Introduction... Purpose of the : Phase 3 and 4a Study Background Legal Authority Watershed Setting Phase 1 Summary Phase 2 Summary Chapter 2: Characterizing the Soap Lake Floodplain... Soap Lake Location Soap Lake Attenuation Importance of Soap Lake Extent of Soap Lake Soap Lake Hydraulic Model Soap Lake Floodplain Model Facilities Impacted by Flooding Chapter 3: Preserving the Soap Lake Floodplain... Project Description Zoning and General Plan Land Use Designation Changes Floodplain Management Ordinance Incentive Programs Purchase/Leaseback Flood Conservation Easement Mitigation Banking Eminent Domain Purchase/Condemn Recommended Soap Lake Effect Preservation Method Project Benefits Project Extent Floodplain Preservation Impacts on Resource Areas Land Acquisition Needs Assessment Implementation Strategy Cost Chapter 4: Conclusions and Recommendations... Floodplain Delineation Methods to Preserve the Soap Lake Floodplain CEQA Documentation Land Acquisition Needs Stakeholder Consensus Coordination with Other Studies Chapter 5: Looking Forward... Soap Lake Floodplain Preservation Project Implementation Plan Sediment Modeling Flood forecasting Fisheries Study of San Felipe Lake Appendices... ii
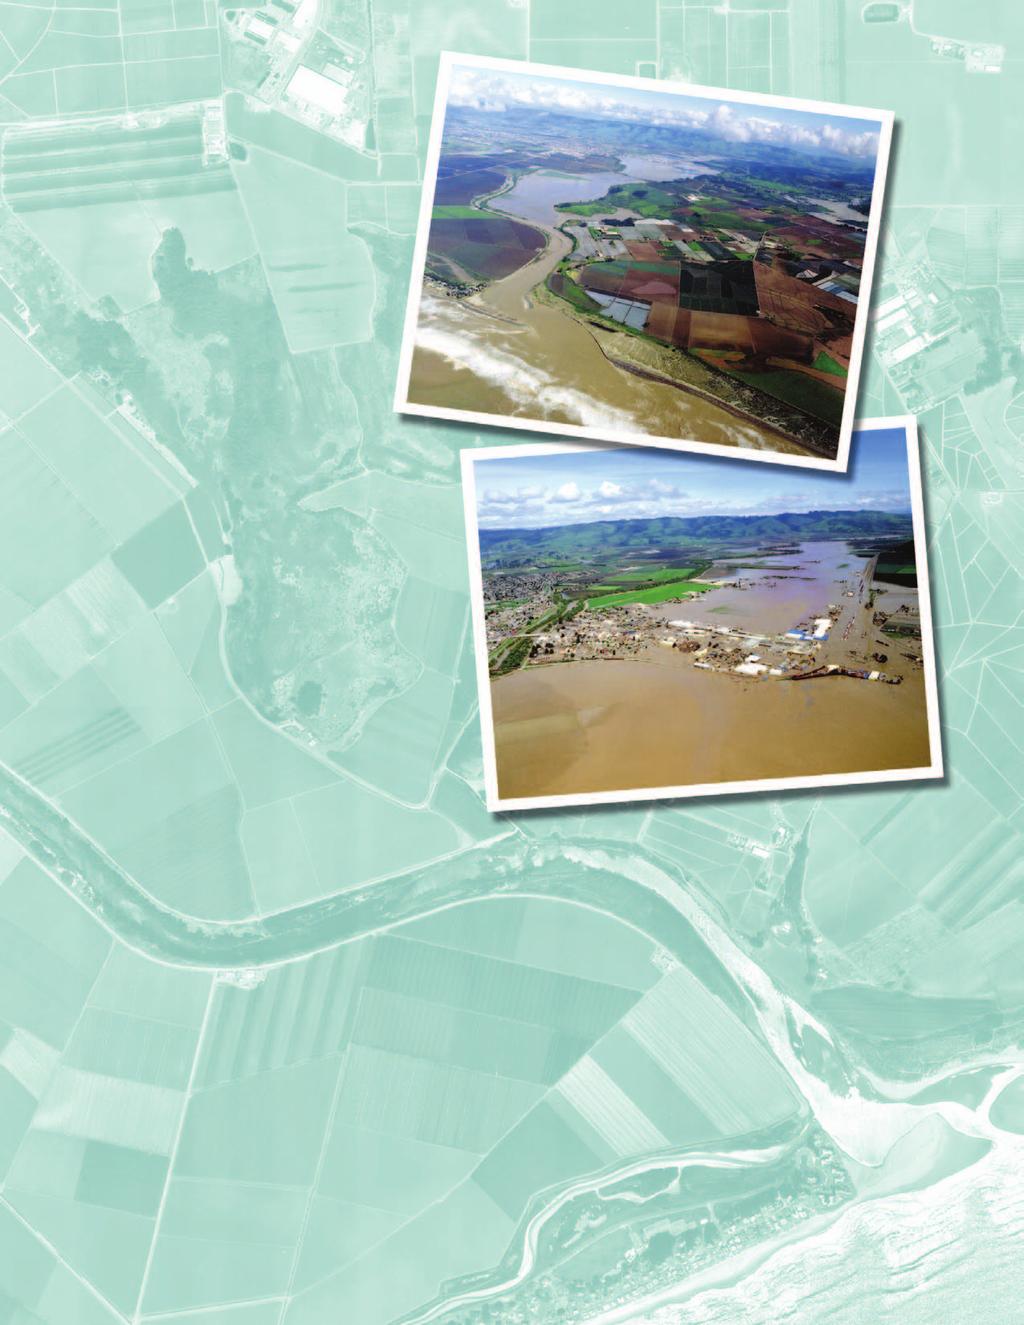
4 Index of Figures Figure 1-1: Relief map of the watershed showing major highways, cities, dams, and rivers Figure 1-2: Major land use categories and locations within the watershed Figure 1-3: 100-Year Return Period Peak Design Flows on the Lower Pajaro River Figure 1-4: Matrix of flood control options considered in Phase Figure 1-5: Matrix of conditions that create beneficial flood control pairings for the Pajaro River Watershed Figure 1-6: Combinations of projects yield 100-year protection Figure 2-1: Soap Lake approximate floodplain area Figure 2-2: Example of attenuation impact on hydrograph Figure 2-3: Model results of 100-year event flow at Chittenden Gage with and without Soap Lake attenuation Figure 2-4: Effects of attenuation in Soap Lake on peak flows at Chittenden Gage Figure 2-5: Example of cross section across Llagas Creek Figure 2-6: Schematic of reaches used in the Soap Lake hydraulic model Figure 2-7: Examples of received data Figure 2-8: Flow diagram for the HEC-RAS modeling and floodplain delineation process Figure 2-9: Examples of stream centerline delineation Figure 2-10: Cross section locations of the Soap Lake hydraulic model Figure 2-11: Bank and overbank delineation based on aerial photography Figure 2-12: Schematic of water surface without and with a levee Figure 2-13: Bridge section schematic Figure 2-14: Ineffective flow area in the Soap Lake modeled area Figure 2-15: Logic test for flooding Figure 2-16: Representation of the effect of a one dimension assumption on model results Figure 2-17: Demonstration of defining the assumed backwater impact area based on limit of flooding at the top cross section Figure 2-18: Example of data gap caused by cross section placement Figure 2-19: Soap Lake 2-year floodplain Figure 2-20: Soap Lake 10-year floodplain Figure 2-21: Soap Lake 25-year floodplain Figure 2-22: Soap Lake 50-year floodplain Figure 2-23: Soap Lake 100-year floodplain Figure 2-24: Facilities impacted by a 100-year flood event in the Soap Lake area Figure 2-25: High-speed rail options between San Jose and the central valley Figure 3-1: Land acquisitions and conservation easements within the Soap Lake floodplain iii
5 Index of Tables Table 1-1: Hydraulic Model Peak Flows Based on General Plan Buildout Conditions Table 2-1: Peak flows at Chittenden stream gage with and without Soap Lake attenuation Table 2-2: Time of tributary peak flows Table 2-3: HEC-RAS flows and downstream water surface elevations Table 2-4: Mannings n roughness coefficients used in the Soap Lake hydraulic model Table 2-5: Peak water surface elevations at Soap Lake outlet Table 2-6: 100-Year Flood Impacts in the Soap Lake area Table 3-1: Purchase costs of 100-year floodplain Table 4-1: Floodplain areas of the 2-, 10-, 25-, 50-, and 100-year flood events iv
6 Glossary Alternative Package A group of individual flood protection projects that were combined to provide 100-year flood protection Attenuate To reduce peak magnitude through storage Authority The Pajaro River Watershed Flood Prevention Authority Bypass A parallel channel or pipeline that carries flow that exceeds the existing channel capacity CEQA (California Environmental Quality Act) CA state law that requires the protection of the environment cfs (Cubic Feet per Second) A measure of discharge where 1 cfs is approximately 450 gallons per minute Corps The Army Corps of Engineers Detention Temporary storage ESA (Endangered Species Act) - The purpose of this act is to provide protections for the endangered and threatened species and the ecosystems upon which they depend FEMA (Federal Emergency Management Agency) A federal organization created to prepare for, respond to, recover from, and mitigate against disasters Flood easement A purchase of the permission to use a land area for flooding Floodplain The area of land that has historically been covered by water during floods GIS (Geographic Information System) A spatial database Groundwater recharge The addition of water to subterranean water bodies Hydraulic roughness The resistance to flow due to channel or overland characteristics Hydrograph A location specific graph showing the change in flow rate with respect to time. Hydrologic condition A measure of factors that impact surface runoff; used to determine the curve number Impervious surface A surface not allowing the absorption or seepage of water into the ground Levee An embankment constructed to prevent flooding outside of a confined space Peak discharge The greatest discharge value at a point during a water year Pour point Geographic location through which water from a watershed or subwatershed flows v
7 PRWS () A study authorized by the Authority to determine the causes of flooding and identify methods of flood protection Return period The average amount of time between occurrences of an event of a given size Riparian Related to or situated on the bank of a river or other body of water Stage The height of a water surface above a given elevation Subwatershed A portion of a watershed Thalweg The lowest flowline within a channel TM (Technical Memorandum) Documents cataloging technical decisions, methods, and results in support of the PRWS Watershed The area upstream of a point through which all surface water within that area flows Water year The period from October 1 through September 30 vi
8 Appendices
9 APPENDICES The following pages contain the technical memoranda prepared to support and document the work performed for Phase 3 and 4a of the. The TMs include: TM 3.3 and 3.4: Project Hydraulics and Operating Strategy; Floodplain Boundaries Mapping TM 3.5: Impacted Facilities Assessment TM 3.6: Land Acquisition Needs Assessment TM 3.7: Cost Estimating Value of Soap Lake App
10