Water clarity. Key Message
|
|
|
- Paula Wheeler
- 5 years ago
- Views:
Transcription
 for water clarity has been achieved in the Kattegat and The Sound.")
1 Water clarity Key Message HELCOM core indicator report July 2018 This core indicator evaluates water clarity based on average Secchi depth during summer (June September) during the assessment period In open sea areas, good status (Secchi depth above a defined threshold value, which reflects good conditions) for water clarity has been achieved in the Kattegat and The Sound. In coastal waters, good status has only been achieved in some water bodies along the coast of Sweden, Poland, Latvia and Estonia (Key message figure 1). Key message figure 1. Status assessment evaluation of the indicator Water clarity'. The assessment is carried out using Scale 4 HELCOM assessment units (defined in the HELCOM Monitoring and Assessment Strategy Annex 4). Click here to access interactive maps at the HELCOM Map and Data Service: Water clarity. HELCOM 1
2 Since the 1970s there has been a general decrease in summer-time water clarity in all Baltic Sea areas, though during the last two decades, water clarity has increased in some southern Baltic Sea sub-basins (Great Belt and Kattegat, Results figure 3). The confidence in the presented water clarity status evaluation are based on the availability of monitoring data and the confidence of the target-setting procedures. In the Quark, Åland Sea, Gulf of Finland and Gulf of Riga open sea assessment units the indicator confidence was determined to be low. High confidence was found in the southwestern parts of the Baltic (Kattegat, Great Belt, The Sound, Kiel Bay, Bay of Mecklenburg, Arkona Basin, Bornholm Basin and the Eastern Gotland Basin). In the remaining open-sea basins, the indicator confidence was moderate. The indicator is applicable in the waters of all countries bordering the Baltic Sea. Relevance of the core indicator Eutrophication is caused by excessive inputs of nutrients (nitrogen and phosphorus) resulting from various human activities. High concentrations of nutrients and their ratios form the preconditions for algal blooms, reduced water clarity and increased oxygen consumption. Water clarity is affected by the light attenuation of the media, caused mainly by water itself, planktonic organisms - especially phytoplankton, suspended particulate matter, colored dissolved organic matter (CDOM), and inorganic compounds. Phytoplankton is the dominating optical constituent in most oceanic waters, whereas in the Baltic Sea, especially the northeastern parts, a considerable share of the attenuation is caused by CDOM, which is to a large extent not related to increased nutrient loading. Though water clarity responds strongly to eutrophication, it may in some areas express a non-eutrophication-related signal. Long-term nutrient data are key parameters for quantifying the effects of anthropogenic activities and evaluating the success of measures undertaken. Policy relevance of the core indicator BSAP Segment and Objectives MSFD Descriptors and Criteria Primary link Baltic Sea unaffected by eutrophication D5 Human-induced eutrophication - D5C4 The photic limit (transparency) of the water column is not reduced, due to increases in suspended algae, to a level that indicates adverse effects of nutrient enrichment Secondary link Other relevant legislation: EU Water Framework Directive HELCOM 2
3 Cite this indicator HELCOM (2018). Water clarity. HELCOM core indicator report. Online. [Date Viewed], [Web link]. ISSN Water clarity HELCOM core indicator 2018 (pdf) Download full indicator report HELCOM 3
 was below 1.5, with the highest value (1.")
4 Results and Confidence Current status of water clarity In open sea areas, good status (Secchi depth above defined threshold value, which reflects good conditions) for water clarity was achieved in the Kattegat and The Sound. For all open sea areas, the eutrophication ratio (ER) was below 1.5, with the highest value (1.38) being observed in Northern Baltic Proper (Results figure 1 and Results table1). In general the average water clarity has remained relatively constant during the assessment period (Results figure 2). Results figure 1. Status of the water clarity indicator, presented as eutrophication ratio (ER). ER shows the present water clarity condition in relation to the threshold value, increasing along with increasing eutrophication. The threshold value for ER 1.00, with values below this threshold achieving good status. HELCOM 4
5 HELCOM 5
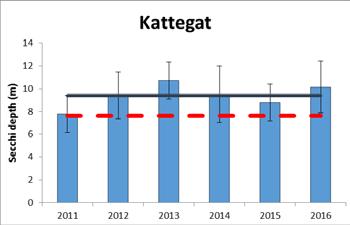
6 Results figure 2. Summer (June-September) Secchi depth (black line; average for years ) and threshold values (red broken line). Results table 1. Threshold values, present concentration (as average ), eutrophication ratio (ER) and status of Secchi depth in the open-sea basins. ER is a quantitative value for the level of eutrophication, calculated as the ratio between the threshold value and the present concentration when ER > 1, good status has not been reached. Sub-basin Target (m) Average (m) Eutrophication ratio, ER Status (fail/achieve threshold value) Kattegat achieve Great Belt fail The Sound achieve Kiel Bay fail Bay of Mecklenburg fail Arkona Basin fail Bornholm Basin fail Gdansk Basin fail Eastern Gotland Basin fail Western Gotland Basin fail Gulf of Riga fail Northern Baltic Proper fail Gulf of Finland fail Aland Sea fail Bothnian Sea fail The Quark fail Bothnian Bay fail In coastal waters, good status was only achieved in some water bodies along the coast of Sweden and Finland, especially in coastal assessment units located in Bothnian Bay, The Quark and Bothnian Sea, and in certain coastal assessment units in Poland, Latvia and Estonia. For certain coastal areas, measured water clarity was far from reaching threshold values (ER > 2.0, Results figure 1 and Results table 2). Results table 2. Results for national coastal Secchi depth (water clarity) indicators by coastal WFD water type/water body. The table includes information on the assessment unit (CODE, defined in the HELCOM Monitoring and Assessment Strategy Annex 4), assessment period (start year and end year), average concentration during assessment period, threshold values, units, and Eutrophication Ratio (ER). The ER is coloured red or green to denote if the status evaluation has been failed or achieved, respectively. Data are generally reported for the summer season, though some marked with * are annual. - indicates only status provided and not raw result value. Code Period Average Threshold value Units Eutrophication ratio (ER) EST m 1.29 EST m 1.01 EST m 0.99 EST m 0.99 EST m 1.18 EST m 1.26 EST m 1.88 HELCOM 6
7 EST m 2.88 EST m 3.06 EST m 1.20 EST m 1.12 EST m 1.61 EST m 2.52 EST m 1.11 EST m 2.61 EST m 1.46 FIN m 1.89 FIN m 1.45 FIN m 1.59 FIN m 1.26 FIN m 1.84 FIN m 1.05 FIN m 0.88 FIN m 1.27 FIN m 0.98 FIN m 1.14 FIN m 0.97 FIN m 2.31 FIN m 1.61 FIN m 1.40 GER m 2.22 GER m 2.22 GER m 1.89 GER m 1.67 GER m 3.59 GER m 1.80 GER m 8.50 GER m 5.67 GER m GER m 2.52 GER m 4.15 GER m 6.10 GER m 4.59 GER m GER m 1.62 GER m 3.27 GER m 3.40 GER m 2.80 GER m 3.66 GER m 2.88 GER m 2.12 GER m 1.41 GER m 1.41 GER m 1.44 GER m 4.24 GER m 8.71 GER m 8.71 GER m 1.44 GER m 1.53 GER m 1.24 GER m 1.31 GER m 2.12 GER m 1.24 GER m 1.47 HELCOM 7
8 GER m 1.47 GER m 1.64 GER m 2.06 GER m 1.29 GER m 1.29 GER m 1.38 GER m 1.50 GER m 3.00 GER m 2.90 GER m 4.69 GER m 6.78 LAT m 1.18 LAT m 1.00 LAT m 1.38 LAT m 1.29 LAT m 1.15 LIT m 1.32 LIT m 1.67 POL-001* m 1.73 POL-002* m 1.73 POL-003* m 1.25 POL-004* m 0.81 POL m 1.07 POL m 0.96 POL m 2.37 POL m 1.58 POL m 2.21 POL m 1.22 POL m 0.78 POL m 2.15 POL m 1.70 POL m 1.44 POL m 1.27 POL m 1.40 POL m 1.17 POL m 1.65 POL m 1.65 SWE m 1.09 SWE m 1.15 SWE m 1.16 SWE m 1.25 SWE m 1.24 SWE m 1.03 SWE m 1.19 SWE m 1.42 SWE m 1.27 SWE m 1.36 SWE m 1.49 SWE m 2.55 SWE m 1.27 SWE m 1.25 SWE m 1.23 SWE m 1.36 SWE m 0.69 SWE m 0.79 SWE m 0.79 SWE m 0.79 HELCOM 8
9 SWE m 0.60 SWE m 0.62 SWE m 1.22 SWE m 1.20 Long-term trends The long-term series for water clarity show a steadily deteriorating situation over several decades, most profoundly in the north-eastern sub-basins (Fleming-Lehtinen & Laamanen 2012). In more recent years, however, the decrease in water clarity has levelled off across most of the Baltic Sea (Results figure 3). Over the period from , water clarity has decreased significantly in four of the 17 sub-basins (Arkona Basin, Bornholm Basin, Western Gotland Basin and Northern Baltic Proper). In the Kattegat and the Great Belt, the water clarity has increased (Results figure 3). HELCOM 9
10 HELCOM 10
11 Results figure 3. Temporal development of water clarity (measured as Secchi depth in summer) in open sea assessment units from 1970s to Dashed lines show the five-year moving averages and error bars the standard deviations. Green lines indicate the indicator threshold values. Significance of the trends was assessed with Mann-Kendall tests for the period from Significant (p<0.05) improving trends are indicated with blue and deteriorating trends with orange data points. Confidence of the indicator status evaluation The confidence in the indicator status evaluation is based on the spatial and temporal coverage of data as well as the accuracy of the target-setting protocol. This was not adequate in all sub-basins an dresulted in lowered confidence in the assessment. The Quark, Åland Sea, Gulf of Finland and Gulf of Riga assessments were determined to be of low confidence. High confidence was found in the Southwestern assessment units HELCOM 11

12 (Kattegat, Great Belt, The Sound, Kiel Bay, Bay of Mecklenburg, Arkona Basin, Bornholm Basin and the Eastern Gotland Basin). In the remaining open-sea basins, the indicator confidence was moderate. Results figure 4. Indicator confidence, determined by combining information on data availability and the accuracy of the target-setting protocol. Low indicator confidence calls for increase in monitoring. The indicator confidence was estimated through confidence scoring of the target (ET-Score) and the indicator data (ES-Score). The ET-Score was rated based on the uncertainty of the target setting procedure. The ES- Score is based on the number as well as spatial and temporal coverage of the observations for the assessment period To estimate the overall indicator confidence, the ET- and ES-Scores were combined. See Andersen et al. (2010) and Fleming-Lehtinen et al. (2015) for further details. HELCOM 12
. Thresholds and Status evaluation figure 1.")
13 Thresholds and Status evaluation Status evaluation is measured in relation to scientifically based and commonly agreed sub-basin specific threshold values, which define the values that should not be exceeded (Thresholds and Status evaluation figure 1). Thresholds and Status evaluation figure 1. Schematic representation of the threshold value applied in the water clarity core indicator, the threshold values are assessment unit specific (see Good environmental status table 1). These indicator threshold values were based on the results obtained in the TARGREV project (HELCOM 2013a), taking also advantage of the work carried out during the EUTRO PRO process (HELCOM 2009) and national work for EU WFD. The final threshold values were set through an expert evaluation process done by the intersessional activity on development of core eutrophication indicators (HELCOM CORE EUTRO) and the targets were adopted by the HELCOM Heads of Delegations 39/2012. Thresholds and Status evaluation table 1. Assessment unit specific threshold values for the water clarity core indicator. HELCOM_ID Assessment unit (open sea) Threshold value (Secchi depth, m) SEA-001 Kattegat 7.6 SEA-002 Great Belt 8.5 SEA-003 The Sound 8.2 SEA-004 Kiel Bay 7.4 SEA-005 Bay of Mecklenburg 7.1 SEA-006 Arkona Sea 7.2 SEA-007 Bornholm Sea 7.1 SEA-008 Eastern Gotland Basin 7.6 SEA-009 Gdansk Basin 6.5 SEA-010 Western Gotland Basin 8.4 SEA-011 Northern Baltic Proper 7.1 SEA-012 Gulf of Riga 5.0 SEA-013 Gulf of Finland 5.5 SEA-014 Åland Sea 6.9 SEA-015 Bothnian Sea 6.8 SEA-016 The Quark 6.0 SEA-017 Bothnian Bay 5.8 HELCOM 13
14 Assessment Protocol The open-sea core indicators are updated using data reported by Contracting Parties to the HELCOM COMBINE database hosted by ICES, using the algorithms developed for the eutrophication assessment work flow. The values are achieved using indicators specifications shown in Assessment protocol table 1 (see HELCOM Eutrophication assessment manual). Assessment protocol table 1. Specifications of the core indicator Secchi depth. Indicator Response to eutrophication Parameters Data source Secchi depth (Water clarity) negative Secchi depth (m) Monitoring data provided by the HELCOM Contracting Parties, and kept in the HELCOM COMBINE database, hosted by ICES ( Assessment period June 2011 September 2016 Assessment season Summer = June + July + August + September Depth - Removing outliers Removing close observations Indicator level Eutrophication ratio (ER) Status confidence (ES-Score) No outliers removed No close observations removed average of yearly average values ER = ET / ES LOW (=0%), if no more than 5 annual status observations are found during one or more years. MODERATE (=50%), if more than 5 but no more than 15 status observations are found per year. HIGH (=100%), if more than 15 spatially non-biased [to be specified what this means ] status observations are found each year. Indicator target confidence (ET- Score) Indicator confidence (I-Score) HIGH Confidence (%) = average of ES-Score and ET-Score The indicators within the criteria were weighted according to their relevance for eutrophication in each subbasin. The weight was evenly distributed within the criterion, unless there was a justification to do otherwise. For Secchi depth, the weight was assigned according to the available information on the light absorption by colored dissolved organic matter (CDOM) and the relationship between CDOM absorption and chlorophyll a HELCOM 14
15 concentration in the sub-basin (Assessment protocol table 2), respectively. The weight was distributed equally (no weight assigned) for most sub-basins but in the Gulf of Finland and especially in the Gulf of Bothnia Secchi depth received a reduced weight due to increased absorption of light by CDOM. This makes Secchi depth a less reliable indicator of eutrophication, and therefore it received a smaller weight in those basins. Assessment protocol table 2. Secchi depth and chlorophyll a have been weighted according to available information on CDOM absorption of light and the relationship between CDOM light absorption and chlorophyll a (chl-a) concentration in the sub-basin. Basin Reduction in Secchi weight Justification (Ylöstalo et al. in prep., Stedmon et al. 2000) Kattegat - The Sound - Low CDOM absorption 1 Great Belt - Low CDOM absorption 1 Little Belt - Low CDOM absorption 1 Kiel Bay - Assumed similar as in the Belts and Arkona Sea Mecklenburg Bight - Assumed similar as in the Belts and Arkona Sea Arkona Sea - Low CDOM absorption 2, medium in relation to chl-a Bornholm Sea - Low CDOM absorption 2, medium in relation to chl-a Eastern Gotland Basin - Assumed similar as in the Northern Baltic Proper Western Gotland Basin - Low CDOM absorption 2, medium in relation to chl-a Gdansk Basin - No info Northern Baltic Proper - Medium CDOM absorption 2, medium in relation to chl-a Gulf of Finland -20 % High CDOM absorption 2, medium in relation to chl-a Gulf of Riga -40 % Extremely high CDOM absorption 2, high in relation to chl-a. Åland Sea - Interpolated between Bothnian Sea and Northern Baltic Proper Bothnian Sea -20 % Medium CDOM absorption 2, medium-high in relation to chl-a Quark -40 % Interpolated between Bothnian Bay and Bothnian Sea Bothnian Bay -60 % High CDOM absorption 2, extremely high in relation to chl-a. Assessment units The core indicator is applicable in the 17 open sea assessment units (from one nautical mile from the baseline seawards). The assessment units are defined in the HELCOM Monitoring and Assessment Strategy Annex 4. HELCOM 15
16 Relevance of the Indicator Eutrophication assessment The status of eutrophication is assessed using several core indicators. Each indicator focuses on one important aspect of the complex issue. In addition to providing an indicator-based evaluation of the water clarity, this indicator also contributes to the overall eutrophication assessment along with the other eutrophication core indicators. Policy relevance Eutrophication is one of the four thematic segments of the HELCOM Baltic Sea Action Plan (BSAP) with the strategic goal of having a Baltic Sea unaffected by eutrophication (HELCOM 2007). Eutrophication is defined in the BSAP as a condition in an aquatic ecosystem where high nutrient concentrations stimulate the growth of algae which leads to imbalanced functioning of the system. The goal for eutrophication is broken down into five ecological objectives, of which one is clear water, possible to assess using Secchi depth as a proxy. The EU Marine Strategy Framework Directive (Anonymous 2008) requires that human-induced eutrophication is minimized, especially adverse effects thereof, such as losses in biodiversity, ecosystem degradation, harmful algal blooms and oxygen deficiency in bottom waters (Descriptor 5). Photic limit (transparency) of the water column is listed as a criteria element for assessing the secondary criterion D5C4 The photic limit (transparency) of the water column is not reduced, due to increases in suspended algae, to a level that indicates adverse effects of nutrient enrichment. The EU Water Framework Directive (Anonymous 2000) requires good ecological status in the European coastal waters. Good ecological status is defined in Annex V of the Water Framework Directive, in terms of the quality of the biological community, the hydromorphological characteristics and the chemical characteristics, including water clarity. Role of water clarity in the ecosystem Water clarity is affected mainly by the concentration of particles causing scattering of light, therefore enhancing light absorption. Light absorption is mainly due to water itself, chromophoric dissolved organic matter (CDOM), detritus and to phytoplankton. The concentration of detritus particles and CDOM is the result of organic matter accumulated over time due to high nutrient loadings and in particular in the eastern Baltic Sea to a high natural contribution of humic materials from rivers draining peat land and forested areas. Eutrophication increases light attenuation, through nutrients increasing the amount of living organisms. Turbid waters affect the ecosystem through decreases in light availability below the surface. HELCOM 16

17 Relevance figure 1. Simplified conceptual model for water clarity in the Baltic Sea. Human pressures linked to the indicator General MSFD Annex III, Table 2a Strong link Weak link Substances, litter and energy - Input of nutrients diffuse sources, point sources, atmospheric deposition Substances, litter and energy - Input of organic matter diffuse sources and point sources Water clarity in the Baltic Sea is affected mainly by the concentration of phytoplankton and chromophorous dissolved organic matter (CDOM). Of these, phytoplankton concentration is directly linked to anthropogenic pressures, ie. nutrient increase. HELCOM 17
18 Monitoring Requirements Monitoring methodology Monitoring of water clarity in the Contracting Parties of HELCOM is described on a general level in the HELCOM Monitoring Manual in the sub-programme Water column hydrological characteristics. Monitoring guidelines specifying the sampling strategy are adopted and published. Current monitoring The monitoring activities relevant to the indicator that are currently carried out by HELCOM Contracting Parties are described in the HELCOM Monitoring Manual Sub-programme sub-programme Water column hydrological characteristics: Monitoring concepts table. Description of optimal monitoring The regional monitoring effort is considered sufficient to support the indicator evaluation. HELCOM 18
19 Data and updating Access and use The data and resulting data products (tables, figures and maps) available on the indicator web page can be used freely given that the source is cited. The indicator should be cited as following: HELCOM (2018) Water clarity. HELCOM core indicator report. Online. [Date Viewed], [Web link]. ISSN Result: Water Clarity Metadata Data source: The average for was estimated using monitoring data provided by the HELCOM Contracting Parties, and kept in the HELCOM COMBINE database, hosted by ICES ( Nominated members of HELCOM STATE & CONSERVATION group were given the opportunity to review the data, and to supply any missing monitoring observations, in order to achieve a complete dataset. Description of data: The data includes secchi depth measurements explained in the HELCOM COMBINE manual. Geographical coverage: The observations are distributed in the sub-basins according to the HELCOM COMBINE programme, added occasionally with data from research cruises. Temporal coverage: The raw data includes observations throughout the year, during the assessment period Data aggregation: The averages for each sub-basin were produced as an inter-annual summer (June September) estimates. HELCOM 19
20 Contributors and references Contributors Vivi Fleming-Lehtinen 1, Joni Kaitaranta 2, Laura Hoikkala 2, participants of HELCOM IN-Eutrophication 1 Finnish Environment Institute, SYKE, Finland 2 Secretariat of the Helsinki Commission Archive This version of the HELCOM core indicator report was published in July 2018: Water clarity HELCOM core indicator 2018 (pdf) Older versions of the core indicator report are available: HOLAS II component - Core indicator report web-based version July 2017 (pdf) References Andersen, J. H., Murray, C., Kaartokallio, H., Axe, P. & Molvær, J. (2010). Confidence rating of eutrophication status classification. Marine Pollution Bulletin 60, Fleming-Lehtinen, V., Andersen, J. H., Carstensen, J., Łysiak-Pastuszak, E., Murray, C., Pyhälä, M. & Laamanen, M. (2015). Recent developments in assessment methodology reveal that the Baltic Sea eutrophication problem is expanding. Ecological Indicators 48, Fleming, Vivi & Laamanen, Maria. (2012). Long-term changes in Secchi depth and the role of phytoplankton in explaining light attenuation in the Baltic Sea. Estuarine, Coastal and Shelf Science. s /j.ecss HELCOM (2013) Approaches and methods for eutrophication target setting in the Baltic Sea region. Balt. Sea Environ. Proc. No. 133 Stedmon, C.A., Markager, S., Kaas, H., Optical properties and signatures of chromophoric dissolved organic matter (CDOM) in Danish coastal waters. Estuarine, Coastal and Shelf Science 51, Ylöstalo, P., Seppälä, J., Kaitala, S., in prep. Spatial and seasonal variations in CDOM absorption and its relation to dissolved organic carbon and nitrogen concentrations in the Baltic Sea. HELCOM core indicator report, ISSN HELCOM 20