The Water-Energy-Land (WEL) nexus and the analysis of Land issues
|
|
|
- Chastity Fisher
- 5 years ago
- Views:
Transcription
1 The Water-Energy-Land (WEL) nexus and the analysis of Land issues Karl Harmsen Sr Fellow, ZEF, University of Bonn Consultant, DIE, Bonn European Report on Development (ERD) 2012 Consultation on Governance of Natural Resources with a focus on Land NH Hotel, Maastricht, May 2011
2 1. WEL nexus: definition
3 NEXUS 1. a connection or link 2. a connected group or series energy land water
4 2. WEL nexus: = Water = Energy = Land
5 2.1. Water Hydrological cycle Land/water atmosphere interactions Water quality Soil water balance and water-use efficiencies Soil & water conservation Water harvesting & small reservoirs

6 West African Science Service Center on Climate and Adapted Land Use < 1% liquid water
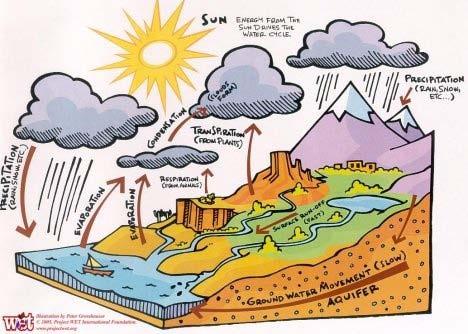
7
8 Function of Temperature Precipitation Evapo- Transpiration vegetation Soil Storage Surface Water Recharge Groundwater Recharge [Harmsen, 2007]
9 2.2. Energy Global energy balance - land use/land cover (albedo) - greenhouse gases, - aerosols, dust, bush fires, wind erosion - evapo-transpiration Use of fossil and renewable energy Production of sources of renewable energy
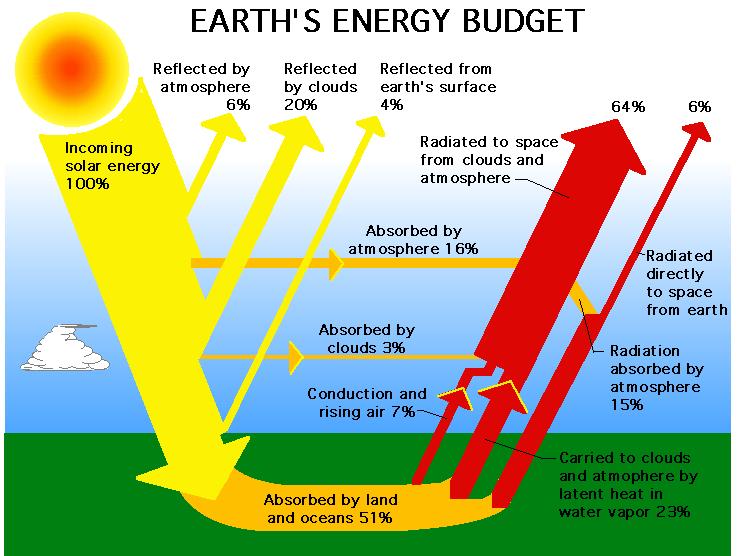
10 78% 55%
11 Energy balance The difference between the total incoming and total outgoing energy in the climate system. If this balance is positive, warming occurs; if it is negative, cooling occurs. Averaged over the globe and over long time periods, this balance must be zero. Because the climate system derives virtually all its energy from the Sun, zero balance implies that, globally, the amount of incoming solar radiation on average must be equal to the sum of the outgoing reflected solar radiation and the outgoing thermal infrared radiation emitted by the climate system. A perturbation of this global radiation balance, be it anthropogenic or natural, is called radiative forcing.
 of the forcing and the assessed level of scientific understanding (LOSU).")
12 Global average radiative forcing (RF) in 2005 (best estimates and 5 to 95% uncertainty ranges) with respect to 1750 for CO2, CH4, N2O and other important agents and mechanisms, together with the typical geographical extent (spatial scale) of the forcing and the assessed level of scientific understanding (LOSU). Source: IPCC, 2007.
 plotted against the centre of the decade and relative to the corresponding average for the 1901-1950.")
13 Comparison of observed changes in surface temperature with results simulated by climate models using either natural or both natural and anthropogenic forcings. Decadal averages of observations are shown for the period (black line) plotted against the centre of the decade and relative to the corresponding average for the Lines are dashed where spatial coverage is less than 50%. Blue shaded bands show the 5 to 95% range for 19 simulations from five climate models using only the natural forcings due to solar activity and volcanoes. Red shaded bands show the 5 to 95% range for 58 simulations from 14 climate models using both natural and anthropogenic forcings (IPCC, 2007)
 and June to August (right).")
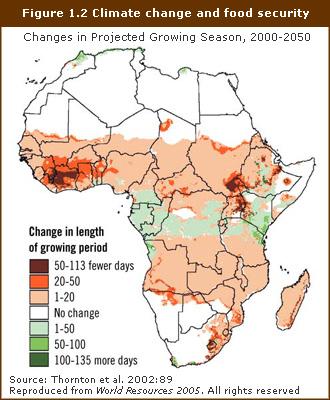
14 Relative changes in precipitation (in percent) for the period , relative to Values are multi-model averages based on the SRES A1B scenario for December to February (left) and June to August (right). White areas are where less than 66% of the models agree in the sign of the change and stippled areas are where more than 90% of the models agree in the sign of the change (IPCC, 2007)

15 AFRICA December to February

16 AFRICA June to August
17 interactions and links: 1. Land & water (the surface of the Earth) play a role in the energy balance [climate change] 2. Interventions at the surface of the Earth may use energy, both renewable and fossil (e.g., solar energy for photosynthesis cq crop growth, fossil fuel for transport and machinery) 3. Interventions at the surface of the Earth may generate sources of renewable energy (e.g., food and feed, fuelwood, organic waste, oil crops)
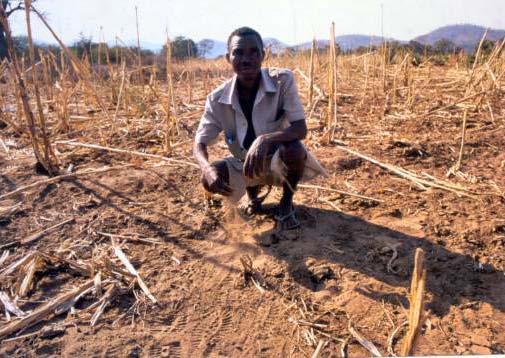
18 2.3. Land Land productivity & degradation loss of vegetation water & wind erosion deterioration of the physical, chemical & biological soil quality soil & water conservation carbon and nitrogen cycles
19
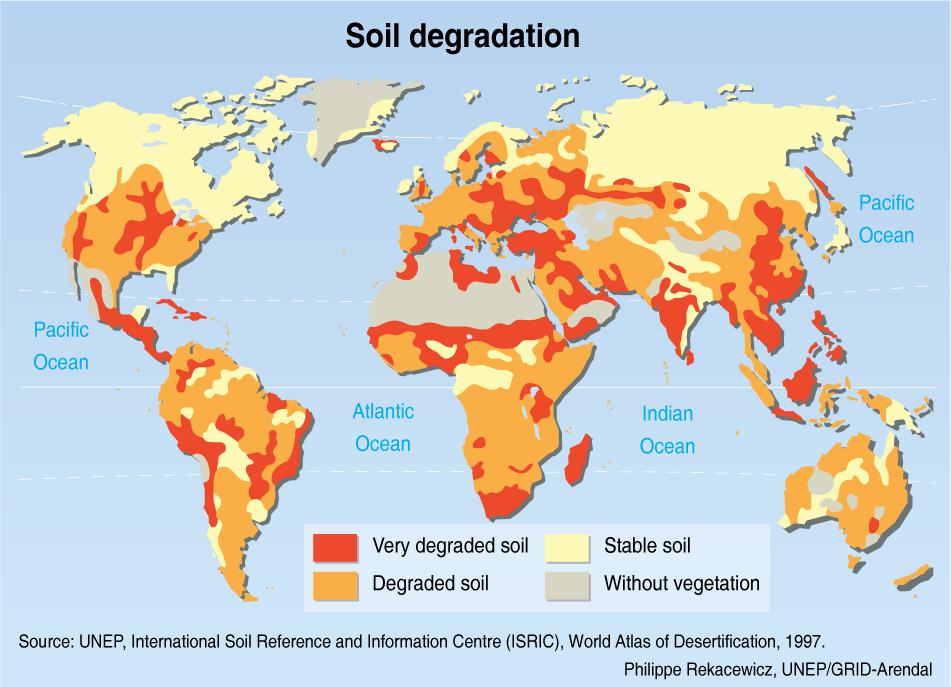
20 Degraded soils. Soil degradation is a key global environmental indicator. Very degraded soils are found especially in semi-arid areas (Sub-Saharan Africa, Chile), areas with high population pressure (China, Mexico, India) and regions undergoing deforestation (Indonesia). Degraded soils reduce the possibilities for agriculture, increasing the expansion of drylands/deserts and hightening the risk for erosion. This map presents the state of global soil degradation, from the GLASOD study in 1997 (UNEP-GRID Arendal website)
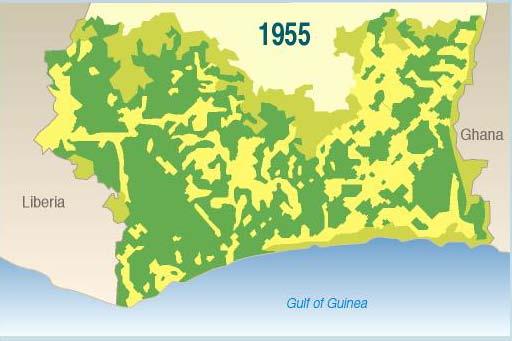
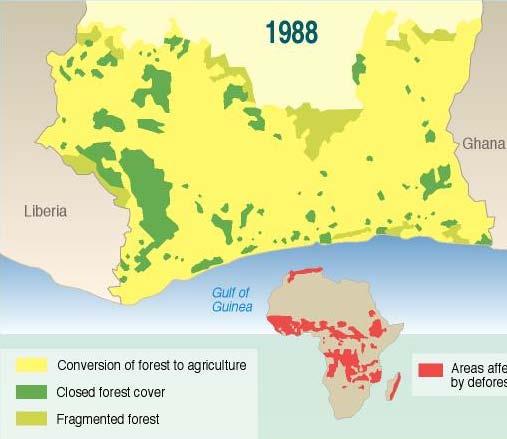
21 Deforestation in Cote d Ivoire (source: UNEP-GRID)
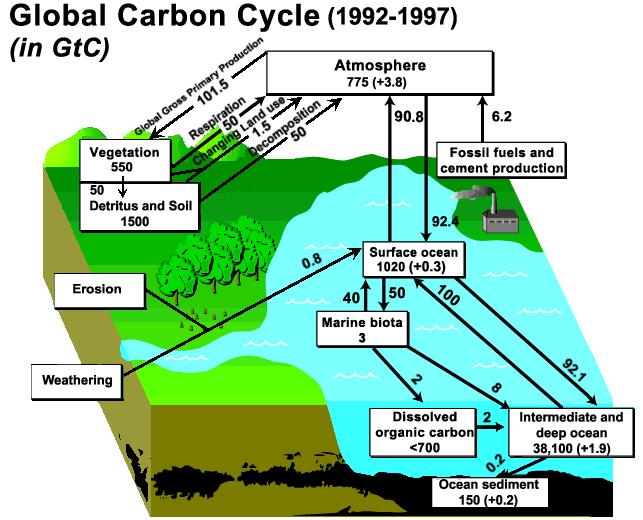
22 Carbon cycle: Emission of CO 2 and/or CH 4 Mineralization-immobilization (sequestration) of carbon = source of energy for biota = important for soil quality = availability of trace elements to plants
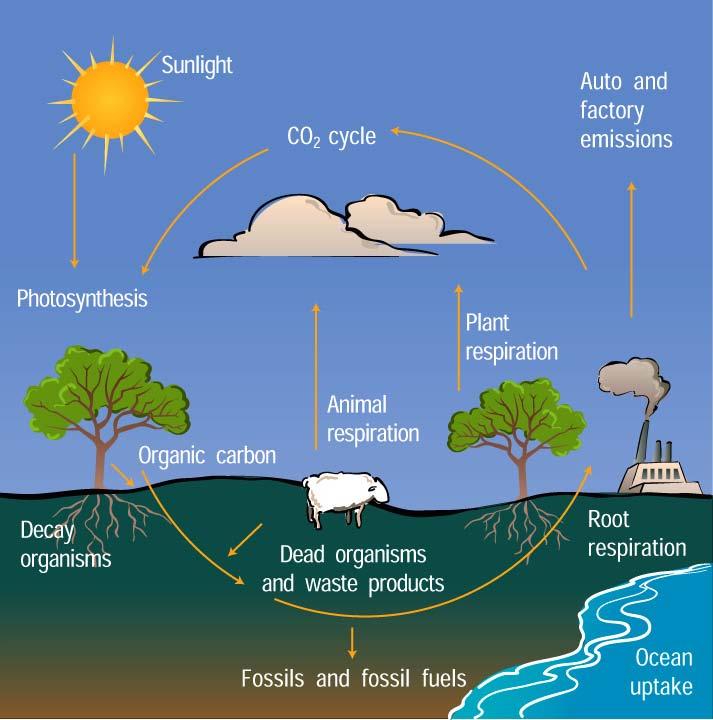
23
24
25 Nitrogen cycle: Mineralizationimmobilization Nitrate reduction Emission of NOx
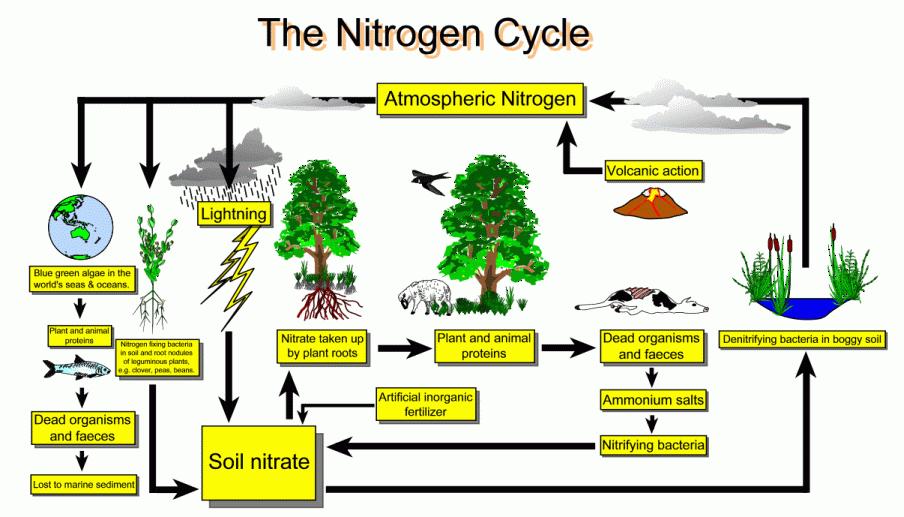
26
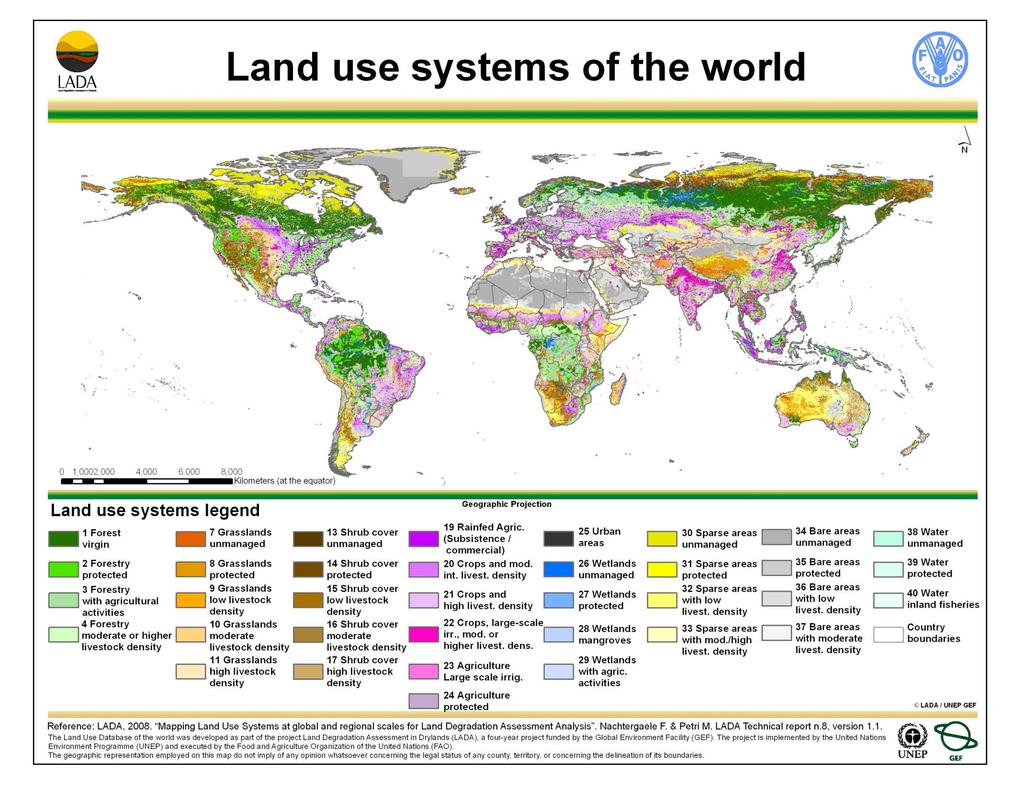
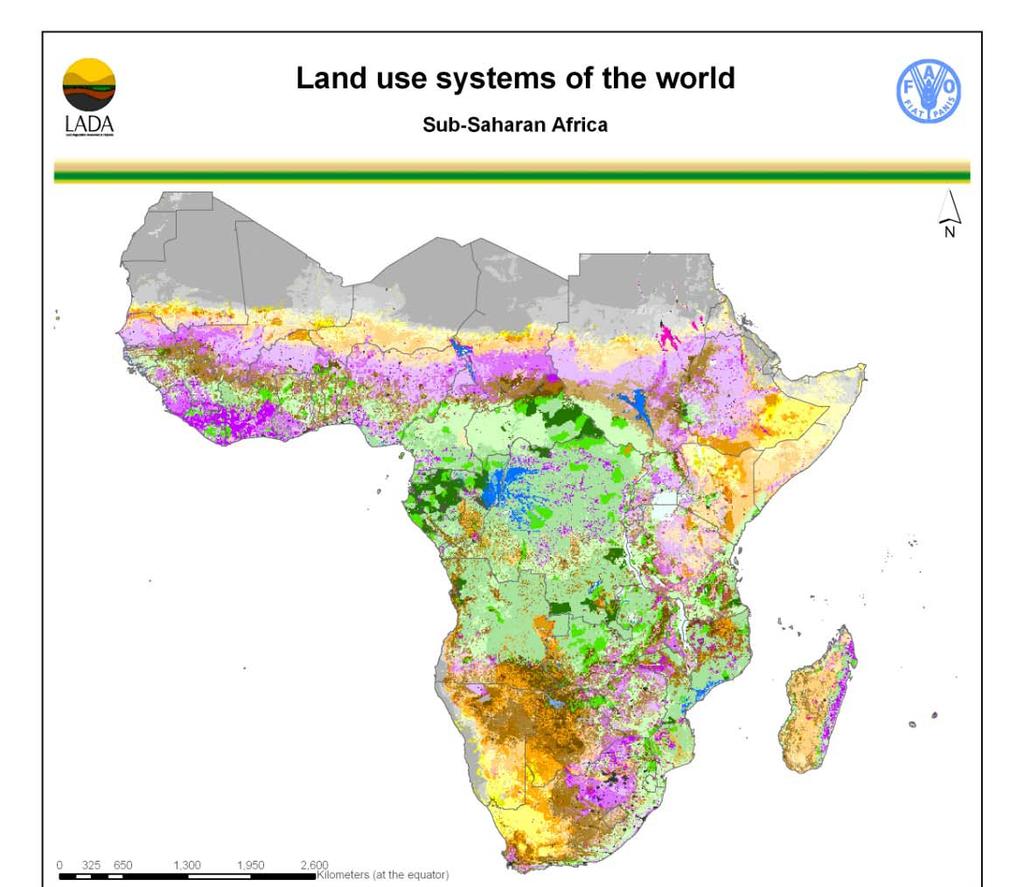
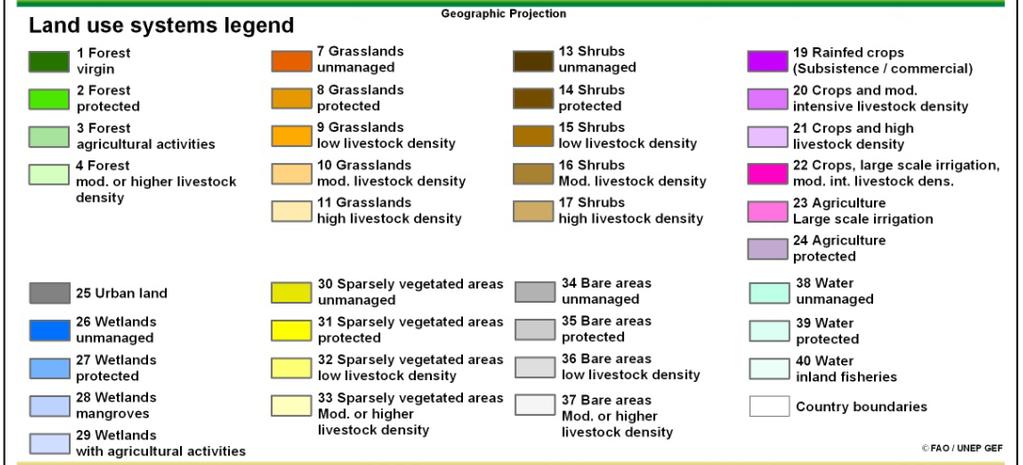
27 3. Land Use Systems
28 Reference: LADA, Mapping land use systems at global and regional scales for land degradation assessment analysis. Nachtergaele, F., and Petri, M. LADA Technical Report no. 8, version 1.1. The Land Use Database of the World was developed a part of the project Land Degradation Assessment in Drylands (LADA), a 4-year project funded by the Global Environment Facility (GEF). The project is implemented by the United Nations Environment Programme (UNEP) and executed by the Food and Agriculture Organization of the United Nations (FAO).
29
30
31
; 14, coastal artisanal fishing (From FAO).")
32 Farming systems in West Africa:1, irrigated; 2, tree crop; 7, root crop; 8, cereal-root crop mixed; 11, agro-pastoral millet/sorghum; 12, pastoral; 13, sparse (arid); 14, coastal artisanal fishing (From FAO).
33 environment system
34 Conservation of mass (k): Influx Efflux = Accum/Deplet Source/Sink If source/sink = 0 Influx - Efflux = Accum/Deplet Thus, if Influx = Efflux Accum/Deplet = 0 That is, there is no accumulation or depletion of mass (k) System is sustainable if Influx = Efflux Or if Accum or Deplet are sustainable
35 Solar energy H 2 O CO 2 O 2 Photosynthesis - Respiration Leaching Natural Forest
36 Solar energy H 2 O CO 2 O 2 Fertilizer minerals Photosynthesis - Respiration Biomass: CHONSP + minerals Leaching Field crops
37 environment system mass energy Iagric output agric inputs labour machinery rural credit knowledge livestock pests diseases
38
39
40
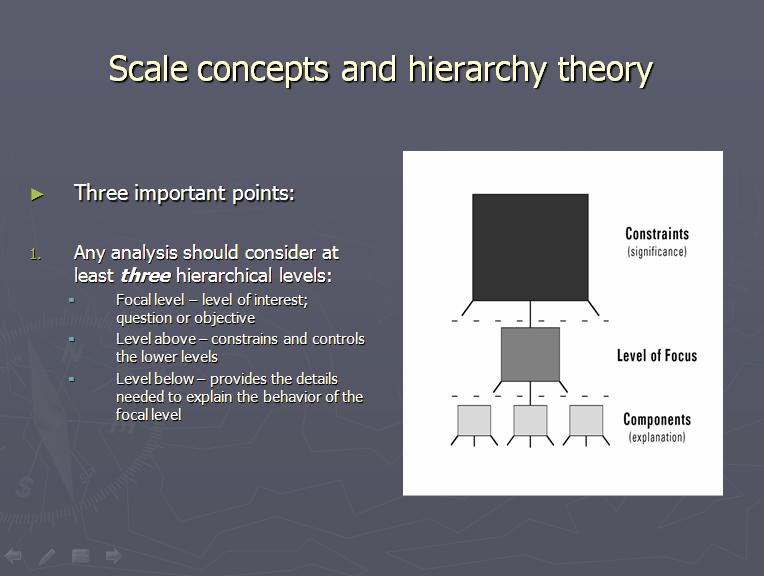
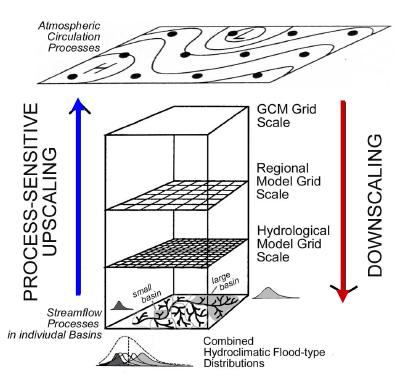
41 4. Scales in space and time
42 space processes time upscaling & downscaling
43
44 >1000 km - global km - regional km - meso 1-10 km - local < 1 km - plot Spatial scales
45
46
47 T = 5 years
48 T = 10 years
49 5. Derive criteria for integrated NRM
50 CONTEXT Effective natural resource management (NRM) for inclusive and sustainable growth in the context of increased scarcity and climate change: What roles for the public and private sectors? KEY WORDS integrated NRM sustainable development increasing scarcity of resources climate change
51 Criteria for NRM for sustainable development against the background of increasing scarcity of the resources and climate change Energy balance: 1. decrease the emission of greenhouse gases (e.g., CO2) and reduce activities that negatively affect the energy balance (increase in H) such as wind erosion (dust), burning of vegetation (aerosols, CO2), land degradation (loss of vegetation, decrease in productivity, soil color=albedo)
52 Criteria (continued) 2. Fossil energy: decrease the use of fossil energy or replace by renewable energy 3. Develop new sources or technologies of renewable energy, promote their use and increase the efficiency of these products. Water: 4. Decrease negative human interference with the water cycle 5. Limit the use of fossil groundwater and develop alternatives.
53 Criteria (continued) 6. Increase the efficiency of the use of sweet water for agricultural, industrial and domestic purposes. In agriculture, increase water use efficiency by plants and animals, and decrease losses from the land (evapo-transpiration, leaching, surface runoff) and from water distribution (irrigation) systems. 7. Protect the quality of surface and groundwater.
54 Criteria (continued) Land: 8. Make efficient use of the resource (scarcity!) and decrease degradation of the resource, e.g., loss of vegetation and biodiversity, water and wind erosion, loss of soil organic matter, deterioration of physical and chemical soil properties, etc. 9. Optimize land management with regard to the water cycle (including quality!) 10 Reduce the emission of greenhouse gases (Ccycle, N-cycle, S-Cycle), aerosols, dust (fires)
55 6. Optimize the functioning of the system in terms of WEL and derive management strategies
56 LEISA: Low external input sustainable agriculture Fertilizer Use in in the Netherlands kg/ha, Niger 0.4 kg/ha and Mali 0.0 kg/ha Most agriculture in Africa (other than the RSA) is LEISA by definition, as little or no external inputs are used. In W Europe LEISA usually means less external inputs than are currently used. In SSA LEISA may well mean more external inputs than are currently used, although in some cases the inputs and the associated technologies may be different. E.g., zero or reduced tillage practices, use of organic residues, mulching for moisture conservation, etc.
57 It should thus be emphasized that low-input does not mean zero-input. Experience with the SubSahara Africa Challenge Programme (SSA-CP) has shown that, use of organic residues, low or zero tillage and mulching for moisture conservation, alongside the use of small quantities of mineral fertilizers and the use improved maize varieties (disease resistance) can make a difference and break the poverty trap. In addition to access to agricultural extension, rural credit and input and output markets, this requires the organization of farmers in Innovation platforms, which provides an alternative for the traditional linear approach to agricultural extension.
58 Linear TT approach rural credit input market int agric res nat agric res nat ext serv farmer local govt output market
59 int agric res local govt nat ext serv nat agric res rural credit farmer output market input market Innovation platform TT approach
60 6. Conclusion
61 The WEL nexus can provide a framework for the analysis of Land issues, based on an understanding of the roles of water, energy and land, and their links and interactions in well-defined land-use systems, clearly related to x and t scales. Criteria for analysis and development of governance and management strategies would not be very different from those derived from the Millennium Ecosystem Assessment. Poor countries in SSA would need the assistance of Europe to implement sustainable development policies and management strategies.

62 West African Science Service Center on Climate and Adapted Land Use THANK YOU FOR YOUR ATTENTION
63