Towards a development of a decision support system for flood management in Chao Phraya river basin, Thailand
|
|
|
- Allison Allison
- 5 years ago
- Views:
Transcription


1 Towards a development of a decision support system for flood management in Chao Phraya river basin, Thailand Piyamarn Sisomphon 1, Surajate boonya-aroonnet 1, Somchai Chonwattana 2, Finn Hansen 2 1 Hydro and Agro Informatics Institute, Thailand; 2 DHI Water & Environment, Thailand; 3 DHI Water & Environment, Denmark 5-7 September 2013 Exeter, United Kingdom


2 Content 1. Introduction to Chao Phraya river basin 2. Flood management 3. Development of decision support system (DSS) 2 2

3 Chao Phraya River Basin Sub-basins Catchment area 160,000 km2 (30% of Thailand) 4 major tributaries (Ping, Wang, Yom, Nan) to form Chao Phraya river Mean annual precipitation 1,374 mm ( ) Catchment area (sq.km.) Total volume (MCM) Ping 35,535 9,073 Wang 11,084 1,624 Yom 19,516 3,684 Nan 32,854 11,936 Sakae Krang 5,020 1,096 Pasak 15,647 2,823 Tha Chin 18,105 2,449 Total CPY main stream 21,521 4,435 3
. PasakJolasidis used for the flood control in the lower CPY. 4")
4 Major reservoirs Reservoirs Mae Ngad Sombun Chon Capacity (MCM) 265 Mae Kuang Udom Thara 106 Kew Kor Ma 170 Kew Lom 106 Bhumibol 13,462 Sirikit 9,510 Khae Noi Bamrung Daen 939 Tab Salao 160 Kra Siew 240 Pasak Jolasid 785 Bhumiboland Sirikitreservoirs are used for flood control in the upper CPY (Ping and Nan rivers). PasakJolasidis used for the flood control in the lower CPY. 4

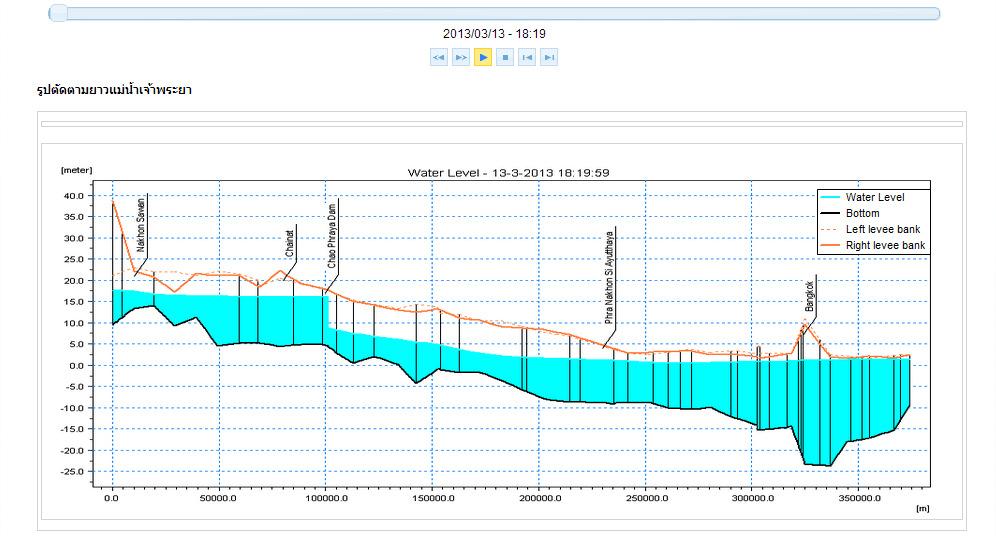
5 Chao Phraya River Qavg=2,800 cms Qavg=3,200 cms Qavg=1,000 cms Qavg=3,500 cms เข อนเจ าพระยา Average capacity of middle to lower part of Chao Phraya river 5

6 Flood & Drought Drought: Mainly water shortage for irrigation purposes Occur in summer when rainfall is delayed Extreme weather, high variation of monthly rainfall Insufficient of water storage Some areas Flood risk area Drought risk area experience to both Causes of the flood: High river discharge Local heavy rainfall Topography and land use changes Disintegration of flood protection systems Land subsidence Global warming, extreme weather flood and drought conditions due to temporal and spatial uncertainties in monthly rainfall 6


7 Flood maps of Chao Phraya River Basin ,540 sq. km 21,240 sq. km 16,930 sq. km 29,560 sq. km 6,645 sq. km 7
8 Flood management Based on the rainfall forecast lead time 1. Short-term flood management: 1 to few days weather forecast for operational flood forecasting system 2. Medium-term flood management: Monthly water balance analysis for water allocation, water resources & reservoirs planning and management 3. Seasonal flood management: long term climate projection of 3-6 months to predict rainfall tendency, flood or drought conditions. 8 8


9 Decision support system (DSS) National Hydroinformatics Data Center Real-time Data Base Data Forecast Data Multiple Data Sources GIS Water user Rainfall Discharge Water level Reservoir Analysis Data Management DSS Output WRF Flood Forecasting System Multi-user Interfaces 9 Real-time Data Flood Forecast Water Balance 9 Flood Management
10 Modeling Structure Decision Support System: DSS Weather forecast (WRF) Hydrological Model Water Resources Model River Model Flood Model Reservoir management Water allocation Water balance Flow in rivers (discharge, water level) Controlled structures Overland flow/inundation (flood level, area, time) Flood management scenarios 10

 Run")
 Use NCEP s Global Forecast")


11 Weather forecast model: WRF Use a high resolutions topography Deploy fine computational grid 3x3 km (3 nested domains) Run twice a day 7-day forecasts (9x9 km) Use NCEP s Global Forecast System (GFS) inputs Verify with Local weather stations GAEMI (1 6 October 2012) Cloud condition 5 Oct GAEMI Telemetry rainfall 5 Oct. 2012


, the flow &")

12 Flood Forecasting System Flood forecasting models combine the use of 1D river model and 2D overland flow model together. By coupling these two models with the weather forecast (WRF), the flow & flood conditions can be predicted 7 days in advance. The project area covers the entire Chao Phraya river basin. 1D 2D 12 12


13 Flood Forecasting System The 2D flood model was developed using flexible mesh overlay on the DEM. The overland flow and its direction can be computed based on the computed flood volume and the natural slope of the area based on the DEM. Comparison between the computed flood map and the satellite image in October 2011.


14 Scenarios of Mike Flood August 2006 September August 2010 September 2010 August 2011 September

15 Decision Support System (DSS) The DSS was developed to link and manage the multiple data sources with the modeling system as well as to the designed-user interfaces. The system will organize and re-format data as required for model input and also to collect all the model output and present on the user interfaces

16 16

17 17


18 ต. ว งจ นทร อ.สามเงา จ.ตาก 18

19 19
20 Conclusion 1. DSS has shown its performance satisfactory. Its efficiency in data management has improved the capability of the FFS especially for the management of real time data. 2. The accuracy of FFS is still need further improvement. It depends a lot on the accuracy of the rainfall forecast which is highly uncertain, high variability. However the first 3 days the accuracy is about 75% 3. Accuracy of the 2D flood modeling depends on the quality of the DEM. Compensation between model accuracy, DEM resolution and acceptable computing time is to be decided. 4. Currently the CPY-FFS runs everyday at 8 AM, record of the accuracy has been continuous collected and analyzed for further 20 improvement. 20
21 Thank you 21