Sustainability through demand management
|
|
|
- Aldous Norris
- 5 years ago
- Views:
Transcription
1 University of Nevada, Las Vegas Digital UNLV Renewable Energy Symposium 2008 UNLV Renewable Energy Symposium Aug 20th, 10:30 AM - 11:15 AM Sustainability through demand management Jim Jaska AECOM Repository Citation Jaska, Jim, "Sustainability through demand management" (2008). UNLV Renewable Energy Symposium This Event is brought to you for free and open access by the Research and Graduate Studies at Digital Scholarship@UNLV. It has been accepted for inclusion in UNLV Renewable Energy Symposium by an authorized administrator of Digital Scholarship@UNLV. For more information, please contact digitalscholarship@unlv.edu.

2 r Sustainability through Demand Management James Jaska

3 Agenda Mega trends Global dynamics Generation economics Demand management economics Future
4 Mega Trends Global Population growth of 75 million per year with increased per capita consumption Electricity consumption doubled between 1970 and 2002 with projections of 57% increase by 2030 (IEA reports) Energy is a key factor in geopolitics Imbalance of energy demand by developing countries growing at 121% per year % of world Comparative Energy Statistics % Pop % Prod G5 % Cons BRIC % CO2 Source: International Energy Agency; World Energy Statistics BRIC countries account for 75% of the increase in energy demand, 85% of the increase in CO2 emissions through 2030

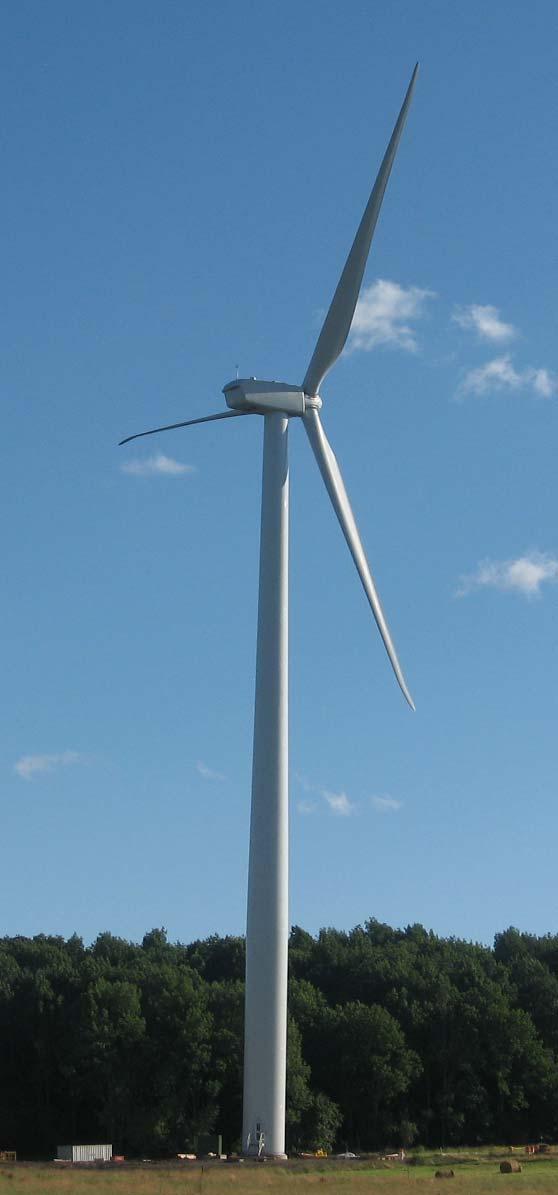
5 Mega Trends U.S. 50% growth in electricity demand expected over next 25 years Using current technologies, meeting this demand would require the building of 350 new power plants Renewables currently meet only 6% of demand US Projected Power Consumption (Trillion Kwh) Current Projected 2030
 Over 4,800 Gigawatts of new capacity by 2025; 2,000 GW in industrial countries 50% more output infrastructure in 2030 than today Clean,")
6 Mega Trends Global Challenges Environmental threats from energy demand Climate change could shrink global economy 20% Up to 200 million people could become refugees (The Stern Report) Challenge: USD $10 trillion needed for power plants and infrastructure (IEA) Over 4,800 Gigawatts of new capacity by 2025; 2,000 GW in industrial countries 50% more output infrastructure in 2030 than today Clean, reliable and sustainable Efficient electrical use Yet; over 2 billion have no electricity Shift to urban environment living (World Bank) By 2015, 54% of the world s population living in urban areas Pressure to create sustainable environments

7 Generation Economics Factors of generation construction far out weighs the investment in demand management Physical plant Siting Time Upfront cost per generated unit of renewable technologies are more costly than CO2 producing technologies

8 Demand Side Management A Renewable Tool for Sustainable Supply Objective: manage consumption to optimize energy resources Adds diversity to energy supply portfolio Contributes to environmental sustainability Increases overall energy security As a flexible resource, demand management provides benefits beyond generation offsets Enhancing system reliability Dampening price volatility Reducing other infrastructure costs (transmission, distribution, etc.)
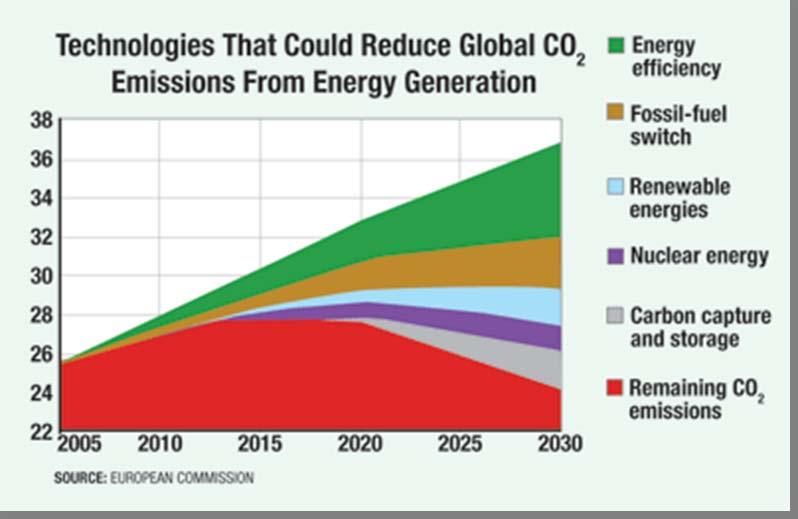
9 Technology Response
10 Demand Side Management Programs Approach Program Type Example Mandated Legislated standards Min. performance Top-runner stds Industry agreed actions Voluntary stds Technologies Delegated actions Regional bodies Municipalities Certifications Market adopted Price-responsive customers Tax reduction and rebates Commoditized energy efficiency Price elastic response Energy services contracts existing buildings Green buildings
 A green building (USGBC): Costs 9% less to")
11 Energy Efficiency Economics So the big green question for new build Life cycle vs. first cost Green premiums - 2% to 6% to achieve a moderate level of sustainable design (LEED Silver) A green building (USGBC): Costs 9% less to operate Increases resale value by 7.5% Has a 3% increase in rent

12 Existing Buildings Efficiency Economics Significant energy consumer More often life extended than replaced without addressing energy consumption factors More than 50% will still be in use in 2030 Office buildings create high density demand Investment breakevens at 3 to10 years

13 Simple Math The most cost effective and sustainable kilowatt is the one that is not used.
14 Public Pressure No longer a fad demand management has grown dramatically over the last 10 years Current rising energy prices creating awareness 3.7% drop in vehicle miles travelled U.S. Federal Highway Administration IEA projects 22% hike in home heating oil U.S. oil use in its steepest dive in 26 years

15 New Demand Management Responses Established energy policies creating order Energy Efficiency Portfolio Standards (EEPS) Renewable Energy Portfolio Standards (RPS) National and State Executive Orders 48 state financial incentive programs Local response Cambridge Energy Alliance Corporate social responsibility Utilities creating DSM programs
16 Renewable Portfolio Standards *WA: 15% by 2020 OR: 25% by 2025 (large utilities) 5% - 10% by 2025 (smaller utilities) CA: 20% by 2010 *NV: 20% by 2015 AZ: 15% by 2025 MT: 15% by 2015 NM: 20% by 2020 (IOUs) 10% by 2020 (co-ops) ND: 10% by 2015 MN: 25% by 2025 (Xcel: 30% by 2020) IA: 105 MW CO: 20% by 2020 (IOUs) *10% by 2020 (co-ops & large munis) WI: requirement varies by utility; 10% by 2015 goal IL: 25% by 2025 MO: 11% by 2020 VT: RE meets load growth by 2012 NC: 12.5% by 2021 (IOUs) 10% by 2018 (co-ops & munis) ME: 30% by % by new RE NH: 23.8% in 2025 MA: 4% by % annual increase RI: 16% by 2020 CT: 23% by 2020 NY: 24% by 2013 NJ: 22.5% by 2021 PA: 18%¹ by 2020 MD: 9.5% in 2022 *DE: 20% by 2019 DC: 11% by 2022 *VA: 12% by 2022 HI: 20% by 2020 TX: 5,880 MW by 2015 Minimum solar or customer-sited RE requirement * Increased credit for solar or customer-sited RE ¹PA: 8% Tier I / 10% Tier II (includes non-renewables) State RPS State Goal Solar water heating eligible
17 Decoupled Response Creates Challenges CA Governor s Executive Order S requires state agencies to reduce their energy use by 20% by 2015 State RPS - 20% by 2010, goal is 33% by 2020 State Bill AB32- reduce GHG emissions to 2000 levels by 2010, to 1990 levels by 2020, to 80% reduction from 1990 levels by 2050 Los Angeles - RPS of 35% by GHG emissions to be 35% lower than 1990 by 2030 San Francisco - 100% renewable electricity by 2010 San Diego - GHG 15% lower than 1990 by 2010 San Jose GHG 25% lower than 1990 by 2015
18 Managing Demand Can Pay Back Demand side management investments Driven by simple payback short term financing Performance contracts compared to other investments Institutional demand side management Longer term performance contracts up to 25 years Colleges, hospitals and federal buildings Small business and residential DSM Simple technologies lighting, appliances, weatherization, roofs, windows Utility rebates and Energy Star ratings driven
19 Demand Management - $6 Billion US 22% Annual Growth ESCO Industry Activity ($M) (Source: Consortium for Energy Efficiency)
20 The future Renewable sources of energy are becoming a part of the mainstream As energy demand continues to increase, energy efficiency improvements become evermore important Cost of generation Time Environmental Simple math: The most cost effective and sustainable kilowatt is the one that is not used
21 AECOM (NYSE: ACM) Global provider of professional technical and management support services to a broad range of markets, including transportation, facilities, environmental and energy. providing energy and power services around the world Energy Efficiency Renewable Energy Generation Distributed Fossil Fuel Generation Transmission and Distribution We deliver solutions that enhance and sustain the world's built, natural, and social environments