Nitrous oxide emissions from urine and dung
|
|
|
- Rosamond Greene
- 5 years ago
- Views:
Transcription


1 Nitrous oxide emissions from urine and dung Dave Chadwick Laura Cardenas, Neil Donovan, Tom Misselbrook, John Williams, Rachel Thorman, Karen McGeough, Catherine Watson, Madeleine Bell, Steve Anthony, Bob Rees


2 Content Context UK GHGPlatform Urine & Dung experiments Methods Results Synthesis Summary
3 Urine and dung - sources of N 2 O Grazing livestock convert pasture biomass N into N r Urine and dung deposition represent hotspots of N ( kg/ha N in a pat(ch)) IPCC default N 2 O EF (2006 GL): 2% (cattle), 1% (sheep) Pasture, Range and Paddock represents significant proportion of total N 2 O from national agricultural emission inventories 25% 13% 1% 22% 5% 0% 1% 6% 9% 13% 5% N 2 O emissions UK agriculture (2013). Total 71.5 kt Histosols Field burning Mineralisation Atmospheric deposition Manure management systems Animal manure applied to soil Crop residues Grazing Synthetic fertilisers Leaching and runoff
4 Luxemburg Slovenia Iceland Estonia Croatia Latvia Norway Austria Slovakia Portugal Lithuania Hungary Sweden Bulgaria Belgium Finland Greece Czech Republic Denmark Romania Netherlands Ireland New Zealand Japan Kazakhstan Italy Poland Australia Turkey Ukraine UK Spain Germany France Russia National N 2 O emission (kt/yr) Grazing as % total N 2 O emission Grazing as % of total agriculture N 2 O emission from different nations (UNFCCC, year 2013) % of total agricultural N 2 O emitted from grazing varies between nations depends on livestock systems (housing vs grazing period)
5 Mt CO 2 e / year Trends in UK GHG emissions from agriculture (IPCC 2006 Guidelines) Methane Nitrous oxide N 2 O Tier 1 with CS activity data (N excretion, livestock numbers, fertiliser use) CH 4 Tier 2 for enteric emissions for dairy cattle, other Tier 1 with CS data on livestock numbers, distribution of MMS

 Specific")
6 Why change to a Tier 2 approach? UK set challenging targets Industry GHG roadmaps Tier 1 is a blunt reporting tool Need a reporting tool that better reflects: Soil types & Rainfall zones Management of nitrogen sources Management of grassland and livestock (diet, breed, upland/lowland) Specific mitigation strategies Apportion uncertainty to specific parts of the inventory


7 UK GHGPlatform Nitrous oxide Data synthesis Methane New inventory structure
 Timing of application (manures, urine) Method of application (slurry) Mitigation Nitrification inhibitor More frequent, smaller doses of N fertiliser Cardenas et al.")
8 Nitrous oxide (InveN 2 Ory) project - N sources N sources Nitrogen fertilisers (ammonium nitrate and urea) Livestock manures (slurry, FYM, poultry manure) Urine & dung (grazing) N management Rate of application (fertiliser N) Timing of application (manures, urine) Method of application (slurry) Mitigation Nitrification inhibitor More frequent, smaller doses of N fertiliser Cardenas et al. (2010)

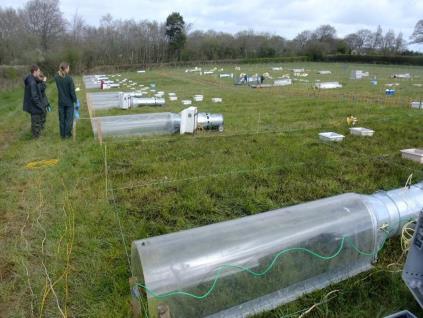
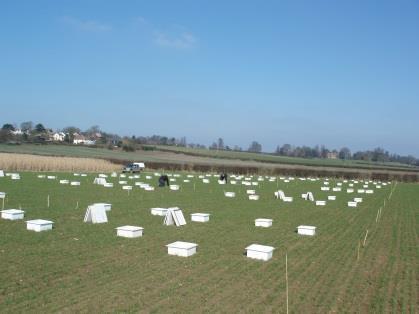
9 InveN 2 Ory network of experimental sites Represent the principle geoclimatic zones that support agricultural production in the UK Address the gaps identified in the initial analysis of current/recent research which has generated IPCC compliant emission factors 9 sites: 5 grass and 4 arable

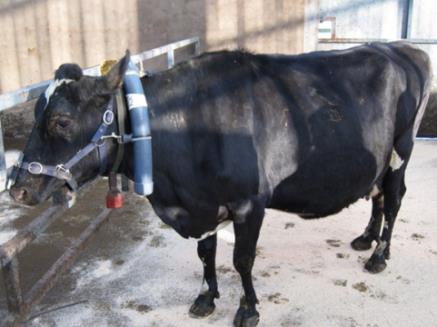
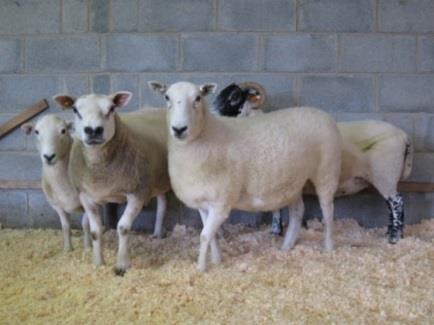
10 InveN 2 Ory urine & dung treatments 5 treatments: Dung Urine Synthetic urine Urine + DCD Control 3 blocks 5 static chambers/plot Dung and real urine: Collected from dairy cattle < 7 days prior to experiment Synthetic urine: Recipe (Kool et al., 2006) Mean application rates (for all sites): Urine: 455 kg N ha -1 Dung: 855 kg N ha -1
 Common experimental protocol (plot layout, treatments, method of application, chamber")
 mixed with urine at equivalent rate of 10 kg / ha 5 sites, spring, summer and")
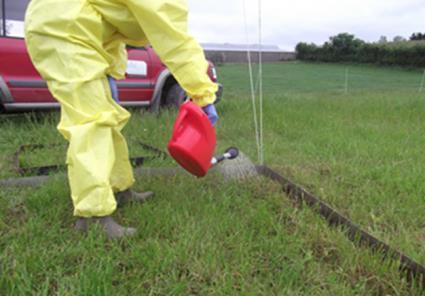
11 InveN 2 Ory field experiments - Urine and dung *Chadwick et al. (2014) Common experimental protocol (plot layout, treatments, method of application, chamber deployment*, data processing) Urine and faeces applied to plots separately Nitrification inhibitor (DCD) mixed with urine at equivalent rate of 10 kg / ha 5 sites, spring, summer and autumn applications, 15 experiments in total
12 Results site characteristics Site Clay content (%) Soil ph Average annual rainfall (mm)* Average annual air temp. ( o C)* Crichton Hillsborough Pwllperian Drayton North Wyke *Annual rainfall and air temperature of the experimental periods
13 Crichton - SP Crichton - SU Crichton - AU Drayton - SP Drayton - SU Drayton - AU Hillsborough -SP Hillsborough -SU Hillsborough - AU North wyke -SP North wyke - SU North wyke - AU Pwllpeiran - SP Pwllpeiran - SU Pwllpeiran - AU Creatanine /Allantoin concentration (mg/l) Hippuric acid (mg/l) DM (%) and ph Total N and Urea-N (g/l) Results urine composition DM ph Total N Urea-N Allantoin Creatinine Hippuric acid
14 Results N 2 O emissions (site level) North Wyke N 2 O flux (g N 2 O-N ha -1 d -1 ) N 2 O flux (g N 2 O-N ha -1 ) Spring application N 2 O lost as % of N applied EF Urine 2.96 Urine + DCD 1.00 Artificial urine 2.23 Dung ,000 14,000 12,000 10,000 8,000 6,000 Control Urine Urine + DCD Artificial Urine Dung 05-May 24-Jun 13-Aug 4, Oct 21-Nov 10-Jan 01-Mar 20-Apr 09-Jun 2,000 0 Control Urine Urine + DCD Artificial Urine Dung
15 N 2 O EF (%) Results summary data 1.6 Effect of application timing (across all sites) on N 2 O EFs b b a a ab a a b ab a a a 0.0 Early Mid Late Early Mid Late Early Mid Late Early Mid Late Urine Artificial urine Dung Urine+DCD Urine Urine Urine Artificial Urine Artificial Urine Artificial Urine Dung Dung Dung Urine+DCD Urine+DCD Urine+DCD Means with different letters within each treatment are significantly different (P<0.05)
16 Crichton Drayton Hillsborough North Wyke Pwllpeiran Crichton Drayton Hillsborough North Wyke Pwllpeiran Crichton Drayton Hillsborough North Wyke Pwllpeiran Crichton Drayton Hillsborough North Wyke Pwllpeiran N 2 O EF (%) Results summary data Site differences in N 2 O EFs (across all timings) IPCC default N 2 O EF for cattle excreta (PRP) b b ab ab ab ab a b a ab a ab a ab b ab ab b a a UrineUrineUrineUrineUrine Artificial Artificial urine Artificial urine urine Artificial urine urine DungDungDungDungDung urine Urine Urine + DCD Urine + Urine+DCD + + DCD + DC Means with different letters within each treatment are significantly different (P<0.05)
17 InveN 2 Ory combined excretal (urine + dung) EF = * *depends on proportion of N excreted in urine vs dung (75:25 or 80:20) Results - synthesis N 2 O EF (%) average standard error Urine (15) Urine + DCD (15) Dung (15) Recent NZ data Kelliher et al (2014) Topography Urine N 2 O EF Dung N 2 O EF Dairy Lowland 1.16 (55) 0.23 (20) Dairy Hill (low slope) 0.84 (16) 0.20 (4) Beef Hill (low slope) 0.99 (4) 0.21 (12) Beef Hill (medium slope) 0.32 (4) 0.06 (4) Sheep Lowland 0.55 (4) 0.08 (12) Sheep Hill (low slope) 0.40 (12) 0.11 (8) Sheep Hill (medium slope) 0.16 (8) -
18 Relationships statistical models Urine N 2 O EF = f Ammonium-N, Creatinine, Urea-N r 2 =0.724 r 2 =0.864 if air temperature and rainfall included Dung N 2 O EF = f Rainfall, %Clay, %DM, %WFPS, SOC, BD, soil ph, ph r 2 =0.688 Urine N 2 O EF predominantly controlled by urine composition Dung N 2 O EF predominantly controlled by physical environment
19 Wider synthesis - additional data sets UK InveN 2 Ory 15 experiments + UK additional 2 experiments + Irish - 12 new experiments - Agricultural Greenhouse Gas Research Initiative (AGRI-I) +? e.g. New Zealand (Kelliher et al., 2104)
20 Summary Urine and dung N 2 O emissions vary across sites and seasons Urine N 2 O EF of 0.69% significantly greater than that for dung (0.19%) Produce a combined excretal EF for cattle of %, which is much lower than IPCC default (2% cattle and 1% sheep).implications DCD efficacy variable but with average reduction of 38% from urine (range 0-75%)
? Effect of stocking density urine patch overlap?")

21 Understanding what controls efficacy of inhibitors Future research Sheep urine/dung (assume the same N 2 O EF as for cattle)? Effect of stocking density urine patch overlap? Upland soils / extensive systems e.g. acid soils, cooler/wetter soils, reduced palatability of vegetation Uplands-N 2 O Mitigation strategies (manipulate urine composition and/or livestock movement, targeted use of inhibitors)

22 Thanks!! Organisers of the GGAA2016 Conference InveN 2 Ory project field and lab teams Dr Dan Dhanoa (statistics) Funders
23 Literature cited Chadwick, D.R., Cardenas, L., Misselbrook, T.H., Smith, K.A., Rees, R.M., Watson, C.J., McGeough, K.L., Williams, J.R., Cloy, J.M., Thorman, R.E. and Dhanoa, M.S. (2014) Optimizing chamber methods for measuring nitrous oxide emissions from plot-based agricultural experiments. European Journal of Soil Science 65, Kelliher, F.M., Cox, N., van der Weerden T.J., de Klein, C.A.M., Luo J. and Cameron, K.C. (2014) Statistical analysis of nitrous oxide emission factors from pastoral agriculture field trials conducted in New Zealand. Environmental Pollution 186, Kool, D.A., Hoffland, E., Sander, A. and van Groenigen, J.W. (2006) What artificial urine composition is adequate for simulating soil N 2 O fluxes ands mineral N dynamics. Soil biology and Biochemistry 38, UNFCCC (2016) National greenhouse gas emission submissions for the year missions/items/8812.php [accessed on 11th January 2016)