WQI BASED GROUND WATER QUALITY ASSESMENT USING RS AND GIS
|
|
|
- Ronald Harrell
- 5 years ago
- Views:
Transcription
1 WQI BASED GROUND WATER QUALITY ASSESMENT USING RS AND GIS H Narendra Kumar Faculty, Dept. of Civil Engineering, SJBIT Bengaluru, India Dr. Manjunath H N Faculty, Dept. of Civil Engineering, SJBIT Bengaluru, India Bharath.S UG Scholar, Dept. of Civil Engineering, SJBIT Bengaluru, India Abstract The quality of drinking water is a powerful environmental determinant for human health. Assured drinking water is a foundation for the prevention and control of waterborne diseases. All over the world, human population has inadequate access to potable water and use sources contaminated with disease vectors, pathogens or unacceptable levels of toxins or suspended solids. Drinking or using such water leads to widespread chronic illness and is a major cause for death. Reduction of waterborne diseases is a major public health goal for a civilized society. WQI values are computed for water quality measures in Bidadi. In the present investigation 23 groundwater samples have been analyzed and interpreted. A WQI value in the study area varies between 33.1 to 80.0 with an average of According to the WQI classification, about 0% of the total groundwater samples represent excellent water quality, 26.1% as good, % as poor and about 8.69 % as very poor water in quality. The higher Percent of WQI values in poor and very poor water quality classes are mainly due to geo genic and anthropogenic factors. Although the water quality is 80.0 mainly controlled by rocks and soil chemistry, excessive utilization of agro inputs has also compounded to this problem. The result obtained from the study indicates that groundwater is generally suitable for both drinking and domestic purpose, except in few cases. Keywords: Anthropogenic, Contaminants, Bidadi Purasabha, WQI, Water Quality Introduction Water has always been an important and life-sustaining drink to humans and is essential to the survival of all living organisms. The quality of drinking water is a powerful environmental determinant for health. Assured drinking water is a foundation for the prevention and control of waterborne diseases. Over large parts of the world, humans have inadequate access to potable water and use sources contaminated with disease vectors, pathogens or unacceptable levels of toxins or suspended solids. Drinking or using such water leads to widespread chronic illness and is a major cause for death. Reduction of waterborne diseases is a major public health goal. Water quality deterioration in distribution systems is mainly due to inappropriate planning, design, maintenance and water quality control. A fraction of the burden in waterrelated diseases is attributable to the way water resources are developed and managed. In many parts of the world the adverse health impacts due to water pollution, irrigation development and flood control cause significant preventable disease. Horten was the first to use the concept of Water Quality Index (WQI) to represent the gradation in water quality. It reflects the overall water quality for human consumption (Brown, 1972). WQI is generating a score by integrating complex data that describes water quality status (Mishra and Naik, 2011). The present study is undertaken to assess the water quality status using water quality index as a tool. Groundwater plays a vital role in the rapidly expanding Urban, industrial, and agricultural water requirements, in the study area. Therefore, the quantification of the current rate of groundwater recharge is a necessity for the efficient and sustainable groundwater resource management. Groundwater recharge is generally considered as that amount of water, which contributes to the temporary or permanent increase of groundwater resources. From the mechanism of groundwater recharge it is quite obvious that the highest percentage of water is of meteoric origin. Other sources such as juvenile water of volcanic, magmatic and cosmic origins contribute little to the ground water recharge. The actual recharge reaching the water table may be considerably less than the potential recharge due to the influence of the unsaturated zone. Water-resource evaluation requires information on recharge over large spatial scales and decadal time scale, which requires detailed in-formation on spatial variability and preferential flow. Therefore, the complexity of water movement has to be followed critically from the very time it enters the soil profile, until it reaches the water table. Study Area: The Bidadi purasabha area (fig-01) lies between latitudes N to N and longitudes E to E. It covers an area of 37.4 Km 2. It lies in Ramanagara taluk and district. The highest elevation in the study area is 811m and lowest elevation is 675m. The area is of gneissic terrain with undulation topography with sparse vegetation. The dendritic drainage pattern is seen in the study area and the entire area covered by red sandy soil. It is well connected with roads and rails. The annual rainfall is 855mm with maximum temperature of 34 0 C, minimum temperature of 16 0 C. 258

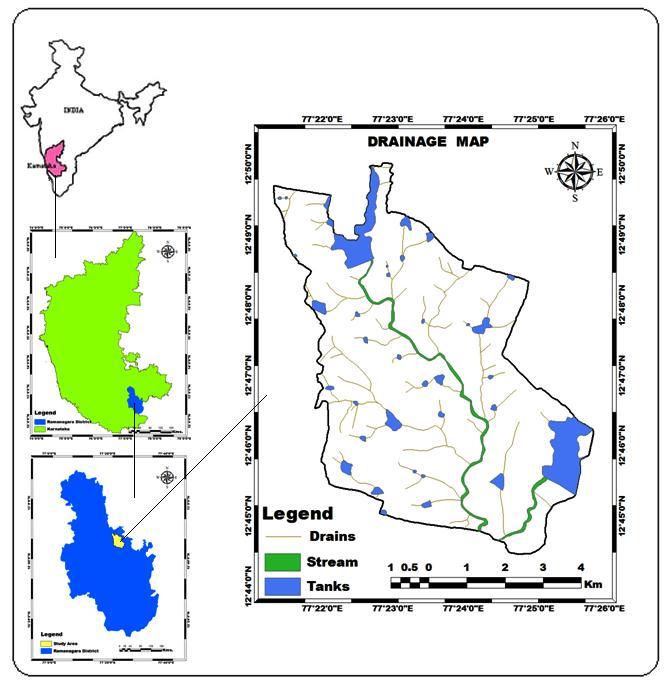
2 Figure 01: 259


3 Figure :
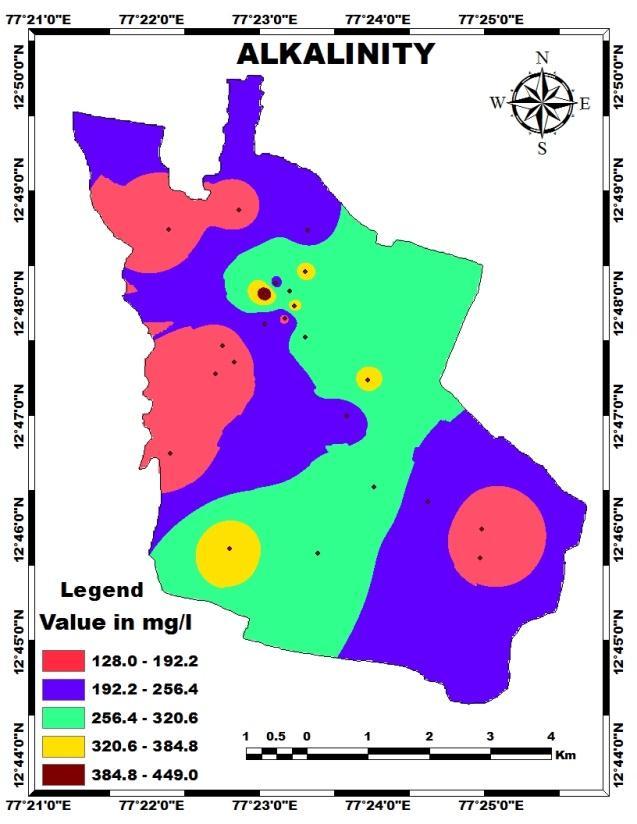
4 Figure03: WQI Calculation: Calculation of Groundwater Quality Index involves the assigning of Relative weight to each chemical parameter based on their impact on health, computation of Weighed parameter to know the relative share of each water quality measure and calculating status of chemical concentration of each parameter. Then finally by integrating all the values to obtain an overall groundwater quality index. Relative Weight (Wi): Each Chemical parameter is assigned a weightage based on its impact on human health. The range of numerical magnitude of Relative weight ranges from 1 to 5, for instance the parameters like ph, Alkalinity, EC, TH, TDS AND Cl respectively (Table-1). The lower values of Wi indicate lesser impact of respective chemical parameters on health and higher values have more impact over human health on consumption. Computation of Weight Parameter (Wp): Weight parameter is the ratio of Wi of every water quality measure to the sum of all relative weights. Weight parameter enables to know about the relative share of each water quality measure on overall water quality. The Wp is given by the equation; Wp = Wi ΣWi Quality Rating Scale (Qi): Quality rating is the ratio of concentration of each water quality measure of every water sample (C) to its respective drinking water quality standards (Ds) and the result is multiplied by 100. The Qi of each water quality measure is computed by the equation; Qi = C Ds Sub index calculation (Si): Sub index is computed by taking the product of each water quality measure with its corresponding status of concentration. Si reflects overall water quality and also enables to understand the nature of weight parameter with respect to concentration of each water quality measure. Si is calculated by; Si = Wp * Qi Groundwater Quality Index (WQI): WQI is calculated by the addition of all the values of Si contributed by all the water quality measures of each water sample. WQI is given by; WQI = ΣSi Result and Discussion: The study area has ph varying from 7.1 to 8.2 with an average of 7.5. The desirable limit of ph for drinking water is 7 to 8.5. EC of the groundwater varies from 320 to 1660 micro Siemens/cm at 20oC with an average of The Alkalinity value in the study area ranges from 168 mg/l to 456 mg/l, with an average of 265 mg/l. The Total hardness value ranges from 261
.")
5 204 mg/l to 628 mg/l, with an average of 380mg/l. The Chloride concentration in the study area ranges from 115 mg/l to 585 mg/l, with an average of 321 mg/l. Total dissolved solid varies from 400 mg/l to 1200 mg/l, with an average of 504 mg/l. Statistical parameter of the analytical results of groundwater is given in (Table 2). Table - 1: Weightage scheme for drinking water quality in Bidadi Purasabha area Parameters Relative weight Weighted parameter Drinking water standards Mean value of (gw) samples ph ALKALINITY(mg/L) EC (µs/cm) TH (mg/l) TDS (mg/l) Cl (mg/l) Table - 2: Chemical Composition of groundwater in Bidadi Purasabha area PARAMETERS Max. Min. MEAN S.D ph ALKALINITY (mg/l) EC (µs/cm) TH (mg/l) TDS (mg/l) Cl (mg/l) *Al l values in mg/l except EC and ph Table-3: WQI based Classification WQI Value Water Quality Percent of water samples < 25 Excellent 0 % (0) Good 26.1% (6) Poor 65.21% (15) > 75 Very Poor 8.69%(2) WQI Classification: The computed values of WQI for the study area are grouped into different classes Viz., excellent, good, poor and very poor. If the range of WQI is <25, its water quality is excellent, if the values are between 25 50, and >75 then the water quality is good, poor and very poor respectively. In the study area the WQI values varies between 33.1 to 80.0 (Fig.4) with an average of 56. According to the WQI classification, about 0% of the total groundwater samples represent excellent water quality, 26.1% as good, % as poor and about 8.69 % as very poor in water quality for the study area. Fig.4: WQI values and water sample Conclusion: The WQI values are computed to know the water quality in Bidadi purasabha area. In the study area the WQI values varies between 33.1 to 80.0 (Fig.1) with an average of 56. According to the WQI classification, about 0% of the total groundwater samples represent excellent water quality, 26.1% as good, % as poor and about 8.69 % as very poor in water quality for the study area. Thus the overall water quality by and large falls under poor. The higher WQI value in the poor and very poor water quality class is due to contribution from geogenic and anthropogenic factors. Although the water quality is mainly controlled by aquifer chemistry and soils, excessive utilization of agro inputs has also compounded to the problem. Hence it can be concluded that groundwater in the study area is suitable for both drinking and domestic purpose based on water quality index of groundwater. Acknowledgement: The authors acknowledge the financial assistance received from the Karnataka State Council for Science and Technology as a part of SPP. References: [1]. BIS (2003). Drinking water - specification, Bureau of Indian Standards: New Delhi IS; [2]. Manjunath H.N and Suresh.T.S., (2013). Groundwater Quality studies in Torehalla Watershed, Karnataka, India. Research and Reviews: Jour. Of Engineering and Technology. Vol.2, Issue 3, Sept.2013, pp [3]. S. P. Gorde, M. V. Jadhav, (DEC 2013) Assessment of Water Quality Parameters: A Review, S. P. Gorde et al Int. Journal of Engineering Research and Applications, ISSN: , Vol. 3, Issue 6, Nov-Dec 2013, pp [4]. Vidya. B. R, Ashfaq T M, Chaitra M V, Dodda Basappa S, Soumya Bhuti, (JULY 2017). Water Quality Assessment Of Vrishabhavathi 262
6 River, Bidadi Area Case Study ISTE janakpuri, New Delhi, ISBN: [5]. Sneha S. Phadatare, (MAY 2016), Review Paper on Development of Water Quality Index, International Journal of Engineering Research & Technology (IJERT), ISSN: , Vol. 5 Issue 05. [6]. Bidadi Purasabha, Ramanagara taluk and district [7]. Brown R.M., Mc Cleil, Deininger R.A. and O'Conner M.F., (1972). A water quality index crashing the psychological barrier, Ed. By. H. Jenkis, proc. Int. Conf. on water poll., Res. Jerusalem [8]. Mishra P.C and Patel R.K., (2011). Study of the pollution load in the drinking water of Rairangpur, a small tribal dominated town of North Orissa, Indian J. Environ. Ecoplan. 5(2),