2010 Air Quality Progress Report for Carlisle City Council
|
|
|
- Teresa Owen
- 5 years ago
- Views:
Transcription
 Progress Report")
1 2010 Air Quality Progress Report for Carlisle City In fulfillment of Part IV of the Environment Act 1995 Local Air Quality Management April 2010 (Rev 2) Progress Report i
2 Local Authority Officer Mathew Proudfoot Department Address Local Environment Civic Centre, Rickergate, Carlisle, CA3 8QG. Telephone Report PR 04/10 Reference number Date April 2010 Progress Report ii
3 Executive Summary The Government prepared the Air Quality Strategy for England, Scotland, Wales and Northern Ireland for consultation in August It was originally published in January The Strategy has been revised since originally published. The latest Air Quality Strategy was published on 17 July At the centre of the Air Quality Strategy is the use of air quality standards to enable air quality to be measured and assessed. These also provide the means by which objectives and timescales for the objectives to be achieved can be set. These standards and associated specific objectives have to be achieved between 2003 and To aid local authorities in the completion of the assessment, revised Technical Guidance (TG (09)) was published by Defra in February 09. This guidance provides a checklist approach to assessing where specific sources of pollutant may, on a local level, lead to a risk of an air quality objective being exceeded and therefore require a more detailed assessment. Local Authorities are required to review and assess the air quality in their areas to determine whether the air quality objectives are likely to be met. Where the likelihood of exceedences of the air quality objectives has been identified in areas of significant public exposure, an Air Quality Management Area (AQMA) should be declared, followed by a further Stage 4 review and assessment, and the formulation of an action plan to eliminate exceedences. This report represents the second stage of the fourth round of updating and screening assessment of local air quality for the Carlisle City area. Carlisle City has previously undertaken 3 rounds of review and assessment. This review and assessment work has concluded that overall air quality within our local authority is good. There are, however, small pockets within the city where the annual mean objective level for nitrogen dioxide is being exceeded due to road traffic sources. As a consequence 6 Air Quality Management Areas have been declared between 2005 and A Further Assessment undertaken by our specialist consultant s AEA Technology on behalf of Carlisle City as part of our air quality management duties, in 2009, concluded that AQMA no.3 should be extended to cover residential properties along Wigton Rd, to include odd nos and even nos and also properties on Caldcotes. The need to extend was due to exceedences of the annual mean objective level for nitrogen dioxide in this area. The order to extend the AQMA came into force on 1 st July 2010 following no objections from consultees. The purpose of this Progress Report is to identify any significant changes that may have occurred since the previous rounds of review and assessment were completed. This includes new monitoring data, new or changed emissions sources, or any other local changes that might affect air quality. In each case, these sources need only be considered if they are new, if they have not been considered previously, or if there have been significant changes since the last round of review and assessment. If significant Progress Report iii
4 new sources or changes are identified then the city council would need to proceed to a Detailed Assessment for that pollutant. This report identifies proposed new developments which may be introduced into our district since the last round of review and assessment which may have air quality implications. These developments are currently being considered by the planning department and in each case the prospective developers have been asked to demonstrate the likely impacts and mitigation measures by submitting an Air Quality Impact Assessment (AQIA). Depending on the conclusions of these and in the event of a granted application, it may be necessary to proceed to a detailed assessment should the predicted impacts be sufficient to warrant further detailed investigation. The three principal pollutants that are currently monitored by Carlisle City include; nitrogen dioxide, particulates (PM10 & PM 2.5) and benzene. Both the historical and the most recent results for 2009 are presented in this report for comparison purposes. Data indicates that the annual mean nitrogen dioxide concentrations have fallen at the vast majority of monitoring locations around the district from previous years. Results of PM10 PM2.5 and Benzene show that levels remain considerably below the objective. New monitoring data for existing sites indicates that locations within AQMA nos.1, 3, 4, & 5 remain above the annual mean objective level for nitrogen dioxide. Conversely monitoring within AQMA no.6 (London Rd) indicates that the nitrogen dioxide concentration fell below the objective level in 2008, this reduction has continued further in 2009 so the annual mean is still below the objective level. Nitrogen Dioxide levels have also fallen within AQMA no.2 (Currock Street) for the first time since monitoring began here. Further assessment work in 2007 predicted that annual mean levels would fall below the objective level by 2011, however monitoring data for 2009 indicates that we have already reached this target at this particular location. Both AQMA s 2 and 6 will continue to be monitored and if this monitoring shows a continued reduction then consideration will be given to revoking these AQMA s. It is likely however that monitoring will continue until after the opening of the Carlisle Northern Development Route (CNDR) so that before and after comparisons can be drawn. Work has now begun on the CNDR. Previous Further Assessment work in 2007 indicates that the opening of the CNDR will have a major impact on nitrogen dioxide levels along A7 (AQMA No. 1) bringing levels to below the objective level. Further Assessment work undertaken in 2009, to aid the City in developing it s Air Quality Action Plan and to take account of the recently declared AQMA s also indicates that the CNDR will have a significant positive impact on air quality along the A595 (this includes AQMA No s 3 and 4). This report summarises the current policies adopted by the council which relate to air quality including its local transport plans and strategies, air quality planning policies and climate change strategies. It includes a summary of the measures detailed in the action plan which are expected to have a positive effect on air quality in the city. It provides an update on the progress made in implementing these measures and the timescales in which they are likely to run. A revised Air Quality Action Plan will be available in Progress Report iv
5 Table of contents 1 Introduction Description of Local Authority Area Purpose of Progress Report Air Quality Objectives Summary of Previous Review and Assessments 11 2 New Monitoring Data Summary of Monitoring Undertaken Comparison of Monitoring Results with Air Quality Objectives 23 3 New Local Developments Road Traffic Sources Other Transport Sources Industrial Sources Commercial and Domestic Sources New Developments with Fugitive or Uncontrolled Sources 46 4 Planning Applications 47 5 Air Quality Planning Policies 49 6 Local Transport Plans and Strategies 50 7 Climate Change Strategies 53 8 Implementation of Action Plans 56 9 Conclusions and Proposed Actions Conclusions from New Monitoring Data Conclusions relating to New Local Developments Other Conclusions Proposed Actions References 73 Progress Report v
6 Appendices Appendix A: QA/QC Data Appendix B: Monthly No 2 diffusion tube results 2009 (Raw Data) Appendix C: NO2 diffusion tube results 2009 (Calculated Data) Appendix D: Map of non-automatic monitoring sites Appendix E: Map showing all declared AQMA s Appendix F: Maps showing location and extent of new developments Progress Report vi
7 List of Tables Table 1.1 Air Quality Objectives included in Regulations for the purpose of Local Air Quality Management in England. Table 2.1 Details of Automatic Monitoring Sites Table 2.2 Details of Non- Automatic Monitoring Sites Table 2.3a Results of Automatic Monitoring for Nitrogen Dioxide: Comparison with Annual Mean Objective Table 2.3b Results of Automatic Monitoring for Nitrogen Dioxide: Comparison with 1- hour Mean Objective Table 2.4 Results of Nitrogen Dioxide Diffusion Tubes Table 2.5 NO 2 diffusion tube results at monitoring locations in area A. Table 2.6 NO 2 diffusion tube results at monitoring locations in area B. Table 2.7 NO 2 diffusion tube results at monitoring locations in area C. Table 2.8 NO 2 diffusion tube results at monitoring locations in area D. Table 2.9 NO 2 diffusion tube results at monitoring locations in area E. Table 2.10 NO 2 diffusion tube results at monitoring locations in area F. Table 2.11 NO 2 diffusion tube results at monitoring locations in area H. Table 2.12a Results of PM 10 Automatic Monitoring: Comparison with Annual Mean Objective Table 2.12b Results of PM 10 Automatic Monitoring: Comparison with 24-hour Mean Objective Table 9.1 Action Plan Progress Progress Report vii
8 List of Figures Figure 1.1 Maps of AQMA Boundaries. Figure 2.1 Figure 2.3 Maps of Automatic Monitoring Sites. Trends in Annual Mean Nitrogen Dioxide Concentration Measured at Automatic Monitoring Sites. Figure 2.4 Results of Hourly Automatic Monitoring for Nitrogen Dioxide during 2009: Comparison with 1-hour Mean Objective at Paddys Market. Figure 2.5 Results of Hourly Automatic Monitoring for Nitrogen Dioxide during 2009: Comparison with 1-hour Mean Objective at Stanwix Bank. Figure 2.6 Map of diffusion tube locations in area A. Figure 2.7 Chart showing NO2 diffusion tube trends at monitoring locations in area A. Figure 2.8 Map of diffusion tube locations in area B Figure 2.9 Chart showing NO2 diffusion tube trends at monitoring locations in area B. Figure 2.10 Map of diffusion tube locations in area C Figure 2.11 Chart showing NO2 diffusion tube trends at monitoring locations in area C. Figure 2.12 Map of diffusion tube locations in area D. Figure 2.13 Chart showing NO2 diffusion tube trends at monitoring locations in area D. Figure 2.14 Map of diffusion tube locations in area E. Figure 2.15 Chart showing NO2 diffusion tube trends at monitoring locations in area E. Figure 2.16 Map of diffusion tube locations in area F. Figure 2.17 Chart showing NO2 diffusion tube trends at monitoring locations in area F. Figure 2.18 Chart showing NO2 diffusion tube trends at monitoring locations in area H. Figure 2.19 Chart to Show Results of PM 10 Automatic Monitoring: Comparison with 24- hour Mean Objective. Progress Report viii
9 1 Introduction 1.1 Description of Local Authority Area Carlisle City is the most northerly of the 6 Cumbrian Authorities and covers more than miles. The City of Carlisle supports the highest population concentration in Cumbria with 70,000 people living within the urban area. The rural towns of Brampton and Longtown support the next two highest population concentrations, 4000 and 2000 respectively. Carlisle is remote from other centres of population being 300 miles from London, more than 120 miles from Manchester, more than 90 miles from Glasgow and Edinburgh, and 60 miles from Newcastle Upon Tyne. Consequently Carlisle is the regional, commercial, administrative and retail centre serving a catchment population of around 450,000 who live within an hours travelling time of the city. Today s economy is characterised by food processing, agricultural support, automotive component manufactures and engineering. The dominant sectors are branch operation in warehousing, retailing, manufacturing, public administration and health services. Carlisle is also a significant transport hub for rail services and the national road transport network. The Government Regional Planning Guidance for the North West indentifies Carlisle as one of the North West s key town and cities where development should be concentrated. 1.2 Purpose of Progress Report Progress Reports are required in the intervening years between the three-yearly Updating and Screening Assessment reports. Their purpose is to maintain continuity in the Local Air Quality Management process. They are not intended to be as detailed as Updating and Screening Assessment Reports, or to require as much effort. However, if the Progress Report identifies the risk of exceedence of an Air Quality Objective, the Local Authority (LA) should undertake a Detailed Assessment immediately, and not wait until the next round of Review and Assessment. 1.3 Air Quality Objectives The air quality objectives applicable to Local Air Quality Management (LAQM) in England are set out in the Air Quality (England) Regulations 2000 (SI 928), and the Air Quality (England) (Amendment) Regulations 2002 (SI 3043). They are shown in Table 1.1. This table shows the objectives in units of microgrammes per cubic metre g/m 3 (for carbon monoxide the units used are milligrammes per cubic metre, mg/m 3 ). Table 1.1 includes the number of permitted exceedences in any given year (where applicable). Progress Report 9
10 Table 1.1 Air Quality Objectives included in Regulations for the purpose of Local Air Quality Management in England. Pollutant Concentration Measured as Benzene µg/m 3 Running annual mean 5.00 µg/m 3 Running annual mean Date to be achieved by ,3-Butadiene 2.25 µg/m 3 Running annual mean Carbon monoxide 10.0 mg/m 3 Running 8-hour mean Lead 0.5 µg/m 3 Annual mean Nitrogen dioxide 0.25 µg/m 3 Annual mean µg/m 3 not to be exceeded more than 18 times a year 1-hour mean µg/m 3 Annual mean Particles (PM 10 ) (gravimetric) 50 µg/m 3, not to be exceeded more than 35 times a year 24-hour mean µg/m 3 Annual mean Sulphur dioxide 350 µg/m 3, not to be exceeded more than 24 times a year 125 µg/m 3, not to be exceeded more than 3 times a year 266 µg/m 3, not to be exceeded more than 35 times a year 1-hour mean hour mean minute mean Progress Report 10
11 1.4 Summary of Previous Review and Assessments Since 1996 Carlisle City has been monitoring pollution levels in Carlisle and comparing them with the national air quality objectives a process known as review and assessment. Our review and assessment work has concluded that air quality within our local authority is generally very good. For the majority of pollutants the concentrations found in Carlisle are well below the governments health based objectives and are not of any concern. However there are small pockets within the city where the annual mean objective for nitrogen dioxide is not being met due to road traffic emissions. The local authority has subsequently declared six Air Quality Management Areas within the city. All of our Air Quality Assessment Reports are listed below and are available on the city councils website ( Stage 1 Report concluded that a stage 2 assessment would be required for nitrogen dioxide and particulates Stage 2 Report concluded that a detailed stage 3 assessment would be required in respect to nitrogen dioxide and particulates. Stage 3 Report concluded that it was unlikely that an air quality objective would be exceeded. Updating and Screening Assessment Report 2003 concluded that a detailed assessment would be required for nitrogen dioxide and particulates. Detailed Assessment 2004 concluded that it was likely that the annual mean objective for nitrogen dioxide would be exceeded at location alongside the A7. As a consequence Air Quality Management Area No.1 was declared in 2005 Progress Report 2005 concluded that it was likely that the annual mean objective for nitrogen dioxide would be exceeded at locations alongside Currock Street. As a consequence Air Quality Management Area No.2 was declared in Dec 2006 Updating and Screening Assessment Report concluded that a detailed assessment would be required in respect to the annual mean nitrogen dioxide at 4 locations within the City i.e. Wigton Rd, Bridge St, London Rd and Dalston Rd. Progress Report 2007 update on air quality issues. Detailed Assessment 2007 concluded that it was likely that the annual mean objective for nitrogen dioxide would be exceeded at locations alongside Wigton Rd, Bridge St, London Rd and Dalston Rd. As a consequence Air Quality Management Areas Nos. 3, 4, 5 and 6 were declared in Further Assessment Report 2007 confirmed that AQMA boundaries for AQMA no1 and 2 were correct. Progress Report 11

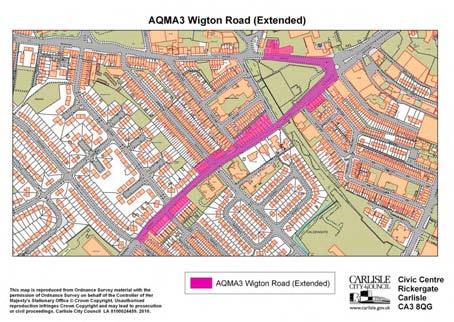
12 Progress Report 2008 update on air quality issues Further Assessment Report 2009 confirmed that the boundaries AQMA s Nos. 4-6 are correct. It recommends that the boundary of AQMA No.3 be extended to the bottom of Caldewgate roundabout. Updating and Screening Assessment concludes that that the existing boundary of AQMA no.3 on Wigton Rd will need to be extended to the Caldewgate roundabout and include properties on Caldcotes. The following maps show all six of the AQMA s that have been declared in the district, all have been declared due to exceedences of NO2 objectives only. Appendix E shows all AQMA s on one large map. Figure 1.1 Maps of AQMA Boundaries. Progress Report 12

13 Progress Report 13


14 Progress Report 14

15 Progress Report 15
16 2 New Monitoring Data 2.1 Summary of Monitoring Undertaken Air quality monitoring in Carlisle City is driven by the local air quality management process and in particular the review and assessment of air quality. Carlisle City currently monitors for 3 pollutants; nitrogen dioxide, particulates and benzene and employs two principle methods of monitoring; diffusion tubes and continuous monitoring. Nitrogen dioxide (NO2) and nitric oxide (NO) are both oxides of nitrogen and are collectively referred to as nitrogen oxides (NOx). All combustion processes produce NOx emissions, largely in the form of NO, which is then converted to NO2, mainly as a result of reaction with ozone in the atmosphere. The principle source of nitrogen dioxide within the district is road transport. Particulates are the fraction of suspended airborne particles these small particles can be breathed into the lungs carrying with them a range of both natural and manmade substances. Particulate Matter 10 or PM10 is the fraction of particulate matter less than 10µm (Ten micrometres) in aerodynamic diameter. This comes from a wide range of sources known as primary i.e. combustion processes such as vehicle exhaust emissions, secondary i.e. formed in the atmosphere and course i.e. from suspended soils, dust and construction etc). In Carlisle the dominating sources are likely to be:- Local traffic Resuspension of road dust Agriculture Background PM10 carried from other parts of the UK and continental Europe. The PM2.5 fraction of particulate matter differs from PM10 only in respect of the size of the particles, these particles are much smaller, less than 2.5µm (2.5 micrometres) in aerodynamic diameter. Carlisle City council began measuring PM 2.5 at the Paddy s Market site on 19 th March This is the first part of our review and assessment work that has reported upon the results of these measurements. Benzene is a recognised genotoxic human carcinogen. The main sources of benzene in the UK are petrol engined vehicles, petrol refining and the distribution and uncontrolled emissions from petrol station forecourts without vapour recovery systems. Whilst the local authority does not have any sources within the area which are likely to exceed the objective levels Carlisle has been monitoring benzene since April 2008 as part of the Non Automatic Hydrocarbon Network. Monitoring is undertaken at the Paddy s Market monitoring station using a pumped tube sampler with sorbent tubes containing Carbopack X. Progress Report 16
17 2.1.1 Automatic Monitoring Sites There are two continuous monitoring stations in Carlisle. These are located at Paddy s Market and Stanwix Bank. Pollutant concentrations have been monitored at a roadside site at Paddy s Market in Caldewgate since The pollutants measured include oxides of nitrogen and particulate matter using a Chemiluminescent Analyser and a Tapered Element Oscillating Microbalance (TEOM) respectively. In April 2009 an additional TEOM to measure even smaller sized particles (PM2.5) was installed in Paddy s Market monitoring station by Defra and both TEOM s were upgraded to include a Filter Dynamics Measurement System (FDMS) to allow better equivalence to the objective level. The site is now partly funded by Defra. Parts of the site equipment not funded by Defra including the chemiluminescent analyser belong to the council and are now maintained by Casella Monitor. Since February 2008 the site has been affiliated to the Automatic Urban and Rural Network (AURN) and the network quality assurance and control procedures are implemented. The Stanwix Bank site has been in operation since the beginning of 2007 and measures nitrogen dioxide with a chemiluminescent analyser. The site is operated and maintained by Casella Monitor. Casella has defined quality system, which forms part of the UKAS accreditation that the laboratory holds. Daily data from both monitoring stations is available to the public on the city councils website. Appendix A contains further details on our automatic monitoring including information on co-location study, quality control and quality assurance measures. Progress Report 17


18 Figure 2.1 Maps of Automatic Monitoring Sites. Progress Report 18
19 Table 2.1 Details of Automatic Monitoring Sites Site Name Paddy s Market Stanwix Bank Site Type Roadside Roadside OS Grid Ref X X Y Y Pollutants Monitored NO2, PM 10, PM2.5 NO2 Monitoring Technique Chemiluminescent analyser, TEOM FDMS Chemiluminescent analyser. In AQMA? N Y Relevant Exposure? (Y/N with distance (m) to relevant exposure) N with 42m to relevant exposure N within 15m to relevant exposure Distance to kerb of nearest road 4m 3m Does this location represent worst-case exposure? N N Progress Report 19
20 2.1.2 Non-Automatic Monitoring Benzene The council operates a pumped tube benzene sampler as part of the UK Non- Automatic Hydrocarbon Network. The benzene station is located within the Paddy s Market Unit and has been in operation since April It is entirely funded by Defra. Nitrogen Dioxide Carlisle City operates an extensive network of Nitrogen Dioxide diffusion tubes across the district. Up to the end of January 2009 the council utilised tubes prepared and analysed by Bureau Veritas Labs using 10% triethanolamine (TEA) in water. In February 2009 the council changed suppliers and now utilises tubes prepared with 20% TEA in water prepared and analysed by Gradko Environmental Ltd. For this reason the total monitoring period for our NO2 diffusion tubes in 2009 is 11 months from February 2009 to the end of December Appendix A contains further details on our NO2 diffusion tube analysis including bias adjustment and Quality control measures. The locations of all the diffusion tubes are shown on the map in Appendix D and are listed in the table below: Some of the locations have been highlighted as follows: These monitoring sites are now within the Wigton Road AQMA since its recent extension. These monitoring sites have had details amended due to minor changes of distance to relevant location or reconsidered site type since the Updating and Screening Assessment Progress Report 20
21 Table 2.2 Site Name Details of Non- Automatic Monitoring Sites Site Type OS Grid Ref Pollutants Monitored In AQMA? Relevant Exposure? (Y/N with distance (m) to relevant exposure) Distance to kerb of nearest road Worst-case Location? A1 Roadside NO 2 Y N (4.5) 1.5 Y A10 Roadside NO 2 Y Y A12 Roadside NO 2 N Y 3 Y A5 Roadside NO 2 Y Y 4 Y A7 Roadside NO 2 Y N (7.5) 4 Y A9 Roadside NO 2 Y Y 1.5 Y B12 Kerbside NO 2 N N (2.0) 0.5 Y B3 Roadside NO 2 N Y 9 Y B4 Roadside NO 2 Y Y 3.5 Y B5 Roadside NO 2 N Y 2.5 Y B6 Roadside NO 2 N Y 2.5 Y B7 Roadside NO 2 Y Y 3 Y C1 Roadside NO 2 N Y 3 Y C2 Urban Centre NO 2 N N N C3 Roadside NO 2 N Y 3 Y C4 Roadside NO 2 N Y 9 Y C5 Roadside NO 2 N Y 3 Y D1 Roadside NO 2 N N (8.5) 3.7 Y D10 Roadside NO 2 N Y 5 Y D11 Roadside NO 2 N Y 4.5 Y D12 Kerbside NO 2 N N 5 Y D3 Roadside NO 2 N Y 10 Y D5 Roadside NO 2 N Y 9 Y D7 Roadside NO 2 N Y 7 Y D9 Roadside NO 2 N Y 8.5 Y Progress Report 21
22 Site Name Site Type OS Grid Ref Pollutants Monitored In AQMA? Relevant Exposure? (Y/N with distance (m) to relevant exposure) Distance to kerb of nearest road (N/A if not applicable) Worst-case Location? E22 Roadside NO 2 N Y 12 Y E12 Roadside NO 2 Y N (2) 2.5 Y E15 Roadside NO 2 Y Y 4.5 Y E16 Roadside NO 2 Y Y 2.5 Y E19 Roadside NO 2 Y Y 2.5 Y E20 Roadside NO 2 Y Y 5.5 Y E4 Roadside NO 2 N N(3) 3 Y E6 Roadside NO 2 N N(42) 9 Y E6 Roadside NO 2 N N(42) 9 Y E6 Roadside NO 2 N N(42) 9 Y E8 Roadside NO 2 Y Y 4 Y E9 Roadside NO 2 N Y 9 Y E21 Roadside NO 2 N N (8) 3 Y F1 Roadside NO 2 N Y 3.5 Y F10 Roadside NO 2 N Y 3 Y F5 Roadside NO 2 N Y 3 Y F7 Roadside NO 2 Y Y 4.5 Y F9 Kerbside NO 2 N Y 0.5 Y H1 Roadside NO 2 N N (0.5) 2.5 Y H3 Roadside NO 2 N N (0.5) 2.5 Y H4 Roadside NO 2 N N (0.5) 2.5 Y H5 Roadside NO 2 N Y 1.5 Y H6 Roadside NO 2 N Y 4 Y H7 Roadside NO 2 N Y 6.5 Y H8 Other NO 2 N Y 2 Y Progress Report 22
23 2.2 Comparison of Monitoring Results with Air Quality Objectives Nitrogen Dioxide Automatic Monitoring Data All nitrogen dioxide data shown has been ratified by the AEA group and Casella Monitor. Data in red indicates results that exceed the annual mean objective of 40 g/m 3 Table 2.3a Results of Automatic Monitoring for Nitrogen Dioxide: Comparison with Annual Mean Objective Location Paddy s Market Stanwix Bank Within AQMA? N Y Data Capture for monitoring period % Full year of monitoring Full year of monitoring Data Capture for full calendar year 2009 % Annual mean concentrations ( g/m 3 ) Figure 2.3 Trends in Annual Mean Nitrogen Dioxide Concentration Measured at Automatic Monitoring Sites. The dashed red line on the flow charts indicates the annual mean objective of 40 g/m 3 or 1 hour mean objective of 200 g/m 3 45 Trend chart showing Annual Mean NO2 Concentrations measured at Automatic Monitoring Stations. Paddy s Market Stanwix Bank Annual Mean concentration (µg/m3) Year Progress Report 23
24 The above trend chart indicates that the annual mean at both monitoring sites is now below the annual mean objective level. The Paddys Market roadside unit has remained relatively constant since 2006 whereas the Stanwix Bank unit has seen a more pronounced reduction in NO2 levels since it was installed in Figure 2.4 Results of Hourly Automatic Monitoring for Nitrogen Dioxide during 2009: Comparison with 1-hour Mean Objective at Paddys Market: 220 Graph to show hourly mean NO2 values at Paddys Market monitoring station during (µg/m3) Hourly NO /01/ /01/ /01/ /02/ /02/ /02/ /03/ /03/ /03/ /04/ /04/ /05/ /05/ /05/ /06/ /06/ /06/ /07/ /07/ /07/ /08/ /08/ /09/ /09/ /09/ /10/ /10/ /10/ /11/ /11/ /11/ /12/ /12/2009 Max 189 Min 0 Annual mean The graph above shows that there were no recorded exceedences of the 1 hour mean objective for Nitrogen Dioxide during The highest reading at the Paddys Market site was 189µg/m3. This occurred on a day when the unit recorded unusually high concentrations in relation to the previous and next days. Progress Report 24
25 Figure 2.5 Results of Hourly Automatic Monitoring for Nitrogen Dioxide during 2009: Comparison with 1-hour Mean Objective at Stanwix Bank: Graph to show hourly mean NO2 values at Stanwix monitoring station during (µg/m3) Hourly NO2 01/01/09 12/01/09 23/01/09 03/02/09 14/02/09 25/02/09 08/03/09 19/03/09 30/03/09 10/04/09 21/04/09 02/05/09 14/05/09 25/05/09 05/06/09 16/06/09 27/06/09 08/07/09 19/07/09 30/07/09 10/08/09 21/08/09 01/09/09 12/09/09 24/09/09 05/10/09 16/10/09 27/10/09 07/11/09 18/11/09 29/11/09 10/12/09 21/12/09 Max 152 Min 0.5 Annual mean 34.6 The data above shows that there were no recorded exceedences of the 1 hour mean objective for Nitrogen Dioxide during The highest reading at the Stanwix Bank site was 152 µg/m3. The 200 µg/m3 1 hour mean objective for Nitrogen Dioxide should not be exceeded more than 18 times per year, neither of our monitoring sites showed any exceedence throughout the year. Progress Report 25
26 Table 2.3b Results of Automatic Monitoring for Nitrogen Dioxide: Comparison with 1-hour Mean Objective Location Within AQMA? Data Capture for monitoring period % Data Capture for full calendar year 2009 % Number of Exceedences of hourly mean (200 g/m 3 ) Paddy s Market N Full year Stanwix Bank Y Full year Diffusion Tube Monitoring Data: Table 2.4 Results of Nitrogen Dioxide Diffusion Tubes For 2009 the annual mean for each diffusion tube location has been adjusted using the national bias adjustment factor of (See appendix A for details) Site ID Location Within AQMA? Data Capture for 11 months monitoring period % Data Capture for full calendar year 2009 % Annual mean concentrations ( g/m 3 ) Adjusted for bias A1 45 SCOTLAND RD A10 STANWIX BANK A12 14 ETTERBY ST x A5 37 KINGSTOWN RD A7 282 KINGSTOWN RD A9 BRAMPTON RD B12 DENTON ST x B3 SHADDONMILL x B4 DALSTON RD B5 8 JUNCTION ST x B6 41 CHARLOTTE ST x B7 12 CURROCK ST C1 LOWTHER ST x C2 TOURIST INFO x C3 DEVONSHIRE ST x C4 BAR SOLO x C5 GRIFFEN x D1 VICTORIA PLACE x D WARWICK RD x D11 CARTREF x D12 POST OFFICE x D3 166 WARWICK RD x D5 215 WARWICK RD x D7 282 WARWICK RD x D9 251 WARWICK RD x Progress Report 26
27 E22 FINKLE ST x E12 3 WIGTON RD x E15 22 WIGTON RD x E16 JOVIAL SAILOR x E19 49 WIGTON RD E20 44 WIGTON RD E4 JOHN ST x E6 PADDYS MARKET 1 x E6 PADDYS MARKET 2 x E6 PADDYS MARKET 3 x E8 BRIDGE ST E9 CHURCH ST x E21 BURGH RD x F1 3 TAIT ST x F BOTCHERGATE x F5 STANLEY HALL x F7 24 LONDON RD F9 129 LONDON RD x H1 BRAMPTON x H3 LONGTOWN x H4 WARWICK BRIDGE x H5 WIGTON RD x H6 PETER LANE x H7 DALSTON RD x H8 AIRPORT x None of the diffusion tube annual means for 2009 exceed 60 g/m 3. An annual mean level of 60 g/m 3 is the equivalent indicator level for the likelihood of exceedence of the hourly mean objective of 200 g/m 3. All of the results are below 60 g/m 3 and it can therefore be concluded that there has been no indication of any exceedence of the hourly mean objective. This supports the readings taken by both automatic monitoring stations. Trends in Annual Mean Nitrogen Dioxide Concentration Measured at Diffusion Tube Monitoring Sites. The diffusion tube locations across the district are divided into relevant areas of the city, the areas include A, B, C, D, E, F and H. The following looks at each area individually it includes a map indicating the location of each tube in that area, a table showing the last 5 years of annual mean NO2 concentrations and a trend chart displaying this data. Results in (brackets) indicate calculated annual mean for locations that are not relevant to public exposure. It represents a prediction of the Annual mean NO2 concentration at the nearest relevant receptor to the monitoring location. Data shown in red indicates a result that exceeds the annual mean objective of 40 g/m 3 Progress Report 27

28 Area A A7 Stanwix Bank, Scotland Rd and Kingstown Rd (AQMA No1) Figure 2.6 Map of diffusion tube locations in area A. Table 2.5 NO 2 diffusion tube results at monitoring locations in area A. ANNUAL MEAN CONCENTRATIONS SITE ID A1 A10 A12 A5 A7 A9 LOCATION 45 SCOTLAND RD STANWIX BANK 14 ETTERBY ST 37 KINGSTOWN RD 282 KINGSTOWN RD BRAMPTON RD WITHIN AQMA? ADJUSTED FOR BIAS ADJUSTED FOR BIAS ADJUSTED FOR BIAS ADJUSTED FOR BIAS ADJUSTED FOR BIAS (43.4) 46.3 (35.8) (44.8) x (28.3) 31.4 (26.4) Progress Report 28
 that remain above the NO2 annual mean objective level. There is therefore no proposal to amend this AQMA at this stage.")

29 Figure 2.7 Chart showing NO2 diffusion tube trends at monitoring locations in area A. Results indicate that there are still sites within AQMA (No1) that remain above the NO2 annual mean objective level. There is therefore no proposal to amend this AQMA at this stage. Results from the diffusion tubes indicate that the NO2 concentrations have continued to fall since 2007 at most locations. Tube number A7 showed a slight increase from 2008 however is still below the objective. Tube A1 remained virtually the same however the predicted level at the nearest receptor is below the objective level. Results from the continuous analyser on Stanwix bank support the reduction in NO2 annual mean from last year The introduction of the CNDR (now scheduled for 2012) will bring about a substantial reduction in traffic flows along this route, as a result of the expected reduction in traffic nitrogen dioxide, results are likely to fall below the objective level. Results indicate that there are no locations within this area that are at risk of exceeding the 1 hour mean objective level for nitrogen dioxide this is also supported by results from the automatic monitoring site in this area. Progress Report 29

30 Area B Currock St, Victoria Viaduct, Charlotte St, Junction St and Dalston Rd (Includes AQMA No2 and No5) Figure 2.8 Map of diffusion tube locations in area B Table 2.6 NO 2 diffusion tube results at monitoring locations in area B. ANNUAL MEAN CONCENTRATIONS SITE ID LOCATION WITHIN AQMA? ADJUSTED FOR BIAS ADJUSTED FOR BIAS ADJUSTED FOR BIAS ADJUSTED FOR BIAS ADJUSTED FOR BIAS B12 DENTON ST x (25.9) 38.3 (35) B3 SHADDONMILL x B4 DALSTON RD B5 8 JUNCTION ST x B6 B7 41 CHARLOTTE ST 12 CURROCK ST x Progress Report 30

31 Figure 2.9 Chart showing NO2 diffusion tube trends at monitoring locations in area B. Diffusion tube results indicate that NO2 concentrations at all locations along this main traffic thoroughfare have fallen from the previous year. Further Assessment work undertaken in 2007 by AEA consultants predicted that nitrogen dioxide levels along Currock St (AQMA No2) would fall below the annual mean objective level by 2010.The report is available on the council s website. The result for 2009 shows that the annual mean from site B7 (AQMA 2) has now fallen to just below the objective level and this reduction is expected to continue. Site B12 has now fallen below the objective level. Dalston road remains the only site in this area above the objective however this location has seen a substantial reduction in NO2 annual mean from last year. The City and County are working together to introduce action measures that will reduce nitrogen dioxide levels along Dalston Rd (AQMA No5). The revised Action Plan will be available in Results indicate that there are no locations within this area that are at risk of exceeding the 1 hour mean objective level for nitrogen dioxide. Progress Report 31

32 Area C City Centre Locations Figure 2.10 Map of diffusion tube locations in area C Table 2.7 NO 2 diffusion tube results at monitoring locations in area C. ANNUAL MEAN CONCENTRATIONS SITE ID LOCATION WITHIN AQMA? ADJUSTED FOR BIAS ADJUSTED FOR BIAS ADJUSTED FOR BIAS ADJUSTED FOR BIAS ADJUSTED FOR BIAS C1 LOWTHER ST x C2 C3 TOURIST INFO DEVONSHIRE ST x x C4 BAR SOLO x C5 GRIFFEN x Progress Report 32

33 Figure 2.11 Chart showing NO2 diffusion tube trends at monitoring locations in area C. Tube C1 is the only location in this area that is in a residential area, for this reason it is the only location that should be compared to the annual mean objective of 40µg/m 3. The data clearly shows that this has not been exceeded. Tubes C3 C5 cover the main shopping/outdoor cafe areas within the centre of Carlisle. Results from these tubes should only be compared to the 1 hour mean objective level for nitrogen dioxide which is equivalent to an annual mean of 60µg/m 3. This is due to likelihood of people spending longer periods of time in these areas, for example drinking and dining outdoors. All are considerably below this objective level therefore there no need to proceed to a Detailed Assessment. Tube C2 is located in a pedestrian precinct in the heart of the city centre. The area is primarily used for shopping this represents an urban centre reading for NO2 concentration. Progress Report 33

34 Area D A69 Warwick Rd Figure 2.12 Map of diffusion tube locations in area D. Table 2.8 NO 2 diffusion tube results at monitoring locations in area D. ANNUAL MEAN CONCENTRATIONS SITE ID LOCATION WITHIN AQMA? ADJUSTED FOR BIAS ADJUSTED FOR BIAS ADJUSTED FOR BIAS ADJUSTED FOR BIAS ADJUSTED FOR BIAS D1 D10 VICTORIA PLACE 368 WARWICK RD x (29.5) 27.1 (23.6) x D11 CARTEF x D12 D3 D5 D7 D9 POST OFFICE 166 WARWICK RD 215 WARWICK RD 282 WARWICK RD 251 WARWICK RD x x x x x Progress Report 34

35 Figure 2.13 Chart showing NO2 diffusion tube trends at monitoring locations in area D. Again nitrogen dioxide levels in 2009 have fallen from the previous year. This trend has continued at all locations since Tube D12 has also fallen from the previous year and is now on the borderline of the objective. This however this is not a relevant location i.e. it is not adjacent to residential property and there is therefore no need to proceed to a Detailed Assessment. All other locations have annual mean concentrations that are considerably below the objective level. Results indicate that there are no locations within this area that are at risk of exceeding the 1 hour mean objective level for nitrogen dioxide. Progress Report 35

36 Area E - A595 Caldewgate, Wigton Rd and Newtown Rd ( includes AQMA No3 and AQMA No4) Figure 2.14 Map of diffusion tube locations in area E. Table 2.9 NO 2 diffusion tube results at monitoring locations in area E. SITE ID LOCATION WITHIN AQMA? ANNUAL MEAN CONCENTRATIONS ADJUSTED FOR BIAS ADJUSTED FOR BIAS ADJUSTED FOR BIAS ADJUSTED FOR BIAS ADJUSTED FOR BIAS E22 FINKLE ST x E12 E15 E16 E19 E20 3 WIGTON RD 22 WIGTON RD JOVIAL SAILOR 49 WIGTON RD 44 WIGTON RD (41.5) 44.4 (41.8) E4 JOHN ST x (37.8) 35.7 (34.1) E6 E6 E6 PADDYS MARKET 1 x (28.6) 31.5 PADDYS MARKET 2 PADDYS MARKET 3 x (29.6) 33.3 x (31.0) 31.6 E8 BRIDGE ST E9 CHURCH ST x E21 BURGH RD x (15.5) 18.7 (16.1) Progress Report 36

37 Figure 2.15 Chart showing NO2 diffusion tube trends at monitoring locations in area E. Again NO2 concentrations in 2009 along this main traffic route are lower than the previous year for all locations with only two exceptions: Tube E21 is located near the edge of the city and the annual mean is still below half of the objective level. One of the triplicate tubes located on the Paddys Market continuous analyser also showed a very slight increase in NO2 annual mean concentration compared to Some locations within the AQMAs nos.3 and 4 still remain above the objective level. The Updating and Screening Assessment 2009 identified several relevant locations immediately outside the original AQMA No3 on Wigton Rd and Caldcotes which were above the objective level in 07/08. These are essentially along the traffic routes leading up to the Caldewgate roundabout. Further Assessment work has been undertaken which confirmed that it will be necessary to extend the AQMA No3 to cover these locations. DEFRA were consulted and supported the decision to extend the AQMA, the map above shows the new boundaries. Four locations that were previously above the objective in 2008 have now fallen below 40µg/m 3 in 2009, some of which are located within AQMA 3. All of these measurements remain above 35µg/m 3 and the change could be the result of meteorological variation. For these reasons the same locations will continue to be monitored and there are no plans to further amend the AQMA. Results from the continuous analyser at Paddys Market support the overall reduction in NO2 annual mean from last year, in this area. Results indicate that there are no locations within area E that are at risk of exceeding the 1 hour mean objective level for nitrogen dioxide, this is also supported by results from the automatic monitoring site. Progress Report 37

38 Area F A6 London Road / Botchergate (AQMA No6) Figure 2.16 Map of diffusion tube locations in area F. Table 2.10 NO 2 diffusion tube results at monitoring locations in area F. ANNUAL MEAN CONCENTRATIONS SITE ID LOCATION WITHIN AQMA? ADJUSTED FOR BIAS ADJUSTED FOR BIAS ADJUSTED FOR BIAS ADJUSTED FOR BIAS ADJUSTED FOR BIAS F1 3 TAIT ST x F BOTCHERGATE x F5 STANLEY HALL x F7 24 LONDON RD F9 129 LONDON RD x Progress Report 38

39 Figure 2.17 Chart showing NO2 diffusion tube trends at monitoring locations in area F. Results show that nitrogen dioxide levels in 2009 have fallen from the previous year at every location. This is a trend which has continued at most locations since All locations are now below the objective level. Tube F7 is within AQMA No.6 and results indicate that nitrogen dioxide levels have fallen further below the objective level at this site. Should nitrogen dioxide levels remain below the objective level or continue to fall in subsequent years consideration will be given to revoking the AQMA at this location. Results indicate that there are no locations within this area that are at risk of exceeding the 1 hour mean objective level for nitrogen dioxide. Progress Report 39
 18.7 (18.")
40 Area H Outskirts of City, Townships and Airport Table 2.11 NO 2 diffusion tube results at monitoring locations in area H. SITE ID LOCATION WITHIN AQMA? ANNUAL MEAN CONCENTRATIONS ADJUSTED FOR BIAS ADJUSTED FOR BIAS ADJUSTED FOR BIAS ADJUSTED FOR BIAS ADJUSTED FOR BIAS H1 BRAMPTON x (20.3) 18.7 (18.2) H3 LONGTOWN x (22.4) 21.5 (20.8) H4 WARWICK BRIDGE x (34.5) 31.8 (30.8) H5 WIGTON RD x H6 PETER LANE x H7 DALSTON RD x H8 AIRPORT x Figure 2.18 Chart showing NO2 diffusion tube trends at monitoring locations in area H. Tubes H1 & H3 are located in the next two largest centres of population outside Carlisle. Both locations have shown a steady reduction in NO2 since 2007 and both are now showing concentrations at around half of the objective level. Tubes H4 H8 are located on the outskirts of the city. Since these tubes were installed all have shown a reduction from 2008 to 2009 Results from all of these sites indicate that the nitrogen dioxide levels are significantly below the objective levels for nitrogen dioxide and there is no risk of exceeding the 1 hour mean objective level for nitrogen dioxide. Progress Report 40
41 2.2.1 PM 10 The TEOM analyser at Paddys Market was upgraded using a Filter Dynamics Measurement System (FDMS) on 18 th March 2009, for this reason the PM10 data presented here was collected from 19 th March 2009 to 19 th January 2010, this 10 months of data can be more accurately used to compare the collected PM10 concentrations with the air quality objectives. More information on this change can be found in Appendix A. All PM10 data up to 31 st December 2009 has been ratified by AEA Group. The PM10 objective for England is an annual mean of 40 g/m 3. There is also a 50 g/m 3 24 hour mean not to be exceeded more than 35 times per year. Table 2.12a Results of PM 10 Automatic Monitoring: Comparison with Annual Mean Objective Location Within AQMA? Data Capture for monitoring period % Data Capture for full calendar year 2009 % Annual mean concentrations ( g/m 3 ) Paddy s Market N The current annual mean for the study period at Paddys Market is clearly well below the objective level, it is below that of 2008 and appears to continue a downward trend since This is the first ten months of data that has been collected using the FDMS equipment, which should have a higher level of accuracy. Table 2.12b Results of PM 10 Automatic Monitoring: Comparison with 24-hour Mean Objective Location Within AQMA? Data Capture for monitoring period a % Data Capture 2009 b % Number of Exceedences of daily mean objective (50 g/m 3 ) c 2008 c 2009 c Paddy s Market N It is clear from this data that the number of exceedences of the 24 hour mean during the study period is considerably lower than the objective level of 35 times per year. Progress Report 41
42 Figure 2.19 Chart to Show Results of PM 10 Automatic Monitoring: Comparison with 24-hour Mean Objective: 80 Daily Mean PM10 levels at Paddys Market during PM10 Daily Mean 70 ( g/m 3 ) Annual mean concentrations ( /03/09 26/03/09 02/04/09 09/04/09 16/04/09 23/04/09 30/04/09 07/05/09 14/05/09 21/05/09 28/05/09 04/06/09 11/06/09 18/06/09 25/06/09 02/07/09 09/07/09 16/07/09 23/07/09 30/07/09 06/08/09 13/08/09 20/08/09 27/08/09 03/09/09 10/09/09 17/09/09 24/09/09 01/10/09 08/10/09 15/10/09 22/10/09 29/10/09 05/11/09 12/11/09 19/11/09 26/11/09 03/12/09 10/12/09 17/12/09 24/12/09 31/12/09 07/01/10 14/01/10 Date The data above shows that although the 50 g/m 3 objective has been exceeded 7 times during the year there is no exceedence of the overall 24 hour mean objective for PM Benzene Carlisle has been monitoring benzene since April 2008 as part of the Non Automatic Hydrocarbon Network. The Objective level for benzene is 5 g/m 3 measured as an annual mean, to be achieved by December All Benzene data shown has been ratified by the National Physical Laboratory. Location Within AQMA? Data Capture Data Capture for full calendar for monitoring year period 2009 % % Running Annual mean concentrations ( g/m 3 ) Paddy s Market N Full Year This data shows that the annual mean is similar to that of 2008 and is considerably below the objective level. The site is also 42 metres away from the nearest relevant public exposure. Progress Report 42
43 2.2.3 Other pollutants monitored Carlisle City council began measuring PM 2.5 at the Paddy s Market site on 19 th March This is the first part of our review and assessment work that has reported upon the results of these measurements. For this reason the % Data Capture for 2009 is only 81.8, however the monitoring period for this study is ten months, from 20 th March 2009 to 20 th January 2010, to give an indication of the measurements taken to date. All PM2.5 data up to 31 st December 2009 has been ratified by AEA Group. Location Within AQMA? Data Capture for monitoring period a % Data Capture for full calendar year 2009 b % Annual mean concentrations ( g/m 3 ) 2009 c Paddy s Market N The PM2.5 objective for England is an annual mean of 25 g/m 3, to be achieved by There is also an exposure reduction target of 15% (measured as a 3-year mean) between 2010 and 2020, applicable at urban background locations. The current ten month study period mean at Paddys Market is clearly well below this objective level. We will continue to monitor PM 2.5 at this location and report the findings, as more data is collected any trends should become apparent Summary of Compliance with AQS Objectives Carlisle City has examined the results from monitoring in the district. Concentrations outside of the AQMA s are all below the objectives at relevant locations, therefore there is no need to proceed to a Detailed Assessment. Progress Report 43
44 3 New Local Developments Defra guidance requires that details of new local developments, that might affect local air quality, are included in the Progress Report. These are considered under the following categories: 3.1 Road Traffic Sources There have been a number of minor changes to roads in the district, in particular changes to junctions to allow increased traffic flows associated with new developments or to reduce the volume of standing traffic. The following summarises the changes since the last Updating and Screening Assessment in 2009: There are no new narrow congested streets with residential properties close to the kerb. There are no new busy streets where people may spend one hour or more close to traffic. There are no new roads with a high flow of buses and/or HGVs. There are no new bus or coach stations. There are no roads with significantly changed traffic flows since April 2009 however some improvement works have begun on two roads in an attempt to improve traffic flows these include: o Lowther Street - Alterations to the bus lane and lane markings. The scheme aims to improve bus movements, reduce queuing to the Lanes and Lowther Street car parks and to reduce the amount of through traffic on Lowther Street by encouraging vehicles to go via Lonsdale Street and Warwick Road and reduce congestion on Victoria Place. This was completed in June 2010 therefore the results of the changes are yet to be seen. o Castle Street scheme - this started on site in early June. The scheme aims to improve the area for pedestrians. Part of the scheme has reduced the on street car parking provision and it is hoped that the scheme will help to reduce the amount of traffic that currently circulates on Castle Street / Fisher Street and St Mary's Gate. There have been new developments to two road junctions within the city these include: o London Road - alterations to junctions to accommodate a new development (Aldi). This has widened the Petteril Bank Road / London Road junction to reduce the amount of traffic queuing at the junction. Works also include bus stop lay-bys, which will reduce the amount of traffic queuing behind a bus while passengers board / alight. o Lowry Hill / Kingstown Road junction - improvements to the signals to provide a right turn lane on Kingstown Road for vehicles turning into Lowry Hill and a left turn lane from Lowry Hill to Kingstown Road. These Progress Report 44
45 alterations to the lane markings associated with the implementation of part time signals will reduce the amount of queuing traffic. As discussed in previous rounds of review and assessment there has been one major new road development, the CNDR, construction has commenced on this since the Updating and Screening Assessment Due to unexpected delays the new completion date for this city bypass is It is expected that this will improve overall air quality within the city in particular our two largest AQMA s No.1 (A7) and No.3 (Wigton Road). There are no other new roads constructed or proposed since updating and screening assessment in 2009 except minor roads associated with new residential developments. 3.2 Other Transport Sources As well as road vehicles, public exposure to emissions from planes, buses, trains, ships etc must also be considered. The following summarises the changes since the last updating and screening assessment in 2009: There are no new locations where diesel or steam trains are regularly stationary for periods of 15 minutes or more, with potential for relevant exposure within 15m. There are no new locations with a large number of movements of diesel locomotives, and potential long-term relevant exposure within 30m. Carlisle City has no ports for shipping. Carlisle City does have an airport in the district. As discussed in previous rounds of review and assessment there have been applications made to develop this to include a haulage depot, offices and expansion of the airport itself. The planning application was recently refused, on appeal, in court. Essentially the airport itself remains unchanged since April 2009 and it still operates as a small runway for light passenger/pleasure aircraft. Any changes to the airport will be reexamined in the next round of review and assessment. 3.3 Industrial Sources For the purpose of this section of the report it is necessary to look at new or changed industrial sources of air pollution. The following summarises the changes since the last updating and screening assessment in 2009: There are no new or proposed installations for which an air quality assessment has been carried out. There are no existing installations where emissions have increased substantially or new relevant exposure has been introduced. There are no new or significantly changed installations without a previous air quality assessment. Progress Report 45
46 There are no new major fuel storage depots storing petrol. There are no new Petrol stations. There is one newly permitted poultry farm since April 2009 this has been established in a rural area on Bow farm near Moorhouse village. The two broiler sheds were built in 2004 and have the capacity to house broiler chickens for meat production. As part of the permit application comprehensive management plans were submitted including fugitive release, noise and odour. The permit, granted by the Environment Agency, was effective from 21/12/09. Two other free range poultry facilities have been granted permission by the planning department; one at Broomhills on Orton Road (12000 birds) and another at Thorneyland, Easton (8000 birds) both are intended for free range egg production. Neither facility required an Environmental Permit under the Environmental Permitting Regulations 2007 as the proposal does not meet the 40,000 poultry places threshold. 3.4 Commercial and Domestic Sources For the purpose of this section of the report it is necessary to look at new or changed commercial & domestic sources of air pollution. The following summarises the changes since the last updating and screening assessment in 2009: There are no new individual biomass combustion plants. There are no new areas where the combined impact of several biomass combustion sources may be relevant. There are no new areas where domestic solid fuel burning may be relevant. Carlisle City confirms that there are no new or newly identified local developments which may have an impact on air quality within the Local Authority area. 3.5 New Developments with Fugitive or Uncontrolled Sources There are no new landfill sites. There are no new quarries. There are no new unmade haulage roads on industrial sites. There has been one new waste transfer station established in the district since April Brampton Skips is a skip hire and waste sorting facility at Kingmoor Park. It is situated on an industrial estate near Rockliffe, 4-5 miles outside of the city. There are no other new potential sources of fugitive particulate emissions. Progress Report 46
47 4 Planning Applications Since 1 st April 2009 Carlisle City has received a number of applications for a whole range of new developments, most of which are small and insignificant in terms of air quality impacts however there are also a number of major new developments that are currently being considered by the planning department. Details of these are given below: Morton Development Development of land for Maximum 852 residential dwellings M2 of floor space used for employment such as offices and warehousing as well as public open space areas. It is also expected that plans will be received to include a supermarket and petrol station with associated parking. This development is proposed for open land at Morton bounded by Peter Lane, Wigton Road and Dalston Road. It would be located right on the edge of the city to the West in an area which is currently mainly residential. See appendix F for map. An Air Quality Impact Assessment as been requested and Environmental Health are currently working with the consultants as to the scope of this assessment. Tube H5 was placed on the roadside at the proposed entrance to the site in 2008 when the site application was first rumoured. Since then the annual mean for NO2 at this location has been considerably below the objective. Other tubes that have been positioned adjacent to the site include H6 and H7 both of which are also consistently well below half of the objective. The air quality impacts are uncertain in that traffic flow along Wigton Road (AQMA 3) could increase due to the increase in population in the area but at the same time the supermarket would have a large catchment in the west and rural areas reducing the need for journeys into the city centre for shopping purposes. The site entrance is planned to be right next to a junction onto the CNDR which is likely to direct much of the traffic flow around the city bypass. Crindledyke Development Proposed development of a maximum of 950 residential properties, ancillary local community facilities including a school, a community building and open public space. The total area of the site is hectares. This development is proposed for open land at Crindledyke bounded by the North West mainline, the M6 and Kingmoor industrial estate. It would be located in an area which is semi rural farmland to the North West of the city. See appendix F for map. An Air Quality Impact Assessment as been submitted as part of an Environmental Impact assessment, this was considered unsatisfactory as it did not take into consideration the combined impacts of other new local developments. Environmental Health is currently working with the planning department to assess the suitability of the amended assessment. Progress Report 47
48 Caldewgate Development The proposed erection of a class A1 food store comprising 8886 M 2 gross external area and a 5514 M 2 Net Sales floor space. It also includes a petrol filling station of 132 M2 gross external floor space and 70M 2 net sales, ancillary development and some car parking. This development is proposed for a brown field site at the junction of Bridge Street and Bridge Lane in Calewgate, the application is due to go to committee on 16 th July 2010 with the recommendation for approval. See appendix F for map. An Air Quality Impact Assessment as been submitted and considered by Environmental Health and our private consultants AEA Technologies, it was deemed that the air quality impact of the development would be negligible despite the fact that it is to be located just outside AQMA 4 (Bridge Street). It is expected that this development will go ahead. There are also a number of other applications that have been received since April 09 and have subsequently been granted permission or are in the process of being granted permission by the planning department. These include: Richard Rose Morton Academy development Planning has granted permission for an extension to the Richard Rose Morton Academy. This includes demolition of parts of the academy, improved sports facilities and the erection of a new academy for 1150 students. The vehicular entrance is also to be relocated. The academy is located close to the edge of the city to the South West, in a location bounded by Wigton Road, Queensway and Haycock Lane. See appendix F for map. An Air Quality Impact Assessment was not requested partly because Environmental Health was not consulted at the planning stage however it would appear that the changes are mainly intended to improve facilities. The overall increase in the number of students is likely to be minor however there is expected to be more vehicle movements to and from the site on evenings and weekends. Denton Business Park development. The authority is set to grant permission for the demolition of former storage and workshop buildings and the erection of new buildings to house 40 craft/art workshop units, retail facilities, admin support and performance areas. Plans include 196 student bedrooms which may also be used by the occupants of craft/workshop units. It also proposes the creation of 2 additional flats, alterations to two other flats and facade alterations to Denton Street. The proposed site is in the Denton Holme area, just outside the city centre to the south, on a brownfield site bounded by Denton Street, Lorne Street and Milbourne Street. See appendix F for map. It is to have good cycle connections with the city s improved cycle path network and due to the location there are very few parking spaces. It is not anticipated that the student dwellings will have an impact on traffic flow in the area and due to the road layout the effects of the development on any of our AQMA s is likely to be negligible. Progress Report 48
49 5 Air Quality Planning Policies The Environmental Health department and Planning department continue to work closely to discuss the potential air quality impacts of new developments. In 2006 we produced a local guidance document, Air Quality and Land use planning 2006, this is aimed primarily at applicants where proposed developments may affect air quality through attracting significant numbers of road vehicles. It is also relevant where there is likely to be significant emissions from a particular industrial or commercial source. It outlines the key trigger values that have been developed to assist in deciding whether an Air Quality Impact Assessment (AQIA) is required as part of a planning application. This supplements the NSCA guidance Development Control: Planning for Air Quality this is updated guidance from 2006 and deals with air quality concerns within the development control process. Both documents are closely followed to ensure that there is a clear understanding of best practice in both Environmental Health and Planning. In the event that an AQIA is required we endeavour to work closely with any private consultants involved, from an early stage, to help specify the extent of investigation that is required. This usually involves detailed consideration into the potential impacts on our declared AQMA s. Once the AQIA is submitted to us we can evaluate its findings and suitability before presenting it to our own independent consultants AEA Technologies for their views. We can then make informed comments to the planning department as necessary; these can then be considered when planning conditions are drawn up. Progress Report 49
50 6 Local Transport Plans and Strategies The County has developed Local Transport Plan (2005/6-2010/11) this is the most up to date plan however an updated plan should be available in time for future rounds of review and assessment. The following are some of the measures detailed within the LTP that relate to bringing about air Quality improvements: The key priorities in Carlisle are addressing transport and movement issues that limit economic vitality and growth in the City of Carlisle and improving accessibility in the rural parts of the district. The city is identified as a regional centre for economic growth. The approach in Carlisle is to work effectively with the Carlisle Renaissance initiative to support the new development opportunities and to implement the Carlisle Northern Development Route. Measures will be implemented to assist public transport, cycling and walking in the city. Ways of improving access to essential services from the rural areas will be based on developing demand responsive transport measures and opportunities presented by the Tyne Valley Line. Congestion issues: Journey times on the radial routes in and out of the city can be long and unpredictable due to traffic congestion at key locations at peak times. Bus services within and through the city suffer from unreliability and extended journey times in the morning and afternoon peaks because of this. Travel to work and school by car are seen as the major causes of congestion in Carlisle. The Carlisle Northern Development Route (CNDR) will provide an opportunity to reduce some traffic congestion in the city centre and lock in these benefits by giving greater priority to access by bus, walking and cycling. There is an opportunity to reduce congestion through provision of bus priority measures including Park and Ride on the A69, A595, A7 and A6 radial routes, complementing the CNDR. In addition, implementing a smarter choices programme would combine physical infrastructure measures with softer publicity and awareness measures to influence travel behaviour and reduce congestion through transfer of trips from car to bus, cycling and walking. Public transport connections for rural communities into Carlisle, Brampton and Longtown will be enhanced through further development of the already successful Carlisle Rural Wheels project. City bus routes with highest potential for passenger growth identified in partnership with Stagecoach North West will receive priority for raised kerbs and bus boarders at bus stops to create Quality Bus Routes. Partnership with Stagecoach will ensure that low floor vehicles are directed to these routes alongside better signing and road marking, and timetable information. Similar improvements will be made at important individual bus stops, for instance where demand responsive services such as Carlisle Rural Wheels converge on the scheduled network. The council will continue to support the Community Minibus scheme in Carlisle Area. It will develop Carlisle Ring and Ride to provide transport opportunities for people in the city who cannot use conventional public transport because of disability. Progress Report 50
51 The urban cycle networks for Carlisle has been defined and Longtown and Brampton will follow and measures to fill gaps will be prioritised to encourage cycling to work and school. The council will seek to facilitate improvements to longer distance national and regional recreational cycling routes where these coincide with the urban network. Reallocation of highway space on some of the radial routes and within the city centre to cycles and pedestrians will be part of the measures implemented to maximise the benefits to the city of the CNDR. Work will be carried out to develop priority bus routes on the radial routes into and out of the city on the A6 London Road, A7 Scotland Road and A595 Wigton Road. Combined with a smarter choices programme, this would maximise the impact upon modal choice and congestion. The council will help and promote developing Work Travel Plans with the major employers and clusters of employers including Kingmoor Park and the councils, hospitals and colleges. Improved access to the Kingmoor Park employment from residential areas and the city centre site by all modes will be a priority. Mobility Plans will be prepared for Carlisle, Longtown and Brampton within this Plan period in order to progressively remove barriers for all transport users, taking particular account of the needs of people with impaired mobility. The focus will be on pedestrian links between the rail stations and main bus stops, car parks and town centre facilities. The Cumbria Disability Network will be a key partner in helping to provide user perspective and advice on accessibility and mobility. In Carlisle Area the aim is to provide for the transport needs of economic growth and regeneration where appropriate. This involves improving access generally to West Cumbria while reducing the impact of traffic and enhancing the environment of town centres and sensitive rural areas on the routes, where greater priority will be given to vulnerable road users. Measures to improve access to Carlisle Airport and to help the development of employment opportunities there will be considered as required. A South-Eastern Environmental Route has long been sought to complete a ring road around the city once the CNDR is in place. This proposal will be considered in the context of access to North West Cumbria from the M6 and the problems of lorry movements. Key measures for implementation within Plan period Nelson bridge junction The Nelson Bridge scheme undertaken in 2005/6 is now complete; this relieves city centre traffic congestion at peak times at a key pinch point on the through traffic network. The scheme incorporates improved pedestrian and cycle facilities as well as more efficient traffic flow, reducing air pollution due to traffic. Bus route and real time information This scheme has been developed in partnership with Stagecoach North West to provide real-time bus information at stops in the city centre and on route to the infirmary. The scheme develops a pilot system trialled in 2005/6 and is linked with the Urban Bus Challenge project in the city. Progress Report 51
52 Quality bus routes in Carlisle Investment to provide better bus route infrastructure will be prioritised on those city routes identified jointly with operators that will give the best patronage growth. Passenger waiting facilities and bus service information will be improved throughout the identified routes. Raised kerbs and bus boarders will be provided to improve bus accessibility, particularly for mobility impaired users. These measures will assist in reducing road congestion by making buses more attractive, convenient and accessible, and through this will continue to underpin commercial bus operation in the city. This measure has been implemented and the extent of which will be detailed in LTP3. Cycling and Walking measures in Carlisle Carlisle Renaissance and School and Work Travel Plans are identifying small scale improvements that improve permeability of the city centre on foot and bicycle. These will contribute to model shift and consequent public health and environmental benefits as well as assisting in developing a public realm that supports an economy reflecting the City s regional status. Measures have been implemented and improvements have been reported by County. Additional measures identified for investigation by LTP 2: 1 The traffic issues identified as a priority in Carlisle City require a strategic assessment of parking provision and management including park and ride opportunities and the needs of coaches, to ensure the city can make its contribution to the economy in future. The Carlisle Renaissance initiative, the City and the chamber of commerce will be key stakeholders and partners in this assessment. 2 Improvements to the public transport network in Carlisle to achieve LTP targets and tackle congestion require identification and evaluation of options for central interchange arrangements. 3 The strategic transport requirements identified in the Spatial Strategy for access to North West Cumbria, together with the traffic congestion and environmental quality priorities in the City require an assessment of options for rerouting local through traffic to avoid the city centre. Carlisle Renaissance identifies this as critical to achieve economic development. Options would need to include alternative routes for the South West sector. Progress Report 52
53 7 Climate Change Strategies The council has in place three key documents relating to climate change these are summarised as follows: In the Nottingham Declaration the council acknowledges the occurrence of climate change and it outlines the councils commitment from the 15 th January 2007 to, amongst other things, achieve a significant reduction of greenhouse gas emissions from our own authority's operations. It identifies key areas where this can be achieved including energy sourcing and use, travel and transport, waste production and disposal and the purchasing of goods and services. The declaration shows commitment to working with central government to contribute, at a local level, to the delivery of the UK Climate Change Programme, the Kyoto Protocol and the target for carbon dioxide reduction by The document is signed by the council s Chief Executive, Leader of the, the Minister of State for Climate Change and the Environment (DEFRA) as well as the Parliamentary Under Secretary of State (DCLG) As part of Carlisle City s Carbon Management Programme the Carbon Management Plan (CMP) was introduced in 2008 and is due to be reviewed in April The plan was developed with the Carbon Management Trust in order to meet the following objectives: Lead by example in reducing carbon emissions in the Carlisle area Reduce energy and fuel consumption and expenditure on bills Meeting legislative and government requirements through the performance framework Embed fuel and energy efficiency into the s corporate culture and working practices Allocate roles and responsibilities for reducing carbon emissions Support our partners Carlisle Leisure Limited and Community Centres in delivering carbon reductions Establish an effective monitoring system of consumption and savings achieved Set informed carbon reduction targets to guide progress. The key messages from the Carbon Management Plan are: If we do nothing, annual utility and fuel costs to the City and our partners are likely to increase from 1,127,000 to 1,748,000 by 2013 and carbon emissions will rise unchecked. If we apply the carbon management programme, we could reduce the total cumulative cost by 1,344,000 during the same period of 5 years and save 5,580 tonnes of carbon dioxide. The Climate Change Strategy was developed in 2008 to be reviewed in 2012 the purpose of this was to draw together these achievements along with aims, objectives and milestones to measure success. These objectives are as follows: Progress Report 53
54 Ensure that our operations and services address the issue of climate change How we will measure success: Completion of a climate proofing assessment of key policies, strategies, action plans and procedures to ensure that they are systematically lowering carbon emissions and ensuring that decisions are resilient to climate change. A corporate Climate Change group is established to oversee the implementation of the Climate Change Strategy. Staff and Members are aware of the implications of climate change, how it affects our operations and services and receiving training and support where needed. Carlisle is achieving targets against our performance indicators on climate change. The City s partners, businesses and the wider community have developed a Carlisle Climate Change Action Plan Reduce the City s carbon emissions associated with our operations How we will measure success: By April 2013 Carlisle City will have reduced CO2 emissions from its operations*. An aspirational target of 25% on levels will be aimed for. Procurement decisions take a whole life cycle approach that includes associated carbon emissions. Ensure that the City s operations and services are adapted to climate change How we will measure success All directorates have undertaken a climate change impacts assessment of their operations and services By 2012 Carlisle City and our key partners will be implementing an adaptation action plan and monitoring progress. Establish climate change as a priority issue for the Carlisle Partnership How we will measure success The target of achieving a 3% reduction per annum on CO2 emissions per capita for Carlisle is being achieved. Carlisle Partnership members have put in place carbon reduction plans and report their action. Carlisle Partnership will have undertaken a local climate change impacts profile for Carlisle. Carlisle Partnership is playing an active role in helping local communities, businesses and partners to work towards a climate proofed Carlisle through the development and delivery of a Carlisle Climate Change Action Plan. Develop more environmentally friendly transport choices How we will measure success The City and Carlisle Partnership are engaging with local employers on the potential for partnership working through the development of Green Travel Plans. Progress Report 54
55 Make planning an effective tool in the pursuit of a climate proofed Carlisle How we will measure success Planning policies include targets and standards for addressing climate change. Support improvement in the energy efficiency of Carlisle s housing stock How we will measure success Targets are being met for the Decent Home standard and fuel poverty indicator. Progress Report 55
56 8 Implementation of Action Plans Please see the following table for an update on the implementation of the measures outlined in Carlisle City s most recent Air Quality Action Plan. The plan was originally produced in 2007 and will be reviewed in The next progress report on the action plan will be detailed in the next progress report due for submission in April Progress Report 56
57 Table 9.1 No Measure Focus 1 A new major road, the CNDR, will be constructed to the west of the City, which will remove approximately 25% of through traffic from the A7 (AQNA no1) and the A595 2 Inner Orbital Relief Route. Plans in place to provide a stronger route to ease congestion between the A6 & A7 through to the A595 by a series of junction improvements and widening of the road where possible. 3 Investigations to improve traffic flows in the city particularly at signals along the A7 & the A Within the local plan, the City has set policies, which target a number of areas such as Green Travel Plans & accessibility by different modes of sustainable transport. Action Plan Progress Reduction of traffic volume and HGV s through the city Improve traffic flow and reduce standing traffic at key inner city junctions. To improve traffic flows along two main arterial roads. To set out statement of intent for council and details of initiatives. Lead authority Cumbria County Cumbria County Cumbria County Cumbria County Carlisle City Planning phase Implementation phase < Unable to specify Ongoing from 2010 Indicator Reduced NO2 levels at monitoring locations and within AQMA s. Reduced NO2 levels at monitoring locations and within AQMA s. Reduced NO2 levels at monitoring locations along both roads and within AQMA s. <2008 Ongoing Increased number of adopted travel plans and more widespread use of alternative transport. Target annual emission reduction in AQMA Anticipate approx 25% reduction in NO2 in city centre. Not Calculated Not Calculated Not Calculated Progress to date Contract signed and construction now underway. Traffic count data being collected for comparison. Study complete. Proposal is now part of the Strategic Overview of Transport in Carlisle City Signal improvements undertaken in 2007 along A7. Real time air quality information is being shared with County to identify effects of traffic signalling on NO2 Concentrations. Local plan has been through public enquiry and the inspectors report received the plan has now been adopted by the council. All policies are underpinned by the concept of sustainable development and seek to reduce reliance on private car. Progress in last 12 months Contract signed and construction now underway. Considerati on of plans, undertaking study and organisation of proposal. Work is ongoing and traffic count data being compiled by County Ongoing promotion & implement ation of plan. Estimated completion date Comments relating to emission reductions 2012 Predicted major reduction in vehicle emissions within the city. Proposal to be presented to full County by June Decision to be made by County. Work is ongoing and traffic count data being compiled by County Ongoing Road improvements will run directly through 3 AQMA s. This should result in reduced vehicle emissions in these areas. Key measure in improving traffic flow and reducing standing traffic. These policies contribute to improving air quality. Progress Report 57
58 No Measure Focus 5 The Environmental Quality Section continues to work with the Planning Department with regard to new developments. 6 A guidance document Air Quality & Land Use has been produced for the developers submitting planning applications on where & in what form an air quality impact assessment will be required. This has now been incorporated into the council s planning validation process. 7 Supplementary Planning Guidance will be produced on planning obligations to financial contributions from developers to movement & public realm projects set out in the Development Framework & Movement Strategy To ensure that air quality is taken into account in the planning process. To ensure that air quality is taken into account in the planning process & raise awareness of AQ issues. To require financial contributio ns from developers to offset air quality impacts. Lead authority Carlisle City Carlisle City Cumbria County Carlisle City Planning phase Implementation phase Indicator Ongoing Ongoing Improved correspond ence between EQ and planning. A Q Impact Assessme nts submitted where necessary. < Air Quality Impact Assessme nts submitted by developers where necessary. < July 08 Sept 2008 Financial contributio ns assisting to fund air quality improveme nt initiatives. Target annual emission reduction in AQMA Not Calculated Not Calculated Not Calculated Progress to date Environmental Quality Section is now consulted on proposed developments which may impact on air quality at an early pre planning stage. Consultations now take place with applicant prior to applications being submitted. Completed. The Air Quality & Land Use Guidance Document is now on the City s web site & can therefore be viewed by developers & the public. Large developments are required to carry out an air quality assessment if they meet criteria set out in the air quality planning guidance. Criteria are essentially based on criteria used to trigger a transport assessment. Draft SPG has been completed and has been through full consultation. However it has not yet been adopted and is still in draft form. The SPG clarifies and sets out the City s exact approach to the use of planning obligations under s106 of the Town & Country Planning Act It includes new developments which are likely to result in a significant increase in traffic volumes/demand for public transport &/or a deterioration in air Progress in last 12 months Air Quality Impact Assessme nts have been submitted as part of application for several large new developme nts. Air Quality Impact Assessme nts have been submitted as part of application for 17 large new developme nts to date. Carlisle District Local Plan (Policy CP16) has already been used to secure monies for junction improveme nts; bus shelters Estimated completion date Ongoing Ongoing Unsure adoption has been delayed due to change of government etc. This will be examined during the next round of review and Comments relating to emission reductions Air Quality Impact Assessments are now submitted as part of applications for large developments. Potential emissions can be addressed at an early stage. Enquiries can now be directed to this document. Air quality issues are clearly expressed. Very useful to mitigate negative air quality impacts of large new developments. The SPG will set out the council s position and clarify exactly how these powers can be implemented. Progress Report 58
59 No Measure Focus 8 The County has entered a Quality Bus Partnership with Stagecoach to improve bus route infrastructure 9 Bus priority measures will take place on Scotland Rd (AQMA NO1). Wigton Rd & London Rd including traffic signal priority To improve bus service and increase patronage To reduce the effect of traffic on bus times. Lead authority Cumbria County Stagecoa ch Cumbria County Stagecoa ch Planning phase 2006 to date Implementation phase Indicator 2012/13 Increased bus patronage Originally Improved bus flow on key routes Target annual emission reduction in AQMA Not Calculated Not Calculated Progress to date quality. Financial contributions are required to mitigate/offset such negative effects such as alternative transport infra structure improvements. Real Time information screens ( PIP screens) were introduced on the 67/68 services during 2007 covering The Courts, West Tower Street and the Cumberland Infirmary. This measure was favoured by the public to enhance information and service reliability. There has been no increase in the number of information screens since 2007 due to funding issues. New busses are fitted with transmitters to allow expansion of the system. 9 new single deck busses bought this year are to Euro 4 standard, all busses on the city centre network are at least to Euro 3 standard and 66% of the entire fleet is Euro 3 or above. A Bus Improvement Strategy has been completed in 2007/8 as part of Carlisle Renaissance Development Framework & Movement Strategy. The report provides detailed recommendations to enable public transport provision can develop to satisfy future demand. Proposals have been rejected by County lors on the grounds that they are not Feasible. Progress in last 12 months raised kerbs and cycle routes. Estimated completion date assessment. Comments relating to emission reductions None ongoing Reduced emissions from new Euro 4 busses. Pip Screens encourage the introduction of an improved, modern fleet. None Rejected Potential for reduced emissions to improved traffic flow. Progress Report 59
60 No Measure Focus 10 Smart Card Ticketing solution will be developed on public transport services 11 Roadside publicity & telemarketing will be used to encourage bus patronage Improve convenience of bus service speed of boarding and efficiency. Increased awareness of service provided. Lead authority Cumbria County Stagecoa ch Cumbria County Stagecoa ch Planning phase 2006 to date Implementation phase Indicator 2012/13 Increased bus patronage when new technology in place ongoing ongoing Increased bus patronage Target annual emission reduction in AQMA Not Calculated Not Calculated Progress to date Smart card ticketing was introduced for concessionary passengers in 2006 (NOW Card). Technical trials have taken place on the expansion of smart card ticketing to include commercial bus ticketing, including pre pay tickets for travel in a fixed period and top up cards that can be charged with credit. Stagecoach expects to introduce this in 2012/2013. Annual bus patronage data obtained from Stagecoach highlights that patronage across the majority of key City Centre routes increased during From 2004/ /06 there was a 0.5% increase in bus patronage, however the largest increase was observed from 2005/ /07 when an increase of 7% was observed. This has reversed the declining trend that was observed from & is believed to be due to the renewal of the bus fleet after the 2005 floods, marketing, fares initiatives & the introduction of the NoW Card. Patronage growth has now levelled off, with small declines in 2008/9 and 2009/10. Stagecoach telemarketing has contributed to preventing further decline. Progress in last 12 months Estimated completion date Comments relating to emission reductions Trials 2013 Minor reduction in traffic volume if patronage improves. ongoing ongoing Minor reduction in traffic volume if patronage improves. Progress Report 60
61 No Measure Focus 12 Development of Park & Ride will take place during the LTP(2) Plan 13 A concessionary bus fare scheme has been introduced by Carlisle City to encourage use of public transport 14 A Cycle Development Action Plan will be implemented through LTP(2) which will provide safer & better maintained cycle routes, more secure cycle parking, promotional programmes & improved signage 15 A proposed Cycling Network has been developed for the City Reduced number of cars entering the city. Reduce the number of pensioners using private cars to enter the city centre Improve safety & convenience of cycle ways & encourage alternative transport. Encourage cycling by providing fast, safe, efficient routes. Lead authority Cumbria County Carlisle City Cumbria County Cumbria County Planning phase Implementation phase <2010 Scheme rejected. Indicator Reduced vehicle volume within city Scheme in place date date Completion of proposed works and opening of connect 2 scheme. Completion of proposed works and opening of connect 2 scheme. Target annual emission reduction in AQMA Not Calculated Not Calculated Not Calculated Not Calculated Progress to date Scheme was rejected by County lors due to lack of feasibility. The NoW Card is the free bus travel scheme in Carlisle for senior citizens. Bus Pass uptake:- 2004/05 11, /08 16,500 Concessionary patronage has grown each year since 2006 but in 2009/10 by less than 1%. The Scheme will pass to County control in 2011 when it will become a Cumbria wide initiative. Improvements to existing cycle routes are in progress. Recent improvements include the Brampton Rd to Eden Bridge cycle route & sections along the River Petteril. Much of the major construction work is complete however some sections are still ongoing. Progress is being made on the development of the cycle/pedestrian network in Carlisle. Several sections of the connect2 Kingmoor- Currock cycle route (which goes through two AQMA s) are completed. Work is also taking place along the green corridors along the Petteril & Eden as part of the flood defence work. A cycle movement strategy has Progress in last 12 months None Scheme Complete Much of the improveme nts and construction work has been completed in the last 12 months. Denton Holme Missing Link currently under construction Estimated completion date Scheme rejected. Scheme Complete Comments relating to emission reductions Potential emission reductions unclear. Large uptake and popularity indicates positive impact however restrictions may be introduced when passed to County Minor impact on emissions however could improve with good promotion and increased use Minor impact on emissions however could improve with good promotion of completed cycle network. Progress Report 61
62 No Measure Focus 16 Cycling & Walking will be encouraged through promotional campaigns e.g. Bike week, and through regular features in Carlisle Focus Magazine & on the s Website 17 A cycling & walking guide for the City will be published by the end of 2008 Improve awareness of events. Encourage participation. To increase awareness of cycling and walking routes Lead authority Cumbria County Carlisle City Cumbria County Carlisle City Planning phase Ongoing promotion of the current events Implementation phase Ongoing promotion of the current events Indicator Regular articles and campaign info in local media Release of guide to the general public. Target annual emission reduction in AQMA Not Calculated Not Calculated Progress to date been developed as part of the Carlisle Renaissance Movement strategy delivery will follow successful fund applications for schemes to the NWDA. Both the City s Sport s & Recreation Team & Cumbria CC Cycling Officer are working with communities & businesses to encourage walking & cycling. This includes setting up refresher courses, learn to ride courses & organising events. Cycling & walking is regularly promoted in Staff Focus, Carlisle Focus & Your Cumbria Magazines. The Sports & Physical Alliance project delivers walking & cycling initiatives in the community. The Sport & recreation Sections Walking Your Way to Health programme continues to thrive & new routes have been included. Both the City & County still take part in National Bike Week and provide pool bikes to encourage as many employees as possible to bike to work. Guide now complete. Walk pack has been produced including maps of city walks to encourage active transport and engagement. Progress in last 12 months The Cycle Officer has trained up to 15 cycle leaders in Carlisle & over 150 people in the City have been involved in course/ events. Baseline in 2007/08 is 3,230 trips per day. LTP & Action Plan have set a target of 1% increase per annum Production & Ongoing promotion of the Cycling Guide & walk pack. Estimated completion date Ongoing Complete Comments relating to emission reductions Minor impact on emissions however essential in order to raise public awareness. Informative guide with minimal air quality impacts. Progress Report 62
63 No Measure Focus 18 Existing businesses will be provided, on request, with information and guidance on implementing, monitoring and reviewing Travel Plans and promoting more sustainable travel to their staff 19 Travel Plans will be required to be implemented & monitored through s106 agreements through the Development Control Process for all new developments that meet the criteria for travel plan preparation Encourage existing businesses to adopt alternative transport. Offer advice where requested All new developme nts meeting criteria for travel plan preparation. Lead authority Cumbria County Cumbria County Carlisle City Planning phase Implementation phase date Indicator Increased number of participating businesses and more widesprea d use of alternative transport. Ongoing Ongoing Increased number of participant businesses and more widesprea d use of alternative transport. Target annual emission reduction in AQMA Not Calculated Not Calculated Progress to date The Travel Plan Officer appointed by the County continues to work with existing businesses where appropriate. However, the focus has shifted from actively contacting existing businesses to providing information and guidance on an ad hoc basis, as requested. This is so that more attention can be focussed on obtaining and developing travel plans through the development control process. Large new businesses likely to result in increased highway usage must submit a travel plan for approval when making a planning application. s Highways Development Control Officer comments on all planning applications affecting the highway. Monitoring system now in place to ensure adherence to all parts of S106 Agreements. Progress in last 12 months No existing businesses have taken up a travel plan in the last 12 months. Travel Plans were provided for the following proposed developments: Borderway Mart, 109 bedroom hotel in Botchergate, convenienc e store + flats on Scotland Road, care home at Harraby, Carlisle College & Caldew Hospital. Estimated completion date Ongoing Ongoing Comments relating to emission reductions Minor impact however commitment from a number of large businesses may lead to reduction in business traffic. Minor impact however commitment from large organisations may lead to reduction in business traffic. Progress Report 63
64 No Measure Focus 20 Local schools will be encouraged & supported in taking up the School Travel Plans through the Better Ways To School Programme 21 A car share scheme will be set up for the use by the public 22 The City will develop & implement a Green Travel Plan for the organisation & promote the initiative to major employers To increase awareness of issues among school children. Reduce number of vehicles at peak times. To reduce the number of single occupancy vehicles. To set out statement of intent for council and details of initiatives. Lead authority Cumbria County Carlisle City Carlisle City Planning phase Implementation phase Indicator Increased number of schools developing travel plans Members signing up to scheme via website. <April 2008 April 2008 Final plan approved and implement ed Target annual emission reduction in AQMA Not Calculated Not Calculated Not Calculated Progress to date All schools within the city have now prepared school travel plans. This has since been extended to include cycle training; this is now being offered to all year 6 students in Carlisle City. Level 3 training being offered to selected secondary school students, ACTS team now working in schools to encourage active travel to school. There is new mapping of routes and barriers to these schools. Cumbria Liftshare has been implemented 3 years ago for council staff in Cumbria, managed nationally. Public car share scheme still limited to link on website. Car sharing promoted on councils website, Carlisle Focus magazine as part of Green Travel Plan. Completed, the Green Travel Plan was approved by council in April 2008, this statement of intent is to be reviewed every 3 years. It is available on the website and intranet. Progress in last 12 months Modal shift data for a five years shows a 7% increase in walking and 1% increase in cycling in the schools in the Carlisle area(04/05 baseline) Promotion work. However unable to monitor uptake. Business mileage is now closely monitored and has seen a steady reduction. Estimated completion date Completed all schools now have plan in place. Cycle training to run until Ongoing promotion Ongoing to be reviewed in April 2011 Comments relating to emission reductions Emission reductions are minimal however positive step and increased awareness. Minor impact on emissions however could improve with good promotion and increased uptake. Directs awareness to key areas of the council to promote green issues. Progress Report 64
65 No Measure Focus 23 The will seek to improve the availability of cleaner fuels by encouraging new service stations to stock alternative cleaner fuels 24 The will develop partnerships with business & major fleet operators to encourage the accelerated use of cleaner vehicle technologies & cleaner fuels & promote improved maintenance & considerate & economical driving 25 The will introduce a policy of replacing it s vehicle fleet with greener types of vehicle 26 The will carry out campaigns to raise awareness of vehicle pollution, including discouraging drivers from allowing their engine to idle & possible voluntary vehicle emission testing General public given affordable and convenient alternative to petrol Reduce emissions from privately owned vehicles in the district Improveme nt to refuse collection vehicle fleet. Increase awareness among the general public. Lead authority Carlisle City Carlisle City Carlisle City Carlisle City Planning phase Implementation phase 2006 Not feasible for council to impleme nt. 2006/07 No progress Indicator Increased availability and use of alternative fuels. Improved links and cooperatio n from private businesses Ongoing Ongoing Improved efficiency of council owned vehicles. 2006/7 Not feasible for council to implement. Target annual emission reduction in AQMA Not Calculated Not Calculated Not Calculated - Not Calculated Progress to date An increasing number of petrol/service stations are offering greener fuel alternatives such as LPG and Diesel with a percentage of Biodiesel content. However the council doesn t actively encourage this and the process is entirely demand driven. Not feasible for council to implement at this stage, priority given to improving councils own fleet. The council has gradually replaced its fleet of refuse collection vehicles and 100% of these now meet euro 5 standard. 75% of the 136 council owned vehicles are registered in 2005 or later. Almost all vehicles meet euro 4 standard. Electric alternatives found not to be viable. Most vehicles run on diesel with 5% biodiesel content as standard. Considered not to be feasible for council to implement. Progress in last 12 months No progress No progress Vehicles over 3.5 tonne and seasonal equipment e.g. grass cutters are serviced every 4-6 wks, others serviced at least every 6 months No progress to date. Estimated completion date Ongoing No further progress expected with scheme. Ongoing. Vehicles renewed in line with 10 year replaceme nt programme. Majority replaced within 5 years. No plans to implement measure Comments relating to emission reductions The natural move toward greener fuel alternatives is reliant on demand and vehicle technology improvements. No improvement expected as a result of scheme Emission reductions in council fleet contribute to improved air quality. Potential air quality impacts would be very minimal. Progress Report 65
66 No Measure Focus 27 The City will consider authorising it s officers under the Road Vehicle (Construction & Use) Regulations for the purposes of issuing fixed penalty notices where motorists refuse to turn off idling engines 28 The City & The County will develop & implement a comprehensive Car Parking Strategy 29 The movement of goods by rail, wherever possible, will be encouraged. 30 The City will promote the reporting of smoky vehicles through information leaflets, information in Carlisle Focus Magazine & through the City s website. Increase awareness among the general public. To reduce unnecessary congestion in city. Particularly at peak times To increase rail freight by major train operators. Increase awareness & provide convenient way of reporting Smokey vehicles. Lead authority Carlisle City Cumbria County Carlisle City Cumbria County Carlisle City Planning phase Implementation phase 2006/7 Not feasible for council to implement onwards Indicator Fixed penalties issued to non compliant drivers. Reduced traffic volume within city centre. < Increased rail freight to and from the district / 2008 Visible information in key locations including website. Target annual emission reduction in AQMA Not Calculated Not Calculated Not Calculated Not Calculated Progress to date Considered not to be feasible for council to implement. Based on a Parking Strategy for Carlisle, joint City and County parking policies have been developed. These are in the process of being approved by Members. Following approval, steps can be taken towards implementation. County appointed rail officer to promote and encourage movement of freight by rail. Direct rail services based at Carlisle are helping to improve infrastructure. Train operators make decision on economics & feasibility. Information leaflets have been distributed in public buildings e.g. civic centre, libraries & community centres. A form to report smoky vehicles is now available on the web site. Progress in last 12 months No progress to date. Completed Parking Strategy and development of the parking policies. Improveme nts on Settle to Carlisle line and Cumbria Coast Line to allow heavy freight Estimated completion date No plans to implement measure Policies implement ed in Ongoing Comments relating to emission reductions Potential air quality impacts are likely to be very minimal. Improved parking arrangement should reduce congestion from slow moving traffic looking for parking. Intended to reduce the number of HGV s passing through the city. movement. Ongoing Ongoing Minimal AQ and emissions impacts. Reported vehicles dealt with by Vehicle and Operator Services Agency. (VOSA) Progress Report 66
67 No Measure Focus 31 The will continue to provide comprehensive control over all Part A2 & B. Processes located within the local authority 32 The will improve information & advise give to residents & companies about problems caused by bonfires, and continue enforcement action where appropriate. 33 An extensive publicity campaign has recently taken place on green waste collection schemes provided by the Control emissions to air in line with nationally agreed levels and encourage year on year improveme nt To control emissions to air from the burning of unsuitable material and prevent statutory nuisance caused by smoke. To reduce organic waste going to landfill and burning of garden waste Lead authority Carlisle City Carlisle City Carlisle City Planning phase Implementation phase Indicator Ongoing Ongoing Inspections show that emission limits are being met and efforts are being made to improve on these national levels. Inspections are risk based. Ongoing Ongoing Reduction in the number of public complaints < Increasing quantities of garden waste being collected in 2 weekly collection Target annual emission reduction in AQMA Not Calculated Not Calculated Not Calculated Progress to date Part A processes are permitted & inspected by Environment Agency. Part A2 & B processes (67 in total) are permitted & inspected at least annually by Carlisle City. Information on website and advice leaflets available. 67 Smoke related complaints received in during When implemented in 2004/ tonnes of garden waste was collected in the district this has since raised to tonnes in 2009/10. There are 4 specialised green waste collection vehicles all to euro 5 standard. Progress in last 12 months Processes have improved and many have shown a steady reduction in emissions, year on year. All are now in the medium or low risk category. 47 smoke related complaints received in Ongoing publicity and improveme nts to collection system Estimated completion date Ongoing Ongoing Ongoing Comments relating to emission reductions Moderate AQ impacts. Increased awareness through inspection leads to gradual improvement in process management and emissions. Bonfires not producing black smoke can only be prevented if causing a nuisance or trade waste. AQ impacts are minimal. Emission reductions from landfill and garden bonfires. Progress Report 67
68 No Measure Focus 34 The will continue to investigate complaints of dark smoke from industrial and trade premises and cable burning. 35 The will continue to ensure that only authorised fuels and appliances are used in smoke control areas. 36 An Energy Efficiency advice survey will be targeted at residential properties within/adjacent to the AQMA s. Energy savings advice & grants to be provided 37 We will establish a method to introduce more regular publicity events & promotion of air quality & sustainable transport issues To control emissions to air from the burning of unsuitable material. To control emissions to air from the burning of unsuitable material in smoke control areas. Measures to improve energy efficiency and assist residents in fuel poverty. Improve accessibility to A Q. Information and Increased public awareness Lead authority Carlisle City Carlisle City Carlisle City now in conjuncti on with Tadea. Carlisle City Planning phase Implementation phase Indicator Ongoing Ongoing Reduction in the number of public complaints Ongoing Ongoing Reduction in the number of public complaints Ongoing; schemes and target areas always change Reduction in the amount of fuel required to heat residential properties Visible promotion of sustainable travel in media. Target annual emission reduction in AQMA Not Calculated Not Calculated Not Calculated Not Calculated Progress to date There are 5 Smoke Control Areas located within the City. A map showing the areas & information acceptable types of fuel / appliances on the website. There are currently 5 smoke control areas. EQS receives approximately 12 queries per year from householders who are unsure as to whether they are in a SCA & what restrictions are in place. All key information is on website. 4 million spent by the council to date on improvement subsidies and grants. The walking & cycling guidance has been produced. Cumbria public transport maps and extensive info is available on website. Progress in last 12 months 3 prosecutio ns in 2009 in relation to the burning of cables. None in relation to commercial premises. Advice given and complaints responded to as required. Subsidised works include; 61 cavities, 33 virgin lofts and 18 loft top up s in Regular publishing in Staff Focus & Carlisle Focus Magazines & on web. Estimated completion date Ongoing Ongoing Ongoing Ongoing Comments relating to emission reductions Enforcement and warnings ensure that smoke control is widely observed. Warnings issued and advice ensures that smoke control is widely observed. Last year funding was low and improvements were targeted at vulnerable households. This is no longer the case. Improved awareness of alternative transport options may lead to reduction in vehicle emissions. Progress Report 68
69 No Measure Focus 38 The City will improve access to information regarding transport options by publishing up to date bus & rail times on the s website 39 The City will publish more local air quality monitoring data on it s website 40 The City will produce a teaching pack on air quality & reducing air pollution. These will be circulated to schools in the District 41 We have expanded our monitoring network to incorporate a new continuous monitoring site for nitrogen dioxide installed within AQMA (No1) Improve accessibility to timetables. Raise public awareness and publish real time data. Raise children s awareness of air quality issues. Increase the level of continuous monitoring to be used in review & assessment work. To Provide more detailed monitoring of AQMA 1. Lead authority Carlisle City Carlisle City Carlisle City Carlisle City Planning phase Implementation phase Indicator Increased bus & train patronage. Improved public service. < Regularly updated NO2 readings on web page Packs produced and distributed to schools < Monitoring data is managed by Casella Monitor. Hourly readings are reported to Environme ntal Quality on a monthly basis. Target annual emission reduction in AQMA Not Calculated Not Calculated Not Calculated Not Calculated Progress to date Completed. Bus & rail information is now available on the City s web site. Real time monitoring data from monitoring stations, review and assessment work and monitoring results are available on the councils web site. Information packs completed. Officers have given talks to 2 schools on air pollution issues. Air monitoring unit has been installed at Stanwix Bank (within AQMA No1). Paddy s Market Monitoring Unit has been incorporated into the National Automatic & Rural Network (AURN) and non-automatic hydrocarbon network. Progress in last 12 months Links to bus and rail sites updated due to changes in service providers. Reports and results are uploaded as necessary. No further progress Ongoing monitoring, collection and reporting of real-time data from unit. Estimated completion date Complete Complete Scheme no longer in operation due to time constraints Now Complete Comments relating to emission reductions Minimal short term impact on air quality in the district. Official resource for current air quality information. Minimal short term impact on air quality in the district. Since 2007 the annual mean results from the station has shown a steady reduction in annual mean this location. Progress Report 69
70 9 Conclusions and Proposed Actions 9.1 Conclusions from New Monitoring Data Nitrogen Dioxide The monitoring undertaken for the purpose of this report has not identified any potential or actual exceedences of the nitrogen dioxide annual mean at relevant locations outside our current declared AQMA s. Two locations did exceed the objective these include tube C5 - The Griffin (46.2) and D12 - Post Office (40.1). Neither of these locations are in, or near to, a relevant location, such as a residential property, there is therefore no need to proceed to a detailed assessment. New monitoring data from within AQMA s 1, 3, 4, & 5 has revealed that the annual mean for nitrogen dioxide still remains above the objective level. However every monitoring location from within these AQMA s has shown a reduced annual mean for nitrogen dioxide from the previous year. Monitoring within AQMA no.6 (London Rd) indicated that the nitrogen dioxide concentration has decreased further below the objective level for the second year running, for 2009 this is now 36.3ug/m3. Monitoring will continue to ensure levels remain below the objective of 40 g/m 3. Nitrogen Dioxide levels have also fallen within AQMA no.2 (Currock Street) for the first time since monitoring began in 2005, the annual mean for 2009 was 39.8ug/m3. This is clearly borderline and monitoring will continue to ensure that levels fall further below the objective. If current and future monitoring indicates a continued reduction in AQMA s 2 and 6 then consideration will be given to revoking these AQMA s. It is likely however that monitoring will continue until after the opening of the Carlisle Northern Development Route (CNDR) so that before and after comparisons can be drawn. Monitoring from our two continuous analyser units showed no exceedence of the 1 hour mean objective, or the annual mean objective, for nitrogen dioxide at either location during Particulate Matter (PM 10) Monitoring from our unit at Paddys Market showed no exceedence of the 24 hour mean objective, or the annual mean objective, for PM 10, during Particulate Matter (PM 2.5) Monitoring from our unit at Paddys Market showed no exceedence of the annual mean objective, for PM 2.5, during Benzene. Monitoring from our pumped diffusion tube unit at Paddys Market showed no exceedence of the annual mean objective for Benzene, during No other pollutants are of concern in the district. Progress Report 70
71 9.2 Conclusions relating to New Local Developments The new local developments within the district are detailed in section 4 of this report, the air quality impacts of these have been assessed either as part of the planning process or under the Environmental Permitting Regulations There are no major developments of any particular concern other than the previously discussed CNDR and Carlisle Airport. These two developments will be closely monitored and an update will be given in next years progress report, if necessary these will then be assessed as part of the next Updating and Screening Assessment (2012). None of these developments currently give rise to the need assessment. for a detailed 9.3 Other Conclusions As detailed in the report there has been some progress with a wide range of initiatives set out in the previous action plan this is likely to have contributed to the overall improved air quality that has been shown across the district compared to previous years. The additional monitoring of PM2.5 started in March 2009 and the first 10 months of results have now been reported up to 20 th January The results have shown an annual mean of 11.8 g/m 3. This is well below the target objective of 25 g/m 3 to be achieved by There is therefore no concern of any exceedences of this pollutant at this stage. There are a number of major planning applications not yet approved which have been summarised in section 4. The two developments of any concern are the Morton development and Cryndledyke. In both cases an Air Quality Impact Assessment has been requested and Environmental Health is currently working with the planning department and any the consultants concerned as to the scope the assessments and the potential impacts. Any outcomes or changes to these applications will be covered as a priority in the progress report The County has developed Local Transport Plan 2 (2005/6-2010/11) which has been assessed in detail in section 6 of this report. This is the most up to date plan however an updated plan should be available in time for future rounds of review and assessment. 9.4 Proposed Actions The new monitoring data for 2009 has not identified the need to proceed to a Detailed Assessment for any pollutant. The new monitoring data has not identified any need for additional monitoring, or changes to the existing monitoring programme. This will remain largely the same so that comparisons can be drawn when the CNDR is complete. It is hoped that the bypass will further improve air quality in several AQMA s and at this point it is anticipated that one or more may be revoked. Progress Report 71
72 The current AQMA 3 (Wigton Road) has now been successfully extended and the AQMA order came into force on 1 st July Monitoring will continue here in the same way as in previous years however the data collected in 2009 already shows a reduction in NO2 annual mean across the AQMA. The newly extended area, and parts of the original AQMA, is currently borderline of the NO2 annual mean objective. There is currently no reason to make any further changes to the boundaries of any of the existing AQMA s The next round of reports to be submitted to DEFRA will be our updated action plan, this will be produced in 2011 and will subsequently become available for public access on the councils web site. The next progress report will be submitted in spring 2011, this will present all of the monitoring data for 2010 as well as detail any further progress with the action plan measures. Progress Report 72
73 10 References Department of the Environment Transport and the Regions. (2000b) Air Quality Strategy for England, Scotland, Wales and Northern Ireland. (Revised 2007) Carlisle City, Environmental Services. Air Quality and Land use planning. (2006) DEFRA. Part IV of the Environment Act Local Air Quality Management Technical Guidance LAQM.TG (09) (Feb 2009) The Air Quality (England) Regulations 2000 (as amended 2002) Cumbria County. Local Transport Plan (2005/6-2010/11) NSCA. Development Control: Planning for Air Quality. (Updated 2006) Cumbria County. Compendium of Transport Policies (2007) Carlisle City. Carbon Management Programme. Carbon Management Plan (2008/9 2012/13) Carlisle City. Climate Change Strategy ( ) Carlisle City. Carlisle District Local Plan ( ) Cumbria County. Carlisle Cycle and Walk Map (2008) Carlisle City. Doorstep Walks in and around Carlisle. (2009) Carlisle City. Green Travel Plan (2008) Carlisle City. First Round Review and Assessment Reports: Carlisle City. Stage 4 Report. (2006) Carlisle City Second Round Review and Assessment Reports: Carlisle City. Air Quality Updating & Screening Assessment. (2003) Carlisle City. Air Quality Detailed Assessment. (2004) Carlisle City. Air Quality Progress Report. (2005) Carlisle City Third Round Review and Assessment Reports: Carlisle City. Updating and Screening Assessment Carlisle City. Detailed Assessment Report. (2006) Carlisle City. Further Assessment Report. (2007) Carlisle City. Progress Report. (2007) Progress Report 73
74 Carlisle City. Detailed Assessment. (2007) Carlisle City. Further Assessment Report. (2007) Carlisle City. Progress Report. (2008) Carlisle City. Further Assessment Report. (Issue ) Carlisle City Fourth Round Review and Assessment Reports: Carlisle City. Updating and Screening Assessment. (2009) Progress Report 74
75 Appendices Appendix A: QA/QC Data Appendix B: Monthly NO 2 diffusion tube results 2009 (Raw Data) Appendix C: NO 2 diffusion tube results 2009 (Calculated Data) Appendix D: Map of Non-Automatic Monitoring Sites Appendix E: Map Showing All Declared AQMA s. Appendix F: Maps Showing location and extent of new local developments. Progress Report 75
76 Appendix A: QA:QC Data Diffusion tube precision can be described as the ability of a measurement to be consistently reproduced, i.e. how similar the results of duplicate or triplicate tubes are to each other. Accuracy represents the ability of the measurement to represent the true value, which, in this case, is defined as the result from the automatic analyser. When averaged over a number of sets of results bias can be evident. This represents the overall tendency of the diffusion tubes to depart from the true value, i.e. to systematically over or under-read when compared against the reference method. Once identified, bias can be adjusted for to improve the accuracy of diffusion tube results. This is done using bias adjustment factors, which have been found to be specific to a laboratory and tube preparation method. As a result of the considerable difference in the performance of tubes prepared by different labs, government guidance recommends that a bias adjustment factor is determined and applied to the data. Technical guidance gives a method for this, which involves the co-location of these tubes with a chemiluminescent NOx analyser. Authorities are asked to report the adjustment factor from their own collocation study, where available. The national bias adjustment factor is then determined by Air Quality Consultants (AQC) who on behalf of Defra, collate and assess data from NO2 collocation studies across the UK. Full details of both the national and local bias adjustment factors used to adjust data and a comment on overall precision are provided below. Diffusion Tube Bias Adjustment Factors In February 2009 the council changed suppliers and now utilises NO2 diffusion tubes prepared with 20% TEA in water prepared and analysed by Gradko Environmental Ltd. For this reason the total study period for 2009 is 11 months. A national bias adjustment factor of 0.86 was calculated using the bias adjustment spreadsheet tool on the Local Authority Air Quality Support Website. This calculation is based on 15 individual co-location studies nationally, including our own. All of these studies were analysed by Gradko for the method 20% TEA in water during Factor from Local Co-location Study A local bias adjustment factor of 0.82 was derived from the diffusion tubes co-located at the Paddy s Market monitoring station. This was calculated using the AEA Spreadsheet for checking the precision and accuracy of triplicate tubes, found on the UK Air Quality Archive website. The following screen print shows the results of the data that was input into the spreadsheet. Progress Report 76

77 Our local bias adjustment factor shown on the spreadsheet was then submitted to AQC so that it could be contributed to the overall accuracy of the national bias adjustment factor. Tube precision is separated into two categories Good or Poor as follows: tubes are considered to have Good precision where the coefficient of variation of duplicate or triplicate diffusion tubes for eight or more periods during the year is less than 20%, and the average CV of all monitoring periods is less than 10%. Tubes are considered to have Poor precision where the CV of four or more periods is greater than 20% and/or the average CV is greater than 10%. Two out of the 11 study periods shown above had a CV of over 20% for this reason the bias adjustment factor and annual means are all based on these 9 remaining periods of data collection. These are summarised as follows: Diffusion tubes annual mean: 31 g/m 3 Automatic monitoring station mean: 38 g/m 3 Local bias adjustment factor: 0.82 Discussion of Choice of Factor to Use The two separately calculated bias adjustment factors (Local: 0.82, National: 0.86) are evidently rather closely matched. It was decided that the overall correction factor Progress Report 77
78 derived from as many co-location studies as possible will provide the best estimate of the level of bias between the diffusion tubes results and the true value. The 51 diffusion tubes are exposed over a wide range of locations across the district, some of which differ considerably from our co-location site. Therefore annual mean for each diffusion tube location has been adjusted using the national bias adjustment factor calculated from 15 collocation studies. Unlike bias, poor precision cannot be adjusted for. It can only be improved by careful handling of the tubes in both the laboratory and the field. The two Figures below illustrate the difference between bias and precision. Both sets of results have the same calculated negative bias, shown by the vertical red line, compared with the true value. However, those in the top part of the Figure have poor precision, whereas those in the lower part have good precision (the vertical spread is just a way of displaying the large number of individual results). Good vs Poor Precision The distinction between Good and Poor precision is an indicator of how well the same measurement can be reproduced. This precision will reflect the laboratories performance/consistency in preparing and analysing the tubes, as well as the subsequent handling of the tubes in the field. Any laboratory can show Poor precision for a particular period/collocation study, if this is due to poor handling of the tubes in the field. Therefore, when assessing the performance of a laboratory, account should be taken of the proportion of Poor precision collocation results, not just the presence or absence of Poor precision co-location results. PM Monitoring Adjustment Defra published the results of a study investigating the equivalence of various samplers and instruments for measuring PM10 in comparison with the European reference method (a gravimetric technique). Progress Report 78
79 The study found that the TEOM did not meet the equivalence criteria of the European reference method within the UK, even with the 1.3 correction factor (as advised in previous guidance). The outcome of the equivalence study means that TEOM analysers cannot strictly be used to measure PM10 concentrations for comparison with the air quality objectives. TEOM s are however widely used in LAQM work. Defra & the Devolved Administrations advice to local authorities using TEOM s is that it is generally not necessary to replace the instrument immediately, but when the time does come to replace it, the selected sampler should be a reference sampler, or one that meets the equivalence criteria. During previous review and assessment work the data has been corrected wherever possible using the King s College London Volatile Correction Model (VCM) for PM10 (rather than by the application of a 1.3 correction factor). This adjustment is not necessary for the purpose of this progress report because the TEOM was upgraded to FDMS on 18 th March For this reason the PM10 data presented here was collected between 19/3/09 and 19/1/10, this 10 months of data can be used to compare the collected PM10 concentrations with the air quality objectives. QA/QC of automatic monitoring Both of our automatic stations are subject to stringent QA/QC procedures. Paddy s Market, which monitors PM10, NO2 and more recently PM2.5, is part of the AURN and the network quality assurance and control procedures are implemented. To ensure optimum data quality and capture, a three-tier system of calibration and analyser test procedures is employed in the AURN. The major components of this system are briefly described below. a) Daily automatic IZS checks - these allow instrumental drifts to be examined, and act as a daily check on instrument performance. b) Fortnightly manual calibrations - these are performed by the local site operators and are used by management unit to scale raw pollution data. c) 6 monthly network inter calibrations These exercises are performed by the QA/Qc Unit every 6 months to ensure that all measurements from all network stations are completely representative and intercomparable. The inter calibrations will also act as an independent audit of the system at the site. Data ratification is undertaken every 3 month intervals. This involves a critical review of all information relating to the data set to verify, amend or reject the data. When the data is ratified, they represent the final data set in the review & assessment process Stanwix Bank, which monitors NO2 is data managed by Casella Monitor. Casella Monitor has a defined quality system that forms part of their UKAS accreditation that the laboratory holds. Progress Report 79
80 Re-scaling relies on the LSO providing fortnightly calibration reports as a result of using calibration sources such as gas cylinders and zero air scrubbers. This data is used to calculate the true analyser zero and response factor and is used to scale data for the following two weeks leading up to the next scheduled calibration. QA/QC of diffusion tube monitoring Carlisle City QA/QC of diffusion tube monitoring Carlisle City follows the guidance set out in the Diffusion Tubes for Ambient NO2 Monitoring: Practical Guidance for Laboratories and User which includes advise on selection of site, the location of the samplers, instructions for exposure, and collocation with automatic analysers. Laboratory QA/QC of diffusion tube monitoring Gradko International has a defined quality system which forms part of the UKAS accreditation that the laboratory holds. All accredited methods are fully documented. The analytical laboratory is assessed by UKAS to establish conformance of Laboratory Quality Procedures to the requirements of ISO/IEC Standard. UKAS assessors visit on an annual basis and review all aspects of the analysis from the sample handling to analysis and reporting. As a condition of the accreditation the laboratory is required to participate in external proficiency schemes. Gradko participates in the Workplace Analysis Scheme for Proficiency (WASP) organised by the Health and Safety Laboratory. This scheme provides a regular assessment of the labs performance in that, every quarter, the laboratory receives four diffusion tubes doped with an amount of nitrite known to HSL, but not the laboratory. At least two of the tubes are usually duplicates, which enables precision, as well as accuracy, to be assessed. Any result from such a scheme that falls outside the relevant limits is immediately investigated and steps taken to rectify the situation. The results from rounds 103 to 107 which covered the WASP scheme for 2009 show that Gradkos performance score falls into category 1 (good). Calibration The instrument is calibrated twice daily, using a series of calibration standards to ensure a satisfactory linear response is obtained. A standard check is analysed after every fifty samples to ensure that the calibration is still valid. Quality Control A quality control check is run after ten samples and is assessed against warning and action limits defined in the method. Quality control solutions are prepared from standards supplied by a different vendor to that of the calibration standards. Any AQC exceeding the action limit or two consecutive warning limits is internally assessed and is reported to the client as an AQC failure. Travel Blank The travelling blank is analysed at the same time as the samples, any blank exceeding the currently prescribed maximum is investigated and reported to the client. Progress Report 80
81 Appendix B MONTHLY NO2 DIFUSION TUBE RESULTS Raw Data AREA A - A7 STANWIX BANK, SCOTLAND ROAD AND KINGSTOWN ROAD Site ID OS Grid Reference Site Name Old Site ID Jan-10 Feb-10 Mar-10 Apr-10 May-10 Jun-10 Jul-10 Aug-10 Sep-10 Oct-10 Nov-10 Dec-10 No of months A1 3E+05 6E SCOTLAND RD A10 3E+05 6E+05 STANWIX BANK A12 3E+05 6E ETTERBY ST A5 3E+05 6E KINGSTOWN RD A7 3E+05 6E KINGSTOWN RD A9 3E+05 6E+05 BRAMPTON RD AREA B - CURROCK ST-DENTON ST B12 3E+05 6E+05 DENTON ST B3 3E+05 6E+05 SHADDONMILL B4 3E+05 6E+05 DALSTON RD a a B5 3E+05 6E+05 8 JUNCTION ST a B6 3E+05 6E CHARLOTTE ST r r B7 3E+05 6E CURROCK ST AREA C - CITY CENTRE C1 3E+05 6E+05 LOWTHER ST C2 3E+05 6E+05 TOURIST INFO C3 3E+05 6E+05 DEVONSHIRE ST C4 3E+05 6E+05 BAR SOLO 38 a C5 3E+05 6E+05 GRIFFEN a AREA D - A69 WARWICK ROAD D1 3E+05 6E+05 VICTORIA PLACE a D10 3E+05 6E WARWICK RD D11 3E+05 6E+05 CARTEF D12 3E+05 6E+05 POST OFFICE D3 3E+05 6E WARWICK RD D5 3E+05 6E WARWICK RD D7 3E+05 6E WARWICK RD a D9 3E+05 6E WARWICK RD a a Page 81
82 AREA E - CALDEWGATE-WIGTON ROAD-NEWTOWN ROAD E22 3E+05 6E+05 FINKLE ST E12 3E+05 6E+05 3 WIGTON RD E15 3E+05 6E WIGTON RD E16 3E+05 6E+05 JOVIAL SAILOR E19 3E+05 6E WIGTON RD E20 3E+05 6E WIGTON RD E4 3E+05 6E+05 JOHN ST E6 3E+05 6E+05 PADDYS MARKET r E6 3E+05 6E+05 PADDYS MARKET E6 3E+05 6E+05 PADDYS MARKET E8 3E+05 6E+05 BRIDGE ST E9 3E+05 6E+05 CHURCH ST a E21 3E+05 6E+05 BURGH RD AREA F - BOTCHERGATE / LONDON ROAD F1 3E+05 6E+05 3 TAIT ST a a a F10 3E+05 6E BOTCHERGATE F5 3E+05 6E+05 STANLEY HALL F7 3E+05 6E LONDON RD a r a F9 3E+05 6E LONDON RD AREA H - TOWNS H1 4E+05 6E+05 BRAMPTON a H3 3E+05 6E+05 LONGTOWN H4 3E+05 6E+05 WARWICK BRIDGE H5 3E+05 6E+05 WIGTON RD H6 3E+05 6E+05 PETER LANE H7 3E+05 6E+05 DALSTON RD H8 3E+05 6E+05 AIRPORT r = Anomolous data removed from the study. See table below. a - Absent data. Site ID F7 E6 B6 Month May Nov Aug Value Removed B6 Nov Page 82
83 Appendix C NO2 DIFUSION TUBE RESULTS Calculated Data AREA A - A7 STANWIX BANK, SCOTLAND ROAD AND KINGSTOWN ROAD Site ID Site Name Annual Mean (µg/m3) Local Bias Adjustment (0.8) National Bias Adjustment (0.92) In relevant location? (Distance of residence from tube) (m) Distance of tube from kerb of nearest Road. (m) NO2 Background Concentration (µg/m3) Predicted NO2 Concentration at receptor (µg/m3) A1 45 SCOTLAND RD N (4.5) A10 STANWIX BANK N (1.5) A12 14 ETTERBY ST Y A5 37 KINGSTOWN RD Y A7 282 KINGSTOWN RD N (7.5) A9 BRAMPTON RD Y AREA B - CURROCK ST-DENTON ST B12 DENTON ST N (10) B3 SHADDONMILL Y B4 DALSTON RD Y B5 8 JUNCTION ST Y B6 41 CHARLOTTE ST Y B7 12 CURROCK ST Y AREA C - CITY CENTRE C1 LOWTHER ST Y C2 TOURIST INFO N - Not residential C3 DEVONSHIRE ST N 3 - Not residential C4 BAR SOLO N 9 - Not residential C5 GRIFFEN N 3 - Not residential AREA D - A69 WARWICK ROAD D1 VICTORIA PLACE N (8.5) D WARWICK RD Y D11 CARTEF Y D12 POST OFFICE N 5 - Not residential D3 166 WARWICK RD Y D5 215 WARWICK RD Y D7 282 WARWICK RD Y D9 251 WARWICK RD Y Page 83
84 AREA E - CALDEWGATE-WIGTON ROAD-NEWTOWN ROAD E22 FINKLE ST Y E12 3 WIGTON RD N (2) E15 22 WIGTON RD Y E16 JOVIAL SAILOR Y E19 49 WIGTON RD Y E20 44 WIGTON RD Y E4 JOHN ST N (3) E6 PADDYS MARKET N (42) 9 - Not residential E6 PADDYS MARKET N (42) 9 - Not residential E6 PADDYS MARKET N (42) 9 - Not residential E8 BRIDGE ST Y E9 CHURCH ST Y E21 BURGH RD N (8) AREA F - BOTCHERGATE / LONDON ROAD F1 3 TAIT ST Y F BOTCHERGATE Y F5 STANLEY HALL Y F7 24 LONDON RD Y F9 129 LONDON RD Y AREA H - TOWNS H1 BRAMPTON N (0.5) H3 LONGTOWN N (0.5) H4 WARWICK BRIDGE N (0.5) H5 WIGTON RD Y H6 PETER LANE Y H7 DALSTON RD Y H8 AIRPORT Y Results in red indicate an exceedence of the annual mean objective of 40 µg/m3. Page 84

85 Appendix D: Map of Non-Automatic Monitoring Sites Progress Report 85

86 Appendix E: Map Showing All Declared AQMA s. Progress Report 86


87 Appendix F: Map Showing Locations of new Major developments Morton Development. Crindledyke Development. Progress Report 87


88 Caldewgate Development Richard Rose Morton Academy Progress Report 88

89 Denton Business Park. Progress Report 89