Ashraf Zakey. World Meteorological Organization (WMO)
|
|
|
- Brian Wilcox
- 5 years ago
- Views:
Transcription


")

1 Ashraf Zakey World Meteorological Organization (WMO) Regional training workshop on national adaptation plans (NAPs) for Anglophone North and West African countries, July 2015, Cairo-Egypt
2 Amis of work List of selected global models and Zones Data sources RCCI Definition Results Conclusion
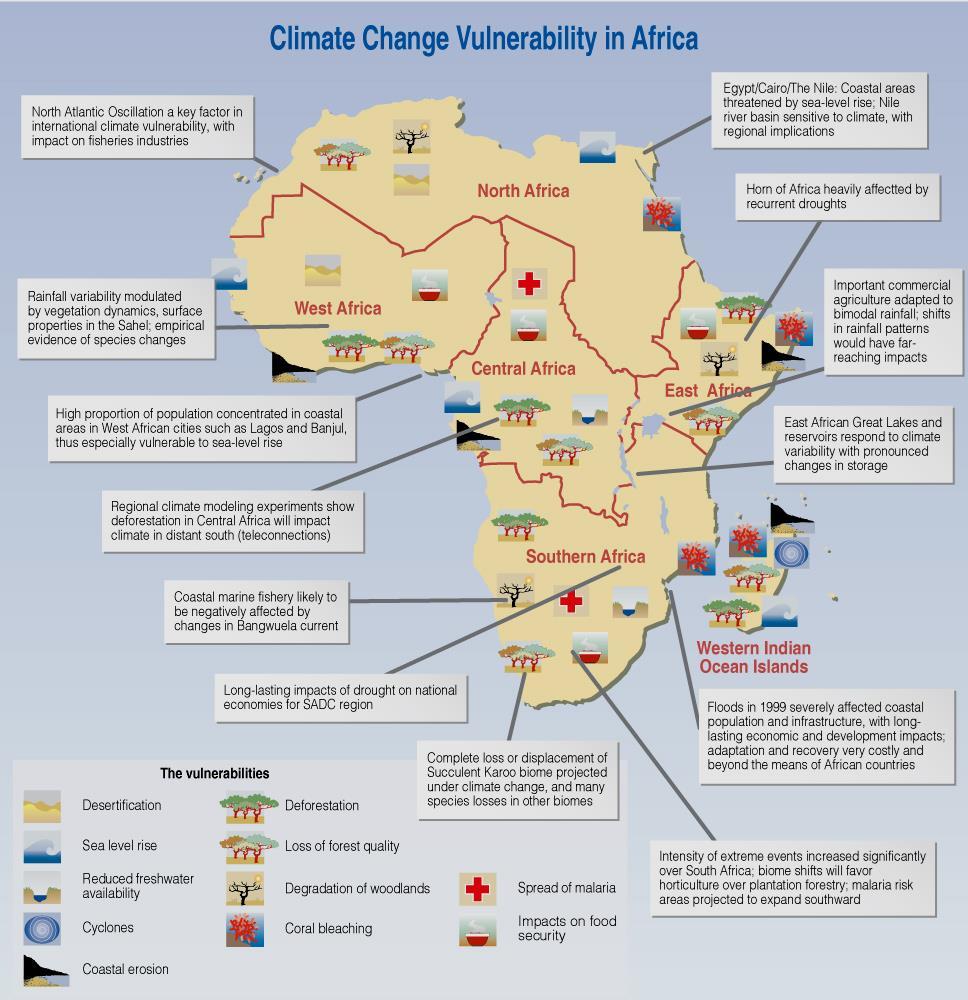
3 Climate change is real and happening now with severe and diverse impacts Africa, while having the least contribution to greenhouse gas emissions, is the most vulnerable and has been hardest hit by the impacts of climate change. The region has experienced a rise in annual temperatures over the past decades and changes in rainfall patterns, particularly increase in frequency of floods and droughts.
4 Climate change impacts have the potential to undermine and even undo progress made in reducing poverty, attaining MDGs, and improving the socio-economic wellbeing of the peoples of Africa. Between 5-10% of the continent s GDP may be needed to deal with the impacts of climate change Despite clear and undeniable impacts and scientific predictions of more serious problems in the future, there is little movement in Africa towards managing risks and taking adaption measures There are ongoing efforts to cope and adapt, but they are far below the level of effort required to deal with a threat as seriousness of that present by climate change
5 Weather and climate services are not adequately funded Infrastucture for dealing with floods and droughts is inadequate Local farmers have been left to rely on indigenous knowledge to adapt to climate change; not benefited from science and technology advances Funding of research for drought resistant, water logging-tolerant, disease resistant and fast growing crop species inadequate Watershed management interventions are inadequate; critical ecosystems continue to be degraded
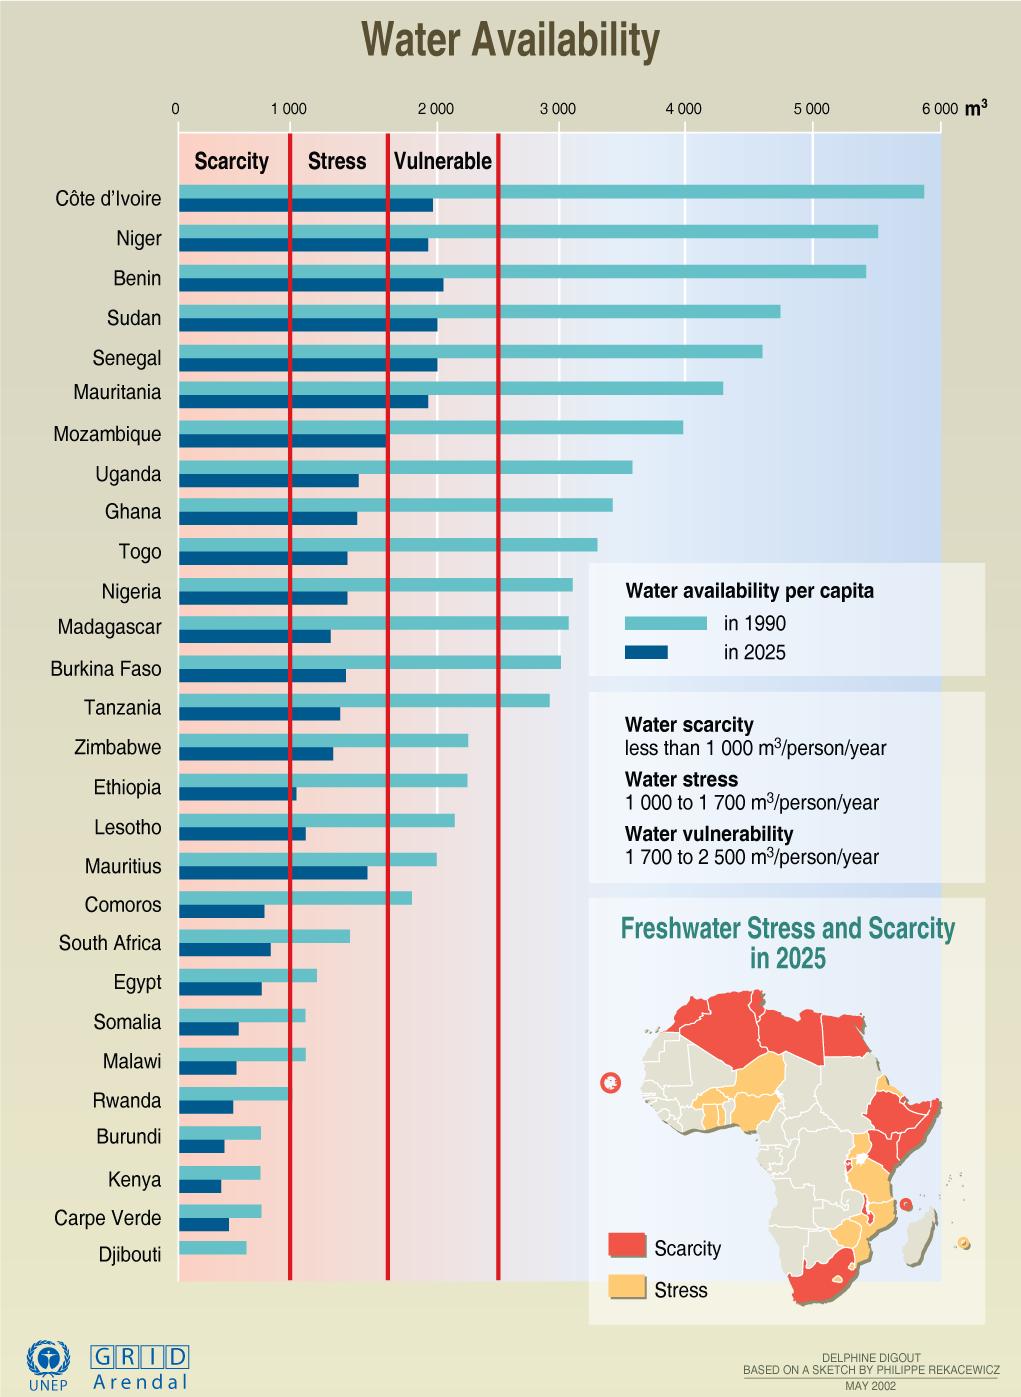
6 Africa s vulnerability to climate change is attributed to multiple factors, among which are: Heavy dependence on rain-fed agriculture High population density and population growth rates which increases the demand for water, food livestock forage, wood fuel, etc Widespread poverty Many parts of the continent already water scare
7 Rampant disease Weak economies, and limited resources for adaptation Weak institutional capacity Poor infrastructure
8
 14 models from laboratories worldwide spanning over a horizontal resolution of about")
9 (1) This work allows us to : Quantify the sub-regional variability of the climate response to global warming Identify whether climate change hot-spots exist over different subregions of Africa. Sensitivity of the RCCI to different GHG emission scenarios and to different periods within the 21st century (2) 14 models from laboratories worldwide spanning over a horizontal resolution of about 1-4 degrees are used table(1). (3) The selected IPCC scenario represents: B1 with CO2 concentration of about 550 ppm by 2100 A1B with CO2 concentration of about 700 ppm by 2100 A2 with CO2 concentration of about 850 ppm by 2100

10 The climate change flowchart, with Causes of Climate Change highlighted.

11 The complexity of global climate models has increased enormously over the last four decades, as shown in this graphic
12 Table (1): List of CMIP3 Models Used in the Analysis Models Origin Grid interval Scenarios and ensemble members 20C A1B A2 B1 CCMA-3-T47 CCMA, Canadian ~2.7 deg CNRM-CM3 CERFACS, France ~2.8 deg CSIRO-MK3 CSIRO Atmos. Res., Australia ~2.3 deg GFDL-CM2-0 Geophys. Fluid. Dyn. Lab., USA ~2.2 deg GISS-ER NASA Goddard Inst., USA ~4.5 deg INMCM3 Insit. Numer. Math., Russia ~4.5 deg IPSL-CM4 IPSL, France ~3.0 deg MIROC3-2M JAMSTEC, Japan ~2.8 deg MIUB-ECHO-G Germany/Korea ~3.2 deg MPI-ECHAM5 MPI, Hamburg, Germany ~2.3 deg MRI-CGCM2 MRI, Japan ~2.8 deg NCAR-CCSM3 NCAR, USA ~1.4 deg NCAR-PCM1 NCAR, USA ~2.8 deg UKMO-HADCM3 UK Meteorological Office ~3.0 deg
13 Table (2) : Seven regions in Africa over which the RCCI is Calculated Region Longitude Latitude SMED Southern Mediterranean 10.5 W E 30 N - 38 N SAH Sahara 19 W E 18 N 30 N WAF Western Africa 19 W E 0 18 N EAF Eastern Africa 20.5 E 52.5 E 0 18 N EQF Equatorial Africa 28.5 E 43.5 E 8 S 4 N SQF South Equatorial Africa 0.5 E 55.5 E 26 S - 0 SAF Southern Africa 9.5 E 40.5 E 35 S 26 S
14 Monthly data for the CMIP3 experiments are obtained from the PCMDI web site ( Each CMIP3 experiment consists of a control run ( ) with constant ( present day ) atmospheric CO2 and of a greenhouse run ( ) with a standard gradual (1% yr21 compound) increase in CO2. Because the models utilize different horizontal grids, for intercomparison purposes we interpolate the model data onto a common global 1 degree grid. In addition, a common 1-degree land mask grid is defined, based on the half-degree grid of the observed dataset from the Climatic Research Unit (CRU) of the University of East Anglia

15


16
17 A Regional Climate Change Index (RCCI) is defined based on four variables: (1) change in regional mean surface air temperature relative to the global average temperature change (or Regional Warming Amplification Factor, RWAF), (2)change in mean regional precipitation (ΔP, % of present day value), (3)change in regional surface air temperature interannual variability (ΔσT, % of present day value), (4) change in regional precipitation interannual variability (ΔσP, % of present day value). The RCCI is defined as:
18 Table (3): Values of the factor n in the definition of the RCCI. n P σ P RWAF σ T 0 <5% <5% <1.1 <5% % 5-10% % % 10-20% % 4 >15% >20% >1.5 >15%

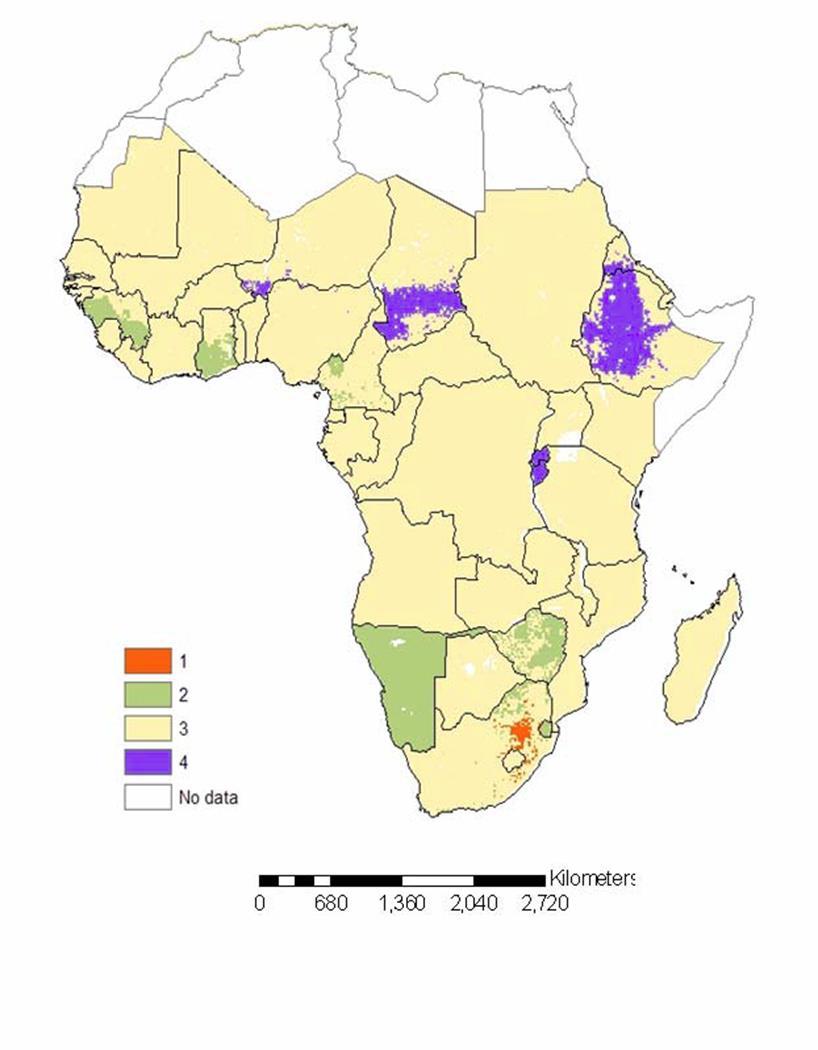
19 Figure 1 Hotspots over Africa The period , A1B, A2 and B1 Scenario Ensemble
20 Figure 1 shows the ensemble mean of RCCI over Africa based on the three scenarios A1B, A2, and B1 for the periods: , i.e. the period when the climate change signal is maximum, with respect to We find that the RCCI shows pronounced spatial variability over this region, varying from values less than 8 to greater than 16. SMED and SAH have the largest RCCI value, where the contribution comes from decrease in mean precipitation in the two seasons, and small increase in the RWAF in MAMJJA and the increase in precipitation interannual variability in MAMJJA and SONDJF seasons. WAF, EAF, EQF have similar RCCI values and the contributions come from the increase in mean precipitation in the SONDJF season.
21 Over EQF, there is a small increase in the precipitation in MAMJJA and a large increase in SONDJF. Over WAF there is a small increase in precipitation in the SONDJF case. A large increase in precipitation is found over the EAF in the SONDJF season. SAF RCCI value is relatively large and the contributions come from the decrease in the mean precipitation in the MAMJJA season, and small increase in the precipitation variability in the two seasons. The contribution of precipitation generally shows complex patterns and substantial variability, especially for the interannual variability as shown in figure(2). For mean precipitation we can see symmetrical patterns around the equator which is consistent with the symmetry in the climatic zones in the northern and southern hemispheres in Africa.


22 Figure (2) Change in mean regional precipitation (ΔP)
23 The contribution of the changes in interannual variability shows complex patterns and marked geographical variations as shown in Figure (3). The results indicated that are is an increase in the precipitation interannual variability, with noticeable exceptions occurring over parts: (1) in Mali and Niger in the WAF, (2) North West of Sudan in EAF, and (3) over Uganda in the EQF. The increase in variability is especially pronounced over SMED and SAH in the two seasons, while in SQF and SAF we find small increase in the precipitation variability. The marked spatial variability of the change in variability further highlights the need of a fine scale analysis of climate change variables.
24 Figure (3) change in regional precipitation interannual variability (ΔσP)
25 Figure (4) show the contribution of mean temperature change compared to global temperature change (RWAF) in both seasons. RWAF shows a latitudinal gradient, with maximum values in the northern regions and decreasing values toward the equator, then increases again toward the south, with low values ( < 1.1 ) around the coast line of Africa. This result is consistent with the basic latitudinal distribution of warming and also robust with the symmetry of climatic zones in the Northern Hemisphere as in the Southern Hemisphere, as they are arranged symmetrically on either side of the equator. Thus the RWAF produces large contributions to the SMED, SAH and SAF regions


26 Figure (4) : Regional Warming Amplification Factor, (RWAF)
27 Figure (5) shows the contribution of changes in interannual temperature variability shows a more complex spatial distribution. In MAMJJA, the contribution is especially large over the SAH in the north Egypt and north Libya, middle WAF and middle SQF. In SONDJF, the contribution of temperature variability change is maximum over the middle SQF. The west coast of Africa exhibits very small decrease in the temperature variability in the SONDJF season.


28 Figure (5) : The interannual standard deviation (ΔσT)
29 Figure (6) shows the RCCI values averaged over each of the 7 regions of Africa calculated for 5 successive 20-year periods ( , , , , ) with respect to and for the mid-range A1B scenario, high-range A2 scenario, lowrange B1scenario, and their average. In general, we find increasing values of RCCI with time, and thus with GHG forcing. we define an RCCI threshold of 10 to identify a hot-spot, the first to appear in is SAH for A2, and having only a slightly smaller value for A1B and smaller in B1 scenario. The RCCI for the SMED, SAH, and SAF regions increases almost linearly with time in the full ensemble average. However we also notice a decrease towards the end of the century for the SMED region in the B1 scenario, a decrease towards the end of the century for the SAH region in the A2 scenario, and a decrease towards the end of the century for the SMED and SAH regions in the A1B scenario.
30 Figure (6): Variation of the RCCI with the five 20-year periods of the 21st century for A1B, A2, B1 and scenario ensemble, for 7 regions in Africa
.")
31 In summary, the RCCI and the underlying changes that contribute to it, exhibit marked sub-regional variability that allows us to identify more hot-spots at spatial scales smaller than the sub-continental one used. The evaluation of RCCI with time slices indicated a rather complex spatial and temporal dependency of the sub-regional hot-spots on the GHG concentration (and forcing). This makes it difficult to linearly extrapolate the results of a RCCI analysis across regions, scenarios and time slices. The identification of sub-regional hot-spots may provide important information for climate impact assessment studies and for designing priorities in terms of national and cross-national adaptation and mitigation policies. In this regard, the RCCI only provides an overall measure of climate response based on a limited number of variables and it is not aimed at specific impact applications. On the other hand, a RCCI-based analysis can be especially useful in providing insights on the behavior of regional climate changes in relation to globally averaged warming and as such it can provide a useful tool to identify areas that are responsive and possibly vulnerable to climate change.

32 Any Questions Thank You