SPECIAL MONTHLY REPORT ON ENERGY (MAY 2018)
|
|
|
- Lora Ball
- 5 years ago
- Views:
Transcription


1 SPECIAL MONTHLY REPORT ON (MAY 2018)
2 PERFORMANCE (April 2018) (% change) NYMEX Natural Gas Crude oil MCX PERFORMANCE (January - April 2018) (% change) NYMEX MCX Natural Gas Crude oil 1
3 COMPLEX Overview In the month of April crude oil prices ended on positive path as geopolitical tensions in Middle East and expectations of Iran sanctions by US supported its prices. Overall it managed to hover in range of $ in NYMEX and in MCX. Crude oil investors took no chances that Iran s nuclear deal with Western powers will remain intact in May meeting. Prices were driven by supply concerns amid prospects of the United States re imposing sanctions on Iran, while OPEC-led producers continue to withhold supplies. Global oil markets received support due to a sense that there were high risks of supply disruptions, including a potentially spreading conflict in the Middle East, renewed U.S. sanctions against Iran and falling output as a result of political and economic crisis in Venezuela. Global oil demand data so far in 2018 has come in line with the optimistic expectations, with 1Q18 likely to post the strongest year-on-year growth since 4Q10 at 2.55 million barrels per day. Meanwhile rising U.S. production, which has jumped by a quarter since the middle of 2016 to million barrels per day (bpd) can cap the upside. push prices upwards as markets have not fully priced in size and magnitude of Iran sanctions. Meanwhile crude inventories rose 2.2 million barrels in the week to April 20, compared with expectations for decrease of 2 million barrels. Crude oil can take support near 4300 and can further rise towards 4900 in domestic bourses. Key News Iran tensions Iran's foreign minister stated that U.S. demands to change its 2015 nuclear agreement with world powers were unacceptable, as a deadline set by President Donald Trump for Europeans to "fix" the deal loomed. Iran resumed its role as a major oil exporter in January 2016 when international sanctions against Tehran were lifted in return for curbs on Iran's nuclear program. European powers still want to hand Trump a plan to save the Iran nuclear deal this week on May 12, but they have also started work on protecting EU-Iranian business ties if the US president makes good on a threat to withdraw from the deal. Iran resumed its role as a major oil exporter in January 2016 when international sanctions against Tehran were lifted in return for curbs on Iran's nuclear program. Outlook Crude oil prices may remain on upside path but profit booking at higher levels cannot be denied. On the one side concerns of U.S. exit from the Iran nuclear deal and sanctions on Iran is assisting the prices but one the other side rising greenback and increasing US production can lead to profit booking. French President Emmanuel Macron s prediction that U.S. will pull out of Iran nuclear accord stoked concerns about renewal of sanctions that would slash crude exports from OPEC s third-largest producer. The whole focus for market will be on whether President Trump will decide to re impose sanctions on Iran in coming weeks. If sanctions are levied on Iran, least 250,000 to 350,000 bpd of Iranian crude could be at risk of disruption if sanctions are brought back into place which will U.S. oil stocks build unexpectedly despite record high exports -EIA U.S. crude oil and gasoline inventories unexpectedly rose last week even as exports hit record highs, the Energy Information Administration said on Wednesday in an overall bearish report that raised some concerns about oversupply. Crude inventories rose 2.2 million barrels in the week to April 20, compared with expectations for a decrease of 2 million barrels. Russia remains China's top oil supplier for a 13th month in March Russia was China's largest crude oil supplier in March, data showed on Tuesday, retaining the lead spot for a 13th consecutive month. Last month, Russia supplied 5.79 million tonnes, equal to 1.36 million barrels per day (bpd), up 23.6 percent from the same month a year 2

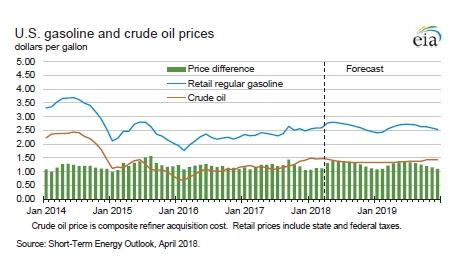
4 earlier, data from the General Administration of Customs showed. Russia has been the biggest oil exporter to China since March last year. Improvements include longer horizontal pipe laterals, shorter drilling and completion times, greater prop pant intensity, and the use of multiple wells at a single location. As a result, well productivity continues to rise. U.S. shale output to rise by 125,000 bpd in May -EIA U.S. shale oil production is expected to increase in May for the fourth consecutive month, U.S. Energy Information Administration data showed recently, boosted by record production in the prolific Permian Basin of West Texas and New Mexico. Total oil output is set to rise by 125,000 barrels per day (bpd) to 7 million bpd, the EIA said in its monthly drilling productivity report. United States increasing crude oil output U.S crude oil output rose to a record 10.4 mb/d in March, surpassing its 1970s peak and overtaking Saudi Arabia as the second largest producer. Much of the increase has been from shale deposits, which account for nearly two-thirds of U.S. crude production. The U.S. Energy Information Administration projects U.S. crude production will reach 11.3 mb/d by the fourth quarter of 2018, and average 11.4 mb/d in The rise in oil prices over 2017 and into 2018 has supported shale oil production. Production has also benefited from improvements in efficiency, reduced costs, and technological and managerial innovation. Oil rigs count U.S. energy companies added oil rigs for a fifth week in a row as they follow through on plans to spend more on drilling this year with higher crude prices boosting their profits and pushing nationwide production to record highs. Drillers added nine oil rigs in the week to May 4, bringing the total count to 834, the highest level since March Highlights of latest IEA report US Crude oil production EIA estimates that U.S. crude oil production averaged 10.4 million barrels per day (b/d) in March, up 260,000 b/d from the February level. Total U.S. crude oil production averaged 9.3 million b/d in EIA projects that U.S. crude oil production will average 10.7 million b/d in 2018, which would mark the highest annual average U.S. crude oil production level, surpassing the previous record of 9.6 million b/d set in EIA forecasts that 2019 crude oil production will again increase, averaging 11.4 million b/d. EIA forecasts higher gasoline prices For the 2018 April September summer driving season, EIA forecasts U.S. regular gasoline retail prices to average $2.74/gallon (gal), up from an average of $2.41/gal last summer. The higher forecast gasoline prices are primarily the result of higher forecast crude oil prices. For all of 2018, EIA expects U.S. regular gasoline retail prices to average $2.64/gal and gasoline retail prices for all grades to average $2.76/gal, which would result in the average U.S. household spending about $190 (9%) more on motor fuel in 2018 compared with Venezuela production decrease Economic and political instability in Venezuela continues to affect its crude oil production. EIA 3
 in March, a decline of about 24% year-over-year.")
5 estimates Venezuelan crude oil production averaged 1.5 million barrels per day (b/d) in March, a decline of about 24% year-over-year. Brent WTI Spread Analysis: Brent WTI crude oil spread can hover in range of $ in the month of May. Source: Reuters 4

6 5


7 6
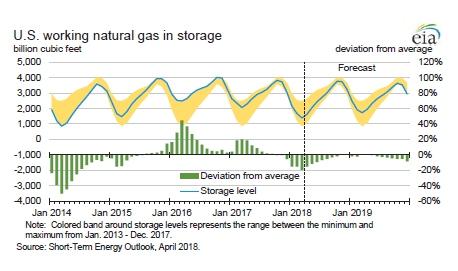
8 Natural Gas Overview Natural gas ended the month of April on slight positive bias due to demand from colder weather conditions in US. Overall it traded in range of $ in NYMEX and in MCX in the month of April. US witnessed mostly the cooler temperature levels across the entire region whereas the central & western counties had lower to normal temperature levels being at levels of 30%-70% below normal temperature levels. Outlook Natural gas can trade sideways as weather related demand can give further direction to the prices. The U.S. Energy Information Administration added 62 billion cubic feet (bcf) of gas into storage during the week ended April 27, the first build this year. It was the first build of the storage injection season. That compared with a decline of 18 bcf in the penultimate week, an increase of 67 bcf a year earlier and a fiveyear average rise of 69 bcf. Natural gas can trade sideways as it can take support near 170 and can face resistance near 195 in the month of May. EIA estimates of Natural gas Growing U.S. natural gas production is expected to support both growing domestic consumption and increasing natural gas exports in the forecast. EIA forecasts U.S. consumption of natural gas to increase by 4.2 Bcf/d (5.7%) in 2018 and by 0.7 Bcf/d (0.9%) in 2019, with electric power generation the leading contributor to this increase. EIA expects Henry Hub natural gas spot prices to average $2.99/million British Thermal units (MMBtu) in 2018 and $3.07/MMBtu in EIA forecasts that natural gas production in the Federal Gulf of Mexico will average 2.6 billion cubic feet per day (Bcf/d) in 2018 and 2.5 Bcf/d in These forecasts are 0.7 Bcf/d and 0.8 Bcf/d lower, respectively, than in the March STEO. The lower expected production levels are the result of EIA s reassessment of production given historical decline rates in the Federal Gulf of Mexico. Weather.. Key price driver Weather in key demand areas has been erratic this year and there is really nothing to stop this trend from continuing. This could mean an extended spring or an early summer. The big concern at this time is how much of the storage gap can be filled before the start of the summer cooling season. An early summer could be bullish for prices because it would mean lower-than-average weekly injections. This would delay the normal storage build. So at this time, the focus will be on the weather. Remember normal temps will allow the storage gap to be filled before the heat comes. 7


9 8

10 9
11 Vandana Bharti (AVP - Commodity Research) Boardline : Extn: 625 vandanabharti@smcindiaonline.com Sandeep Joon Sr. Research Analyst (Metal & Energy) Boardline : Extn: 683 sandeepjoon@smcindiaonline.com researchfeedback@smcindiaonline.com Corporate Office: 11/6B, Shanti Chamber, Pusa Road, New Delhi Tel: Mumbai Office: Lotus Corporate Park, A Wing 401 / 402, 4th Floor, Graham Firth Steel Compound, Off Western Express Highway, Jay Coach Signal, Goreagon (East) Mumbai Tel: , Fax: Kolkata Office: 18, Rabindra Sarani, Poddar Court, Gate No-4,5th Floor, Kolkata Tel.: / Fax: / SMC Global Securities Ltd. (hereinafter referred to as SMC ) is regulated by the Securities and Exchange Board of India ( SEBI ) and is licensed to carry on the business of broking, depository services and related activities. SMC is a registered member of National Stock Exchange of India Limited, Bombay Stock Exchange Limited, MSEI (Metropolitan Stock Exchange of India Ltd.) and M/s SMC Comtrade Ltd is a registered member of National Commodity and Derivative Exchange Limited and Multi Commodity Exchanges of India and other commodity exchanges in India. SMC is also registered as a Depository Participant with CDSL and NSDL. SMC s other associates are registered as Merchant Bankers, Portfolio Managers, NBFC with SEBI and Reserve Bank of India. It also has registration with AMFI as a Mutual Fund Distributor. SMC is a SEBI registered Research Analyst having registration number INH SMC or its associates has not been debarred/ suspended by SEBI or any other regulatory authority for accessing /dealing in securities/commodities market. The views expressed by the Research Analyst in this Report are based solely on information available publicly available/internal data/ other reliable sources believed to be true. SMC does not represent/ provide any warranty expressly or impliedly to the accuracy, contents or views expressed herein and investors are advised to independently evaluate the market conditions/risks involved before making any investment decision. The research analysts who have prepared this Report hereby certify that the views /opinions expressed in this Report are their personal independent views/opinions in respect of the subject commodity. DISCLAMIER: This Research Report is for the personal information of the authorized recipient and doesn't construe to be any investment, legal or taxation advice to the investor. It is only for private circulation and use. The Research Report is based upon information that we consider reliable, but we do not represent that it is accurate or complete, and it should not be relied upon as such. No action is solicited on the basis of the contents of this Research Report. The Research Report should not be reproduced or redistributed to any other person(s)in any form without prior written permission of the SMC. The contents of this material are general and are neither comprehensive nor inclusive. Neither SMC nor any of its affiliates, associates, representatives, directors or employees shall be responsible for any loss or damage that may arise to any person due to any action taken on the basis of this Research Report. It does not constitute personal recommendations or take into account the particular investment objectives, financial situations or needs of an individual client or a corporate/s or any entity/s. All investments involve risk and past performance doesn't guarantee future results. The value of, and income from investments may vary because of the changes in the macro and micro factors given at a certain period of time. The person should use his/her own judgment while taking investment decisions. Please note that SMC its affiliates, Research Analyst, officers, directors, and employees, including persons involved in the preparation or issuance if this Research Report: (a) from time to time, may have long or short positions in, and buy or sell the commodity thereof, mentioned here in or (b) be engaged in any other transaction involving such commodities and earn brokerage or other compensation or act as a market maker in the commodities discussed herein(c) may have any other potential conflict of interest with respect to any recommendation and related information and opinions. All disputes shall be subject to the exclusive jurisdiction of Delhi High court. All disputes shall be subject to the exclusive jurisdiction of Delhi High court. 10