Life After the ITC. Solar Focus Moderator:
|
|
|
- Tobias Harrison
- 5 years ago
- Views:
Transcription
1 Life After the ITC Solar Focus 2014 Moderator: Yuri Horwitz, Sol Systems Shayle Kann, GreenTech Media Lidija Sekaric, Department of Energy Ralph Mannion, Kingspan Energy


2 Forecasting 2017 Shayle Kann Senior Vice President, Research Greentech Media MDV SEIA Solar Focus November 2014
3 Installed Price ($/W) How Far Will System Prices Fall? $6.00 $ Price Reduction: 21%-27% $4.00 $3.00 $2.00 $1.00 $ E 2015E 2016E 2017E 2018E 2019E 2020E Residential Commercial Utility 4 Source: GTM Research/SEIA U.S. Solar Market Insight
4 Residential Installed Price ($/W) Source of Residential System Price Reduction Price Reductions Won t Come From the Module 70% 60% 50% 40% 30% 58% 42% Module Price Reduction BOS Price Reduction 30% 20% 10% 10% 0% $6.00 $4.00 $4.84 $4.11 $3.66 $3.38 $3.12 $2.89 $2.66 $2.46 $2.32 $2.00 $ E 2015E 2016E 2017E 2018E 2019E 2020E 4 Source: GTM Research
5 Installations (MWdc) So What Happens in 2017? 12,000 U.S. PV Market Forecast, E 10,000 8,000 6,000 4,000 2, E 2015E 2016E 2017E 2018E Residential Non-Residential Utility 4 Source: GTM Research/SEIA U.S. Solar Market Insight
6 Thank You! Shayle Kann Senior Vice President, Research Greentech Media Questions? Visit Or contact

7 Life After ITC SEIA/MDV Panel Dr. Lidija Sekaric Solar Energy Technologies Office
: PV is at grid-parity in 10 states and by 2016 the number of states could increase to 47 (with 30% ITC) At 10% ITC, PV will still be competitive in 36 states Lazard s Sept.")
8 Two Analyst Reports Show PV Competitiveness to Traditional Generation Deutsche Bank (Oct. 14): PV is at grid-parity in 10 states and by 2016 the number of states could increase to 47 (with 30% ITC) At 10% ITC, PV will still be competitive in 36 states Lazard s Sept. 14 LCOE reports similar numbers, w/ utility-scale PV at $0.06/kWh by 2017 (w/ 10% ITC) 2017 (10% ITC) Unsubsidized Levelized Cost of Energy Comparison Offshore Next-gen w/ CC 8 Source: Bloomberg (10/29/14); Lazard, Lazard s LCOE Analysis Version 8.0 (Sept. 2014).
9 PV Utility-Scale System Pathway to SunShot Source: T. James, et al. NREL Internal Cost Model.

10 PV Residential-Scale System Pathway to SunShot Source: T. James, et al. NREL Internal Cost Model.
11 Manufacturing Cost (Nominal $/W) PV Manufacturers Cost $2.25 $2.00 $1.75 $1.50 $1.25 $1.00 First Solar Suntech Yingli Trinia Solar Canadian Solar Hanwha SolarOne Jinko Solar $0.75 $0.50 $0.25 $0.00 Q1 '10 Q2 '10 Q3 '10 Q4 '10 Q1 '11 Q2 '11 Q3 '11 Q4 '11 Q1 '12 Q2 '12 Q3 '12 Q4 '12 Q1 '13 Q2 '13 Q3 '13 Q4 '13 Q1 '14 Q2 '14 11 Sources: Corporate public filings.
12 Avg. System Price (Nominal $/W DC ) Avg. System Price (Nominal $/W DC ) Average System Pricing by Size & Region 100 kw 500 kw & 500kW 2 MW $ kw kw $ kw - 2 MW $7.00 CA, Host-owned CA, 3rd-party $7.00 CA, Host-owned CA, 3rd-party $6.00 MA, Host-owned $6.00 MA, Host-owned $5.00 $5.00 $4.00 $4.00 $3.00 $3.00 $ YTD $ YTD System prices in the above states, of the above sizing, fell on average 5 25% between 2013 & 14 YTD Consistent declines experienced over 5 years H1 14 MW: ( kW) CA H.O. (29); CA 3 rd -P (14); MA H.O.(3); (500kW-2MW). CA H.O. (18); CA 3 rd -P (17); MA H.O.(8). Sources: CSI Database, accessed 07/02/14; MA SREC Program, accessed 07/09/14. Note: MA does not report whether a system is 3 rd -party owned therefore it was estimated using the applicant entity or installer for the following organizations: SolarCity, CPF Capital, SunRun, Vivint, Sungevity. 12
13 Quarterly Installations (MW) % of Total Quarterly Installations Quarterly Installations % of Total Quarterly Installations Systems Installed Without Incentives Q4 '11 Q1 '12 Q2 '12 Q3 '12 California Q4 '12 Q1 '13 Q2 '13 Q3 '13 Q4 '13 Q1 '14 Q2 '14 100% 90% 80% 70% 60% 50% 40% 30% 20% 10% 0% CSI Installs Non-CSI, CA Distributed CSI % of Total Arizona % % 50 80% 40 60% % 10 20% 0 0% Q3 '13 Q4 '13 Q1 '14 Q2 '14 Q3 '14 APS & SRP w/ incentives APS & SRP w/o incentives % of capacity w/ incentives CA distributed PV installations continue to grow, however majority of them are now doing so without CSI incentives (more than 100 MW in Q2 14) In Arizona, many systems that are installed without incentives Sources: CA: CSI Database, accessed 10/01/14; GTM/SEIA Q U.S. Solar Market Insight. AZ: APS & Salt River Project (SRP), accessed 10/06/14. Dataset segmented by incentive type ; all projects listed as non-incentive, nonincentive residential, or non-incentive commercial assumed to have received non incentives. 13
14 Capacity (GW AC ) U.S. Utility-Scale Solar Projects (> 5MW) PV - Under Construction PV - Operating CSP - Under Construction CSP - Operating Q1 '10 Q2 '10 Q3 '10 Q4 '10 Q1 '11 Q2 '11 Q3 '11 Q4 '11 Q1 '12 Q2 '12 Q3 '12 Q4 '12 Q1 '13 Q2 '13 Q3 '13 Q4 '13 Q1 '14 Q2 '14 Q2 '14 Large-scale PV and CSP plants face challenges with anticipation of ITC step-down 14 Note: As of 10/23/14.
15 Sources of Utility-Scale PV Costs LCOE vs. Upfront Costs LCOE (2013$/kWh) Utility ground mount (Fixed axis) $1.80/W $0.12 Site Preparation 3% Land Acquisition 2% Permitting & Commissioni ng 8% Installer Profit & OH 8% Labor 12% Sales Tax 5% Installation Materials 19% Module 36% Inverter 7% 9% Financing, $ % Financing, $0.020 O&M, $0.019 Upfront Soft Costs, $0.016 Hardware Costs, $0.029 There are a significant amount of hardware and business operations that contribute to the upfront cost of utility-scale PV However, equally important to the competitiveness of PV is the cost of financing these systems A required 9% rate of return represents 42% of a PV system s LCOE Reducing financing costs to inflation would be the equivalent of cutting all hardware costs $0.10 $0.08 $0.06 $0.04 $0.02 $0.00 LCOE - utility ground mount 15 Sources: NREL internal cost modeling. Note: numbers quoted in $2013.
16 LCOE (2013$/kWh) Sources of Residential PV Costs LCOE vs. Upfront Costs Supply chain costs 6% Permitting & Commissioni ng 3% Residential Rooftop $3.29/W Sales Tax 3% Installer Profit & OH 29% Labor 9% Module 21% Installation Materials 19% Inverter 10% $0.250 $0.200 $0.150 $0.100 $0.050 $ % Financing, $ % Financing, $0.037 O&M, $0.030 Upfront Soft Costs, $0.043 Hardware Costs, 4% LCOE - Residential Rooftop The potential impact on the LCOE of residential rooftop PV is greater due to its current higher required rate of return Reducing financing costs to 2.5% could reduce 32% of LCOE 16 Sources: NREL internal cost modeling. Note: numbers quoted in $2013.
17 LCOE ($/kwh) Yearly payments Opportunities for Solar Loans Solar-specific loan financing is growing in the United States LCOE of loans was found to be 19%-29% lower than LCOE of PPA s due largely to the higher cost of capital for TPO LCOE of residential PV systems, financed under a PPA or loan, compared to retail rates $0.30 $0.25 $0.20 $0.15 $0.10 $0.05 $0.00 $0.142 $ year Loan 10-year Loan $ year Loan $ year PPA $0.255 SDG&E Res. Tier 2/3 $3,500 $3,000 $2,500 $2,000 $1,500 $1,000 $500 $0 Comparison of annual payment between residential PV systems, financed under a PPA or loan, and retail rates Years 5-year Loan 10-year Loan 20-year Loan 20-year PPA SDG&E Res. Tier 2/3 17 Source: Banking on Solar: An Analysis of Banking Opportunities in the U.S. Distributed Photovoltaic Market, NREL, forthcoming.
18 Solar Finance GTM/SEIA report that more than 1.5 GW of PV has been, or will be, used to finance publicly traded investment vehicles In Sept/Oct. 14 SolarCity launched several financial initiatives Launched its first residential loan product in eight states 30 year term of loan; rate as low as 4.5%; no penalties or fees for prepayments SolarCity s CEO quoted saying loans may required $0.5B - $1.0B to finance in 2015 Has filed to sell up to $200MM worth of solar asset-backed debt directly to the general public through their on-line platform (Common Assets) minimum purchase requirement is $1,000, maturities range from 1-7 years, and interest rates go up to 4% Nextera Solar Fund announced in Sept. 14 it would raise $426MM by selling shares in order to purchase more projects SunEdison filed papers in Sept. 14 to form second yield-co, this one focusing on operating projects in Asia and Africa NY Greenbank announced in Oct. 14 its first seven programs, which will provide $800MM in public and private funding over several years NYSERDA/LI PSEG this summer announced the introduction of on-bill recovering loan program that allows customers to repay loans through their electricity bills 18 Sources: Bloomberg (10/08/14, 10/16/14); BNEF (09/10/14, 09/24/14, 10/17/14, 10/24/14); Forbes (10/08/14); GTM/SEIA Q2 14 SMI; Seeking Alpha (10/15/14)


19 Capital market participation requires Liquidity and Price Transparency Feedback from Rating Agencies and Investors Consistency in Cash Flows Investor Confidence in Asset Performance Tools to Conduct Due Diligence


20 NREL Public Access to Capital Projects ( ) Project Goal Activities Expand availability of capital Lower cost of capital Reduce transaction cost, time to access capital Organize the industry around: Standard documents Best Practices Robust datasets Conduct analysis to comprehend opportunities and barriers Promote adoption by developers, financiers, law firms, etc.

21 Balance of System (Soft Costs)


22 ROOFTOP SOLAR CHALLENGE FAST, ONLINE INTERCONNECTION Local Innovations to Make Solar Faster, Easier, Cheaper CHICAGO, IL } CITY BROWARD COUNTY, FL CONNECTICUT COUNTY SAME-DAY / EXPEDITED PERMITTING SOLARIZE & FINANCING PROGRAMS } PACIFIC NORTHWEST STATE REGION
23 23
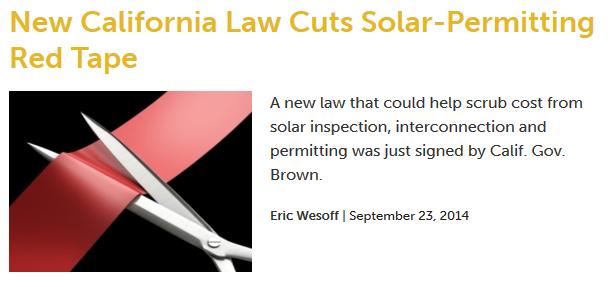
24 Impact of Permitting and Local Regulatory Processes on PV Prices Results suggest that 13-19% of the total PV price change from 2011 to 2012 might be attributed to improvements in permitting and other local regulatory processes Source: Burkhardt, J., Wiser, R., Darghouth, N., Dong, C., Huneycutt, J. How Much Do Local Regulations Matter? Exploring the Impact of Permitting and Local Regulatory Processes on PV Prices in the United States, LBNL,

25 SunShot Incubator Program


26 Find the Customer


27 Prepare the quote

28 Finance the system


29 Install, Connect, Maintain
30 Creating A Soft Cost Ecosystem


31 Augmented Reality Edition SUNLAYAR, INC. A cloud-based software platform architected by solar industry and technology veterans, designed to digitize and pare down much of the workload (soft costs) needed across the majority of the residential solar provider value chain. Sunlayar AR Edition could reduce solar soft costs by $0.31.
32 Thank you Lidija Sekaric SunShot Initiative US Department of Energy 32
33 Ralph Mannion Kingspan Energy

34 Thanks to our sponsors!

35 Thanks to our sponsors!

36 Thanks to our sponsors!
37 Thanks to our sponsors!