CORAL GABLES SUSTAINABILITY MANAGEMENT PLAN. Photo by Ahren D.
|
|
|
- Rodney Logan
- 5 years ago
- Views:
Transcription


1 CORAL GABLES SUSTAINABILITY MANAGEMENT PLAN Photo by Ahren D.
2 PROJECT OVERVIEW SOLUTIONS ENGAGEMENT RESULTS Kick Off Meeting Assessments & Solutions for Government Operations Greenhouse Gas Inventory Collaborative Workshops & Coordination with the Project Team Development of Government Operations Project-Driven SMP Public Involvement Plan & Community Sustainability Vision Implementation Strategy & Preparation of Funding Analysis Marketing & Communications Plan
3 FOCUS AREAS Energy Water Materials Fleet Climate Land Use & Transportation Outreach Finance
4 GOALS Goals by Focus Area*** Focus Area Action Intermediate Target (2019)** Long Term Target (2025) Energy Reduce electricity use 15% 20% Water Reduce water consumption 8% 20% Materials Divert solid waste* 60% 75% (2020)**** Fleet Reduce fossil fuel use 2% 20% Climate Reduce greenhouse gas emissions 20% *City operations and single family residential waste **Aligns with the City s 3-year Strategic Plan ***all goals are set relative to 2013 baseline levels **** Complete by 2020 to meet State s Waste Diversion Goal
5 GOALS BY FOCUS AREA Focus Area Action 2013 Baseline Intermediate Target (2019)** Energy Reduce electricity use 15,151,043 kwh 2,272,656 kwh (15%) Water Reduce water 101,893 kgal 8,151 kgal consumption (8%) Materials Divert solid waste* 44,428 tons 20,336 tons (60%) Fleet Reduce fossil fuel use 436,106 gallons 8,722 gallons (2%) Climate Reduce greenhouse gas 13,762 mtco2e emissions 771,972 mtco2e Long Term Target (2025) 3,030,208 kwh (20%) 20,378 kgal (20%) 33,321 tons (75%) 87,221 gallons (20%) 2,752 mtco2e 154,394 mtco2e (20%) *City operations and single family residential waste **Aligns with the City s 3-year Strategic Plan ***all goals are set below 2013 baseline levels **** Complete by 2020 to meet State s Waste Diversion Goal

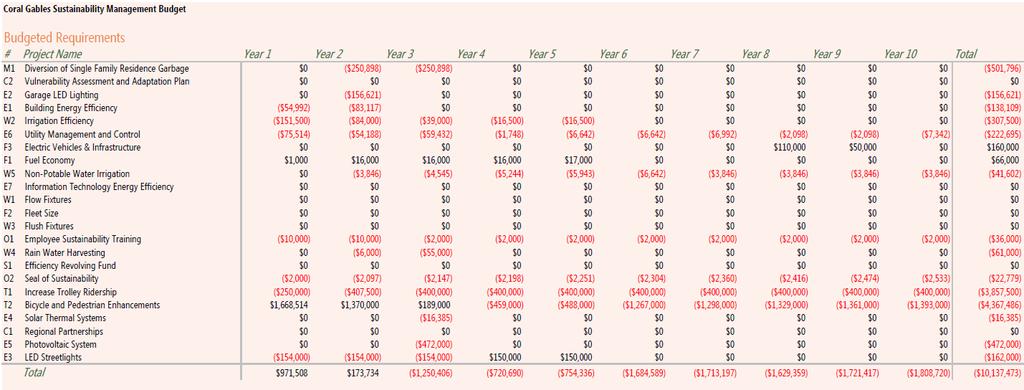
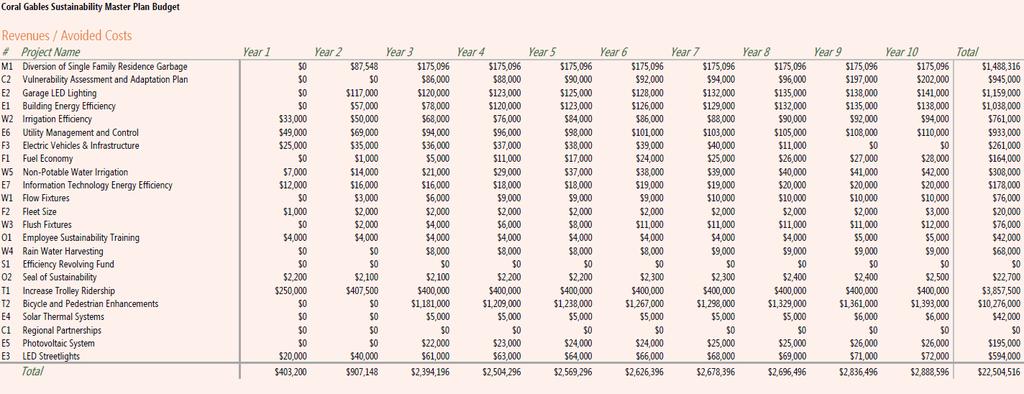
6 Net Present Value (NPV) the value in the present of a sum of money, in contrast to some future value it will have when it has been invested at compound interest.
7
8
9
10
 is down 4.")
11 OPTIMIZE ENERGY EFFICIENCY City Electricity Use (Includes facilities and Streetlights) is down 4.48% from FY 2013
 Upgraded HVAC at")

12 OPTIMIZE ENERGY EFFICIENCY Conducted energy audits (PW 72 nd Ave Facility & Youth Center). Exploring potential financing mechanisms. LED lighting upgrades (PW Maintenance Facility, City Hall Parking Lot, Burger Bob s, Youth Center Lobby, Adult Activity Center, Ramps/Entrance PG 2 & 6) Upgraded HVAC at PW 72 nd Ave, Radio Shop, City Hall (1) Identifying facilities utilize renewable energy (PW 72 nd Ave & Youth Center) Network Connected Equipment: HVAC Systems allow for centralized monitoring and control. Deploying a new Facility Management System (Cartegraph) which improves machine/facility maintenance cycle process & efficiency City-wide Installing digital automation controls

13 OPTIMIZE WATER EFFICIENCY City Facility Water Use is down 30% from FY 2013

14 OPTIMIZE WATER EFFICIENCY Irrigation Use is up 16% from FY 2013; Total Water Use is up 3.5% from FY 2013
 in 2016 to smart irrigation technology (weather based controllers, flow sensors) $2,850 rebate through Miami-Dade Water and Sewer.")
15 OPTIMIZE WATER EFFICIENCY Upgrading flow & flush fixtures in city facilities Upgrading existing irrigation systems with smart controllers and flow sensors: Converted 9 systems (5 on US-1 and 4 in parks) in 2016 to smart irrigation technology (weather based controllers, flow sensors) $2,850 rebate through Miami-Dade Water and Sewer. Identifying an additional 5 systems for FY 18 Identifying irrigation systems that can use non-potable water Determine cost effectiveness of using rain water harvesting in larger facilities (Youth Center, Parking Garages, etc.)
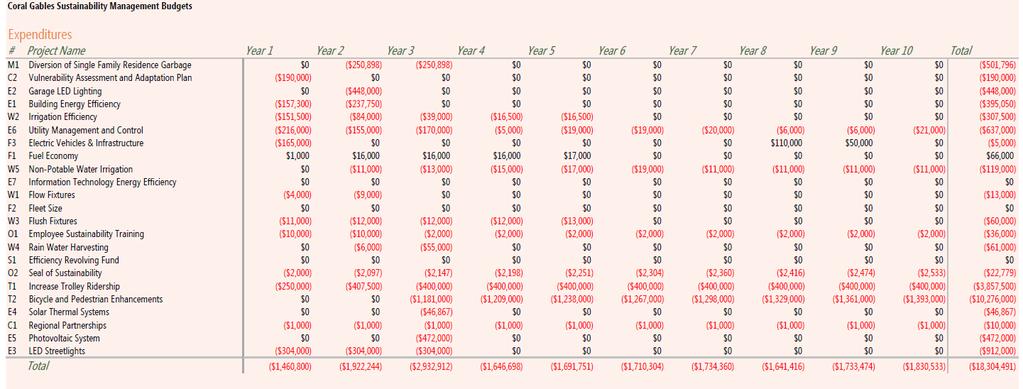
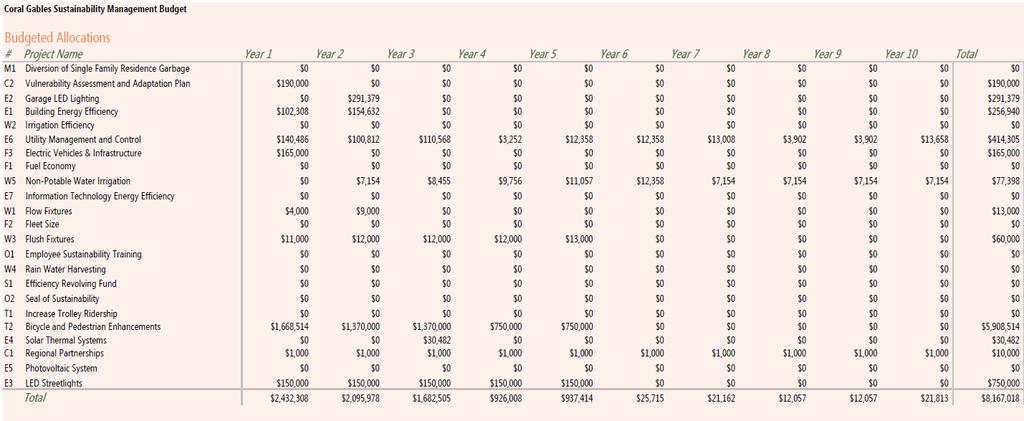
16 Sustainability Master Plan (SMP) Project Accomplishments E7 IT Energy Efficiency: Replaced all legacy computers and peripherals by Energy-Star certified energy efficient units; finished the virtualization of legacy servers to reduce infrastructure footprint and improve energy efficiency on datacenters; hardware lifecycle plans were updated to incorporate energy performance standards; implemented Virtual Desktop Infrastructure (VDI) for training rooms; continued replacing aged network infrastructure by energy-star certified energy efficient and smaller form-factor network equipment. C2 - Vulnerability Assessment and Adaptation Plan: Scheduled to be completed early this year F3 - Electric Vehicles & Infrastructure: Currently have 35 EV in the City Fleet. Adding 8 EV in FY 18. Goal is 78 over first 5 years. Parking Garage Charging Stations: 5,300 charging sessions; reduced gasoline consumption by over 6,200 gallons; Greenhouse Gas Emissions by 46,000 pounds O1- Employee Sustainability Training: Working with HR to coordinate. Includes getting staff LEED and ENVISION certified. Goal to train by the end of FY 18. O2 - Seal of Sustainability: Logo developed and is being placed on all city sustainability initiatives. C1 - Regional Partnerships: Staff continues to actively participate in the S. FL Regional Climate Compact
17 Sustainability Master Plan Projects FY 2018 Budget Recycling Containers in Parks/Right of Way: $96,000 Optimize Energy and Water Efficiency: $195,000 HVAC Replacements: $154,534 Motor Vehicles Replacement/Additions: $3.2 Million ($231,000 includes EV replacement) Installation of Bike Infrastructure: $600,000 LED Streetlights: $150,000 Employee Sustainability Training: $5,000 Sea Level Rise Mitigating Program (Infrastructure Reserve): $1,445,000

18 GREENHOUSE GAS EMISSIONS INVENTORIES
19
20 mtco2e Thousands RESULTS: GREENHOUSE GAS EMISSIONS REDUCTIONS Local Government Operations GHG Inventory and Forecast w/ Projected Reductions from Plan Projects Backcast value (13,368 MT CO2e) % reduction from
 while simultaneously utilizing this framework 44 Objectives 109 Outcome Measures 408 Local Actions 526")
21 Organization of the STAR Framework 7 Focus Areas While STAR has a predefined structure, a local government can still add Sustainability Recommendations into its Planning Process (that are more localized) while simultaneously utilizing this framework 44 Objectives 109 Outcome Measures 408 Local Actions 526 Indicators
22 Preliminary Score: or 3-STAR Community ( points) City recognized for sustainability leadership (when certified) Low Score High Score Built Environment 38.3/100 Climate & Energy 61.3/100 Economy & Jobs 58.2/100 Education, Arts & Community 43.5/70 Equity & Empowerment 10.5/100 Health & Safety 61.7/100 Natural Systems 40/100 Innovation & Process 10/50
 Albany, NY; Atlanta, GA; Beaverton, OR; Birmingham, AL; Chandler, AZ;")


23 How Coral Gables Compares to other Certified Communities 60 More in process (Sarasota County, Pinecrest, Marathon in FL) Albany, NY; Atlanta, GA; Beaverton, OR; Birmingham, AL; Chandler, AZ; Cleveland, OH; Des Moines, IA; El Cerrito, CA; Fayetteville, AR; Ft Collins, CO; Houston, TX; Indianapolis, IN; Las Cruces, NM; Lee County, FL; Monroe County, FL; Palm Bay, FL; Park Forest, IL; Phoenix, AZ; Reading, PA; Riverside, CA; Rosemount, MN; St. Louis, MO; St. Petersburg, FL; Woodbridge Township, NJ Points Austin, TX; Broward County, FL (436.7); Burlington, VT; Davenport, IA; Dubuque, IA; Evanston, IL; Louisville, KY; Memphis, TN; Plano, TX; Portland, OR; Raleigh, NC; Tacoma, WA; Tucson, AZ Washington, DC; West Palm Beach, FL Points Baltimore, MD; Northampton, MA; Seattle, WA Points
24 Sustainability Master Plan Development Process All of the projects identified in the SMP have been: Developed, reviewed, approved by the project managers/division directors Aligned with the City s 3-year Strategic Plan Aligned with the 5-year Capital Improvement Plan Action Item City Administration approval of project portfolio/budget estimates Next Steps Updating the original SMP and completing a 2017 GHG Inventory Simultaneously working to finalize outreach/communication plan which includes: A comprehensive final draft of the SMP A short summary of the SMP A 1-page overview of Plan Present to Commission