Leaving our Corners Real Change in Today s Global Energy Climate
|
|
|
- Gwendoline Barker
- 5 years ago
- Views:
Transcription

1 Southern Gas Association November, 2013 Leaving our Corners Real Change in Today s Global Energy Climate Scott W. Tinker Bureau of Economic Geology The University of Texas at Austin, Austin
2 Framing Observation A majority of the public do not know where electricity comes from or how it is made; nor do they particularly care. Therefore, energy policy makers are free to do incredibly dumb things, even if well intended. Energy education is imperative.

3 Outline THE MOST IMPORTANT ISSUE OF OUR TIME ENERGY RESOURCES Electricity Transportation LEAVING OUR CORNERS
4 Overarching Themes No energy source is perfect Energy security drives the pace of change Efficiency requires a change in thinking Energy transitions take time
5 Population (millions) Primary energy (quads) Global Population and Energy Year Source: BP Statistical Review of World Energy, QAe874


6 Population ~1 billion people per color More people live inside the circle than outside
.")

7 TPER per capita Energy and GDP 9,000 8,000 7,000 6,000 5,000 TPER = Total Primary Energy Requirement. Energy needed to facilitate Total Final Consumption (TFC does not include conversion and transmission losses). Australia United States 4,000 3,000 2,000 1, World China ~3 billion people Korea Brazil India After: Rice World Gas Trade Model Medlock, 2012 GDP per capita Japan 5,000 10,000 15,000 20,000 25,000 30,000 35,000 40,000 45,000 QAe963
8 Outline THE MOST IMPORTANT ISSUE OF OUR TIME ENERGY RESOURCES Electricity Transportation LEAVING OUR CORNERS

9 U. S. Energy Flows Solar 0.09 Nuclear 8.45 Hydro 2.45 Wind 0.51 Geothermal 0.35 Natural gas Coal Electricity generation Net electricity Imports Residential Commercial 8.58 Energy services Industrial Electricity Transportation (2008 Quads) Source: Lawrence Livermore National Laboratory and U.S. DOE based on Annual Energy Review, 2008 (EIA, 2009) From National Academies Press, America s Energy Future, 2009 QAd8174

10 The Future Mix 120 North America Quadrillion BTUs Europe Asia Pacific Electricity Generation by Fuel Renewables Nuclear 20 Coal Gas 0 Oil ExxonMobil Corporation, 2010, The outlook for energy: a view to 2030: ExxonMobil report, 53 p.

11 The Future Mix Source: US EIA Short Term Energy Outlook 2011

12 The Future Mix
13 The Future Mix 120 North America Quadrillion BTUs Europe Asia Pacific Electricity Generation by Fuel Renewables Nuclear 20 Coal Gas 0 Oil ExxonMobil Corporation, 2010, The outlook for energy: a view to 2030: ExxonMobil report, 53 p.
14 ETS carbon price (EUA) (Euro per tonne) Coal consumption OECD Europe (million tonnes) The Future Mix Thomson Reuters; IEA
15 The Future Mix 120 North America Quadrillion BTUs Europe Asia Pacific Electricity Generation by Fuel Renewables Nuclear 20 Coal Gas 0 Oil ExxonMobil Corporation, 2010, The outlook for energy: a view to 2030: ExxonMobil report, 53 p.
16 BCF/Day Global Natural Gas Production Total North America Total S. & Cent. America Total Europe & Eurasia Total Middle East Total Africa Total Asia Pacific 115 Tcfy Source: BP Statistical Review 2012
17 Production cost (2008 $/Mbtu) Produced Conventional Coal Bed Methane Arctic Deep Water Natural Gas Supply Resources and Cost Tight 4X Shale Sour LNG ,000 1,100 Resources (trillion cubic meters) Source: IEA World Energy Outlook (2009) QAe980
18 Marketed Production (Tcf) U.S. Natural Gas Production and Reserves Annual U.S. Production End-of-Year U.S. Proved Reserves Proved Reserves (Tcf) 0 0 Data: BP World Energy 2012

19 U.S. Natural Gas Production (TcF) TcF TcF 9 TcF Shale gas Coalbed methane Tight gas Non-associated offshore Alaska Associated with oil Non-associated onshore
20 Billion cubic feet per day TcF/Year 2013 Dry Shale Gas Production Rest of US Bakken (ND) Eagle Ford (TX) Marcellus (PA and WV) Haynesville (LA and TX) Woodford (OK) Fayetteville (AR) Barnett (TX) Antrim (MI, IM, and OH) Year Source: U.S. Energy Information Administration QAe2255

21 QAe Dry Shale Gas Production Model: Rice University, Medlock, 2012 Actual
22 Billion cubic feet per day TcF/Year QAe Dry Shale Gas Production Forecast is Low to Actual Rest of US Bakken (ND) Eagle Ford (TX) Marcellus (PA and WV) Haynesville (LA and TX) Woodford (OK) Fayetteville (AR) Barnett (TX) Antrim (MI, IM, and OH) 10 In Actual 25 spite of popular prognostications about the poor economics of shale, parts of many basins 20 are economic, and technology and price allow 15 for continued drilling and production. 5 Rigorous, integrated, bottom-up geologic, engineering and economic studies provide a objective 2009 look at the future Year 5

23 U.S. Shale Gas Plays
24 Unconventional Reservoirs
25 Unconventional Reservoirs 1000 s of Feet of Rock
26 Unconventional Reservoirs 1000 s of Feet of Rock

27 Environmental Issues Regulatory Considerations I. Mandatory baseline data II. Cement all gas producing zones III. Minimize fresh water use on the front end IV. Full disclosure of chemicals V. Handle flowback and produced water a. Treat and reuse b. Dispose: characterize for faults VI. Minimize methane emissions VII. Minimize surface impact after Rao, 2012


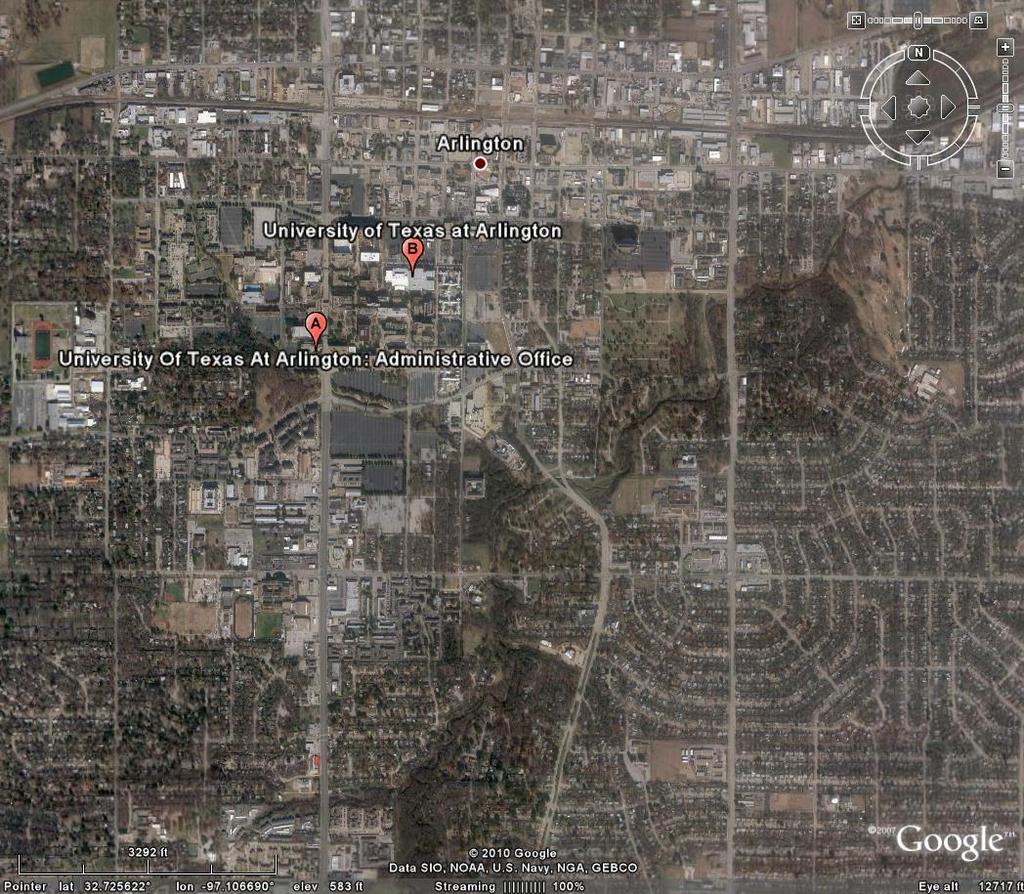
28 Barnett drilling location University of Texas at Arlington From XTO annual report Reducing Surface Disruption Carrizo location UT Arlington
29 Turnizontals 1 mile


30 Barnett Production Outlook Bottom Up! ~15,000 wells ~3,000 wells ~11,000 wells Model forecast was accurate for Browning, J. et al SPE Econ & Mgmt

")
31 Relative Frequency Economic Production Distribution Tcf 35 Tcf Barnett Tcf Cumulative Production (Tcf) Browning, J. et al SPE Econ & Mgmt
32 The Politics of Shale after Euan Means BP Data
33 The Politics of Shale Positive Mixed Neg Negative Positive Positive Positive Positive


34 Options to Fracking for Power I. Coal o Available, affordable to generate, reliable o Dirty, expensive to build II. Nuclear o Efficient, no emissions, affordable generation o Expensive to build, waste, safety III. Wind o Simple, affordable, no emissions o Intermittent, land and visual, transmission IV. Solar o Simple, no emissions, local o Expensive, intermittent, land V. Hydro o Efficient, affordable to generate, no emissions o Water, land, drought VI. Geothermal o Affordable where concentrated, no emissions o Geology
35 U. S. Energy Flows 6.82 Electricity generation Net electricity Imports Residential Natural gas Commercial Energy services Transportation Industrial Petroleum Transportation (2008 Quads) Source: Lawrence Livermore National Laboratory and U.S. DOE based on Annual Energy Review, 2008 (EIA, 2009) From National Academies Press, America s Energy Future, 2009 QAd8174
36 Per capita oil consumption (bbl/yr) The Future Transportation Mix U.S China Year BP Statistical Review of World Energy, CIA World Factbook, Census Bureaus, Marc Faber Limited, RJ Estimates From Raymond James and Associates, Inc., August 2, 2010

37 The Future Transportation Mix North America Millions of oil-equivalent barrels per day Europe Asia Pacific Other 15 Jet fuel Natural gas Fuel oil 10 Diesel Biodiesel Ethanol 5 Gasoline ExxonMobil Corporation, 2013 The Outlook for Energy: A View to 2040, page 20.
38 1000s Bbl Day Global Oil Production Total North America Total S. & Cent. America Total Europe & Eurasia Total Middle East Total Africa Total Asia Pacific BBY Source: BP Statistical Review 2012
 Source: IEA World Energy Outlook")
39 Production cost (2008 $) MB/d Long-Term Oil Supply Resources and Cost EOR Arctic Deepwater and ultra-deepwater CO 2 EOR Other conventional oil Oil shales 2X Shale oil Heavy oil & bitumen Gas to liquids Coal to liquids Produced MENA ,000 Resources (billion barrels) Source: IEA World Energy Outlook (2009)
40 Thousand barrels/year Annual US Oil Production From: James D. Hamilton, Working Paper 17759, NATIONAL BUREAU OF ECONOMIC RESEARCH, 2012


41 Tinker, 2012 San Antonio Eagle Pass+ Houston Eagle Ford Flaring and Rig Lights Unconventional Reservoirs Laredo+ Corpus The Valley 2012 Credit: NASA - NOAA 1994

42 U.S shale liquids projected growth.(mbpd) U.S. SHALE LIQUIDS PROJECTION 3.8 mmbod by % IRR: $68/bbl 10% IRR: $51/bbl 10% IRR: $50/bbl 10% IRR: $44/bbl 10% IRR: $50/bbl Monterey Woodford/Anadarko Utica Barnett Uinta Niobrara Permian Midland Permian Delaware Granite wash Eagle Ford 1 10% IRR: $44/bbl Bakken After Morse et. al., 2012, Energy 2020: North America, the new Middle East: Citi GPS: Global Perspectives & Solutions, figure 14, p. 17. IRR Source: Rystad Energy QAe465
 B a kk en ( ND ) Granite Wash (OK and TX) Bonespring (TX Permian) Wolfcamp (TX Permian) Monterey (CA) Woodford (OK) Niobrara-Codell (CO) Sprayberry (TX Permian) Austin")
43 Million barrels per day Tinker, 2012 US Shale and Tight Oil Production E a g l e F o r d ( T X ) B a kk en ( ND ) Granite Wash (OK and TX) Bonespring (TX Permian) Wolfcamp (TX Permian) Monterey (CA) Woodford (OK) Niobrara-Codell (CO) Sprayberry (TX Permian) Austin Chalk (LA and TX) Right on Pace Year Source: U.S. Energy Information Administration QAe2254

44 Thousand barrels/year Annual US Oil Production 1.4 Bby shale oil by 2022 From: James D. Hamilton, Working Paper 17759, NATIONAL BUREAU OF ECONOMIC RESEARCH, 2012


45 Options to Oil for Transport I. Biofuels II. III. IV. o o o o o o o o o o Valuable supplement, lower carbon Scale, land use, cost Soil science, hydrogeology, fertilizers, weather, climate CNG, LPG, LNG, GTL Cleaner than oil, regionally cheap, available Dirtier than others, regionally expensive Subsurface, environmental, hydro, economics, policy Electricity Clean depending on source, efficient engine Expensive, chemicals, range See coal, natural gas, nuclear, hydro, wind, solar Hydrogen Ten years away
46 Outline THE MOST IMPORTANT ISSUE OF OUR TIME ENERGY RESOURCES Electricity Transportation LEAVING OUR CORNERS
47 Energy Security Affordable Available Reliable Sustainable Cost Price Volatility: stable or fluctuating Infrastructure: Cost to build the plant Access: substantial resources Intermittent: source consistent or variable Safe: natural/human causes Clean: air and atmospheric emissions Dense: land footprint Dry: fresh water use/risk
48 Energy Security Affordable Energy Sustainable 50% of primary energy Efficiency is wasted! Environment Economy

49 U. S. Energy Flows Solar 0.09 Nuclear 8.45 Hydro 2.45 Wind 0.51 Geothermal 0.35 Natural gas Coal Biomass Electricity generation Net electricity Imports Efficiency! Residential Commercial Industrial Rejected energy Petroleum Transportation (2008 Quads) Source: Lawrence Livermore National Laboratory and U.S. DOE based on Annual Energy Review, 2008 (EIA, 2009) From National Academies Press, America s Energy Future, 2009 QAd8174


50 Efficiency Benefits Save energy Lower emissions Less water Less infrastructure Less land Save $ Challenges Incentivize producers to produce less Expensive to install Requires a cultural change
51 Global Energy Mix (MTOE) , , ,987

52 Global Energy Mix (MTOE)


53 Global Global Consumption Consumption (Q) (Q) Global Consumption (Q) 100% % 80% % 70% % 45% % % 40% 30% % 35% % Tinker Forecast A Look at the Global Future 30% 70% Petroleum Consumption Coal Consumption Natural Gas Consumption Nuclear Electric Power Consumption Hydroelectric Power Consumption 60% 40% Biomass, Geothermal, Solar & Wind Consumption 30% 0% Energy 0.0 transitions take time % 25% % % 80% % % % % 10% % % % % % 0% 0.0 0%
54 Leaving our Corners Government Compromise Academia/NGO Industry


55 Summary Thoughts Oil and gas from shale will be a big part of the future and above ground challenges must be addressed. Energy security affordable, available, reliable, sustainable drives energy mix, and government policies that attempt to induce an energy transition often sound smart, but usually aren t. Diverse energy portfolios are inevitable, and for the most part desirable; efficiency is part of the energy portfolio. The global energy transition will take time; let s come out of our corners to The Radical Middle, where things get done.
56 Tinker, 2012