PV Activities at the University of Cyprus (UCY)
|
|
|
- Kristopher Hancock
- 5 years ago
- Views:
Transcription


1 PV Activities at the University of Cyprus (UCY) George Makrides University of Cyprus, PV Technology Laboratory

2 Outline Introduction PV Technology Laboratory Education and Training Testing and Services Ongoing and future Research activities Conclusions 2
.")

3 Acknowledgement Stimulating scientific excellence through twinning in the quest for sustainable energy (TwinPV). This project has received funding from the European Union s Horizon 2020 research and innovation programme under the agreement No

4 Introduction Energy crisis: Limited supply of fossil fuels Environmental impact of conventional fuel usage Satellite image NASA Satellite image NASA

5 PV potential in Cyprus Enormous prospects and potential especially in countries of high solar irradiance. Solar Irradiation in Cyprus is one of the highest in Europe. Based on the IRENA analysis, renewable energy could provide 25% to 40% of Cyprus total electricity supply in 2030 and 11,000-22,000 jobs. Source: JRC PVGIS 5


6 Challenges of PV technology Cost / Efficiency Improve Performance / Energy yield Reliability Grid/Market integration 6


7 Organizational Chart PV Technology Laboratory Faculty of Engineering Department of Architecture Department of Electrical and Computer Engineering Department of Mechanical and Manufacturing Engineering Department of Civil and Environmental Engineering 7
8 Highlights of PV Technology Laboratory Participation/coordination of over 60 national/international research projects Research quality/awards at international conferences Research funding of 10 Million over the past 6 years Over 250 research publications Comprises of 30 researchers 8
9 PV Technology Laboratory UCY Education and Training Testing and Services Ongoing and Future Research Activities 9


 in")
10 Academic courses ECE447: Renewable Energy Sources: Photovoltaics This course covers theoretical and practical aspects of photovoltaic technology and in particular introduces students to aspects of solar generation, technology characteristics, design principles and system types. ECE687: BIPV - Towards nearly zero energy buildings (NZEB) This course covers theoretical and practical aspects of building integrated photovoltaics (BIPV) in the domain of nearly zero energy buildings (NZEB). 10


 Microgrid Integration")
11 Academic courses New courses Building integrated Photovoltaics Socio-economics of renewables Grid integration of renewables Smart grids Energy Efficiency New laboratories Virtual Laboratory Environment Building integrated PV (BIPV) Microgrid Integration to VLE 11


12 Vocational Training - Photovoltaics 1. PV System Designer and Installer 2. PV System Inspection and Performance Testing according to EN Fundamentals of building integrated PV (BIPV) 4. Fundamentals of nearly zero energy buildings (NZEB) 12
13 PV Technology Laboratory UCY Education and Training Testing and Services Ongoing and Future Research Activities 13


14 Testing and Services UCY0 (2006) Outdoor Facility UCY1 (2010) Outdoor Facility PV Lab1 (2011) Indoor Facility UCY2 (2014) Outdoor Facility


15 Indoor / Outdoor testing Indoor Testing Electroluminescence Imaging Outdoor Testing Degradation PID 15

.")


16 UCY1 - CPV cell/module testing Accurate two-axis trackers (CPV testing). Solar irradiance assessment (DNI, GHI, DHI, spectrum). I-V curve acquisition (cell / module characterization). 16


17 UCY1 - Outdoor testing infrastructure Sensors for outdoor performance assessments 17

.")
18 UCY1 - Outdoor CPV infrastructure Complete I-V curve measurement of CPV modules. Measurements of parameters at maximum power point (V MPP, I MPP and P MPP ). Tracker accuracy (Black Photon sensor). 18


19 UCY2 - Outdoor testing infrastructure 19


20 UCY2 - Outdoor testing infrastructure Measurements of parameters at maximum power point (V MPP, I MPP and P MPP ). Programmable inverter for grid integration research. 20


21 Testing site Official testing site for over 40 different manufacturers: 21


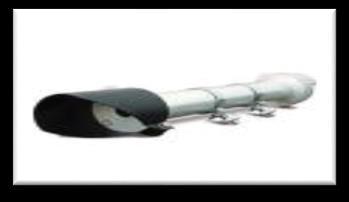
22 Innovative packaging material for improved energy yield Up to 10 o C temperature difference Reduced thermal losses Improved reliability expected 22


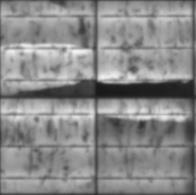
23 Results Reliability EL imaging after two years EL images after two years ucy1-05 Black thermal management backsheet ucy1-06 FPE black control backsheet ucy1-07 FPE white control backsheet ucy1-09 FPF black control backsheet 23

24 Comparative energy yield and failure endurance study Comparative energy yield studies of latest technologies. Failure endurance of backsheet materials. 24
25 NOCT and PV module exposure testing NOCT measurements (IEC Clause 10.5). PV module exposure testing. 25


26 PID testing infrastructure Model PID progression and occurrence. rain gauge 27.5 o Source: SMA 26


27 PID testing infrastructure Acquisition of leakage current and shunt resistance for PID. 27

28 Indoor testing infrastructure UV Simulator Climatic Chamber Solar Simulator Infrastructure suitable for IEC 61215, and testing 28

29 Test Report Indoor testing infrastructure 29


30 PV system consulting Advanced site survey and shading analysis studies. PV system Techno-economic analysis. Shading analysis for MW plant in Tamasos. 30
31 Desalination water cost (c /m 3 ) Solar Desalination Plant Desalination plant PV potential in Larnaca to Lower Water Cost: Current water cost from Larnaca Desalination Plant: 85 c /m 3 Electricity cost accounts for 50% 58% of water cost c /m c /m Current water cost (c /m3) Expected cost after PV payback (c /m3) Expected cost over lifetime (c /m3) Years 80 c /m 3 77 c /m 3 31
32 PV Technology Laboratory UCY Education and Training Testing and Services Ongoing and Future Research Activities 32


33 Main Research Areas PV performance and modelling: reliability, degradation, and performance of PV technologies, system issues as well as building integration. Grid integration issues: power quality, control techniques for distributed generation, market tools and storage. Energy management systems: smart grids, demand side management and energy forecasting. 33


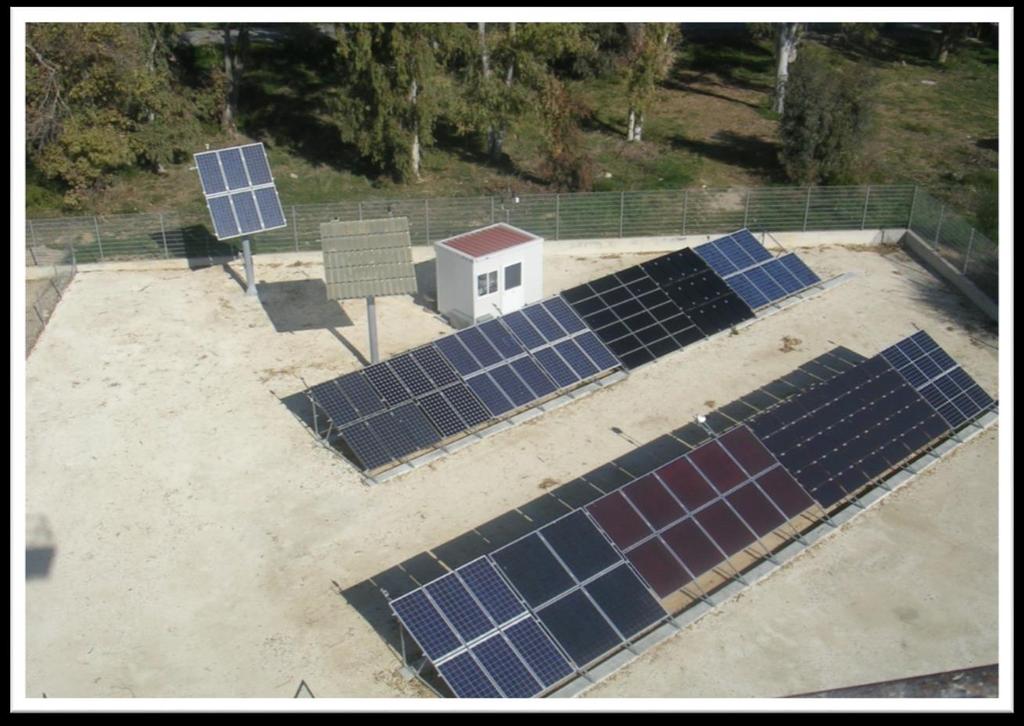
34 PV research at the UCY In order to evaluate the PV performance outdoors in Cyprus the PV testing infrastructure, was installed in 2006 in collaboration with the Institute of Physical Electronics, University of Stuttgart. 34


35 Before and after First PV research infrastructure in Cyprus 35


36 PV system installation Nominal power 1 kwp Same inverters Fixed-plane plane of array 27.5 Two-axis tracker 36
 Mono-crystalline Silicon Back Contact Cell (Sunpower) Mono-crystalline Silicon HIT (Sanyo) Cadmium Telluride (First Solar) Copper Indium Gallium Diselenide, CIGS (Wurth Solar)")
37 PV system installation Mono-crystalline Silicon (Atersa) Multi-crystalline Silicon (SolarWorld, Solon) Amorphous Silicon (Schott Solar, MHI) EFG and Main (Schott Solar) Mono-crystalline Silicon Saturn (BP Solar) Mono-crystalline Silicon Back Contact Cell (Sunpower) Mono-crystalline Silicon HIT (Sanyo) Cadmium Telluride (First Solar) Copper Indium Gallium Diselenide, CIGS (Wurth Solar) Concentrator System (Concentrix Solar) 37

38 Electrical single line diagram 38


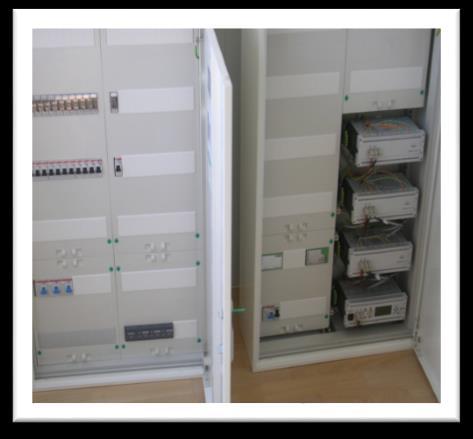
39 Performance data-acquisition system 39

40 Data Analysis Requirement for good quality data. IEC Photovoltaic system performance monitoring Guidelines for measurement, data exchange and analysis. Higher accuracy sensors Higher sampling rates 40
41 Performance vs climatic conditions (Cyprus and Germany) AC-Energy Yield [kwh AC /kwp rated ] Stuttgart Nicosia monocrystalline BP mono-c-si Atersa mono-c-si Sanyo HIT-Si SunPower mono-c-si Schott MAIN-Si multicrystalline Schott EFG-Si Solon multi-c-si SolarWorld multi-c-si average Mitsubishi a-si(1) Schott a-si(2) thin film First Solar CdTe Würth CIGS G. Makrides, B. Zinsser, M. Norton, G. Georghiou, M. Schubert, J. Werner, Potential of Photovoltaic Systems in Countries with High Solar Irradiation, Renewable & Sustainable Energy Reviews. 1) 41
 P DC STC A G POA Single-point Efficiency model with temperature correction (mathematical model) P DC T T 1 MPP STC A G T Module POA T STC")
42 Energy yield modeling The energy yield prediction of 4 models was investigated. Single-point Efficiency model (mathematical model) P DC STC A G POA Single-point Efficiency model with temperature correction (mathematical model) P DC T T 1 MPP STC A G T Module POA T STC Photovoltaics for Utility Scale Applications (PVUSA) model (empirical model) P DC G POA ag POA bt Amb cws One-diode model (electrical model) I I Ph I 0 e q( V IR nkt series ) V 1 IR R shunt series 42
43 Energy yield model prediction benchmark The models exhibited different prediction performance for the different technologies. Model prediction APE (%) Atersa (A-170M 24V) **BP Solar (BP7185S) Single-point efficiency Single-point efficiency with temperature correction PVUSA One diode Sanyo (HIP-205NHE1) Suntechnics (STM 200 FW) Schott Solar (ASE-165-GT-FT/MC) Schott Solar (ASE-260-DG-FT) SolarWorld (SW165) **Solon (P220/6+) Mitsubishi (MA100T2) *Schott Solar (ASIOPAK-30-SG) Wurth (WS 11007/75) First Solar (FS60) G. Makrides, B. Zinsser, M. Schubert, G. Georghiou, Energy yield prediction errors and uncertainties of different photovoltaic models, Progress in Photovoltaics: Research and Applications,
 90 80 70 60 50 20 10 0 100 (a) Schott Solar (MAIN) Schott Solar (EFG) SolarWorld *Solon PV field average")
 *Schott Solar (a-si(2)) PV field average AC Performance ratio (%) 90 80 70 60 50 20 10 0 Jun-06 (b) Sep-06 Dec-06 Mar-07 Jun-07 Sep-07 Dec-07 snow coverage Mar-08")
 Schott Solar (EFG) SolarWolrd Solon PV field average Jun-08 Sep-08 Dec-08 Mar-09 AC Performance ratio (%) 90 80 70 60 50 20 10")
 90 80 70 60 50 20 10 0 Jun-06 (b) Sep-06 Dec-06 Mar-07 Jun-07 snow coverage Sep-07 Dec-07 MHI (a-si) *Schott Solar (a-si(2)) PV field average Mar-08 Jun-08 Sep-08")
44 Performance comparison Nicosia-Stuttgart 100 Mono-c-Si 100 Multi-c-Si 100 Thin-film CIGS CdTe 100 Thin-film a-si AC Performance ratio (%) (a) Atersa *BP Solar Sanyo Suntechnics PV field average AC Performance ratio (%) (a) Schott Solar (MAIN) Schott Solar (EFG) SolarWorld *Solon PV field average AC Performance ratio (%) (a) Wurth Solar (CIGS) First Solar (CdTe) PV field average AC Performance ratio (%) (a) MHI (a-si) *Schott Solar (a-si(2)) PV field average AC Performance ratio (%) Jun-06 (b) Sep-06 Dec-06 Mar-07 Jun-07 Sep-07 Dec-07 snow coverage Mar-08 Jun-08 Atersa BP Solar Sanyo Suntechnics PV field average Sep-08 Dec-08 Mar-09 AC Performance ratio (%) Jun-06 (b) Sep-06 Dec-06 Mar-07 Jun-07 Sep-07 snow coverage Dec-07 Mar-08 Schott Solar (MAIN) Schott Solar (EFG) SolarWolrd Solon PV field average Jun-08 Sep-08 Dec-08 Mar-09 AC Performance ratio (%) Jun-06 (b) Sep-06 Dec-06 Mar-07 Jun-07 snow coverage Sep-07 Dec-07 Mar-08 Wurth Solar (CIGS) First Solar (CdTe) PV field average Jun-08 Sep-08 Dec-08 Mar-09 AC Performance ratio (%) Jun-06 (b) Sep-06 Dec-06 Mar-07 Jun-07 snow coverage Sep-07 Dec-07 MHI (a-si) *Schott Solar (a-si(2)) PV field average Mar-08 Jun-08 Sep-08 Dec-08 Mar-09 44


45 Performance comparison in Cyprus Year First Second Third Fourth Nicosia Suntechnics mono-c-si Würth Solar CIGS Sanyo HIT mono-c-si First Solar CdTe Suntechnics mono-c-si Würth Solar CIGS Sanyo HIT mono-c-si Atersa mono-c-si Suntechnics mono-c-si Schott Solar multi-c-si Atersa mono-c-si Sanyo HIT mono-c-si 15 sth Year c-siand Thin Film 45

46 Thermal loss on yearly energy yield Using the manufacturers MPP power temperature coefficients 8% 7% 8% 11% 5% 7% 10% 6% 12% June 2006 June % 10% 5% G. Makrides, B. Zinsser, A. Phinikarides, M. Schubert, G. Georghiou, Temperature and thermal annealing effects on different photovoltaic technologies, Renewable Energy,
47 Degradation / Performance Loss Rates Yearly performance loss rate of c-si was on average -0.6 %/year (over the 5-year period) Yearly performance loss rate of thin-film was %/year DC performance ratio (%) DC performance ratio (%) DC performance ratio (%) y= x Jun-06 Sanyo HIT mono-c-si Dec-06 Jun-07 Dec-07 Jun-08 Dec-08 Jun-09 Dec-09 DC PR time series Linear fit Jun-10 Dec-10 Jun Jun-06 Dec-06 Jun-07 Dec-07 Jun-08 Dec-08 Jun-09 Dec-09 DC PR time series Linear fit Jun-10 Dec-10 Jun Jun-06 Dec-06 Jun-07 Dec-07 Jun-08 Dec-08 Jun-09 Dec-09 DC PR time series Linear fit Jun-10 Dec-10 Jun-11 3-year 4-year 5-year 47
48 Protocol for Establishment of Degradation Worse than Manufacturers Warranty Better than Manufacturers Warranty 48


49 Long term Energy Yield First year Fourth year Eighth year 49

")

50 Failure modes Ethylene Vinyl Acetate (EVA) yellowing, corrosion and hot-spots. 50

51 Failure detection routines and algorithms Devices to detect faults and failures 51

52 Forecasting PV production Forecasting next day PV generation. NWP of irradiance and temperature Parametric models to forecast Power generation of PV (based on PV system specifications) 52

.")

53 Forecasting PV production Forecasting next day PV generation (less than 5 % RMSE). Server (Neural Network) Next-day PV production prediction AC Power NWP 53


54 Weather Stations 17 Weather stations 54


55 Demand-Side Management and Dynamic Tariff Model Development Optimize Electricity Consumption and PV Energy production Dynamic tariffs + DSM crucial for further PV Penetration 300 Pilot installations with smart meters and PV and DSM (virtual Smart grid) Behavioural change through dynamic tariffs Load profile ToU blocks :00:00 03:00:00 00:00:00 01:00:00 04:00:00 05:00:00 06:00:00 07:00:00 08:00:00 09:00:00 10:00:00 11:00:00 12:00:00 13:00:00 14:00:00 15:00:00 16:00:00 17:00:00 18:00:00 19:00:00 20:00:00 21:00:00 22:00:00 23:00:00 55


56 Grid integration of PV Investigating distribution grid constraints in the uptake of high levels of renewables: Grid Integration geographical and technical potential of PV Potential of EVs and distribution grid bottlenecks Demand side management 56


57 Future Research Over 10 European and National funded projects in the year

. Thermal and electrochemical storage facilities (up to 5 MWh). Use of heat pumps for improved efficiencies.")
58 Future Research Microgrid at the University of Cyprus Smart meters and sensors for data and local control for effective demand side management policy. Local PV generation directly connected to the local grid (400 kwp already connected and operated as self-consumption 10 MWp planned to be operational by 2017). Thermal and electrochemical storage facilities (up to 5 MWh). Use of heat pumps for improved efficiencies. Charging stations for electric vehicles. Full broad band connectivity with the local DSO for improved grid resilience. 58

59 Future Research Microgrid at the University of Cyprus 59


60 More information Website 60

61 Conclusion The future of PV is BRIGHT and has to be part of our Energy Mix. Our group is particularly active in this field of energy both in education and research, in the scope of developing the future perfect power system. 61


62 Dr. George Makrides University of Cyprus 1 University Avenue P.O , Nicosia Tel: makrides.georgios@ucy.ac.cy Website: Thank you for your attention Questions? 62